Bottom Reversal Pattern—Head and Shoulders Bottom
Gate Learn's intermediate futures series helps users build a structured framework for technical analysis, covering candlestick basics, chart patterns, moving averages, and trendlines, as well as technical indicators. In this article, we focus on the bottom reversal pattern—Head and Shoulders Bottom, covering its definition, features, application in BTC markets, and key considerations.
What Is a Head and Shoulders Bottom
A head and shoulders bottom forms after a sharp decline, where price creates three consecutive troughs—the middle one being significantly lower than the two on the sides. These troughs, from left to right, are known as the left shoulder, head, and right shoulder.
Taking BTC’s January 2024 price movement as an example:
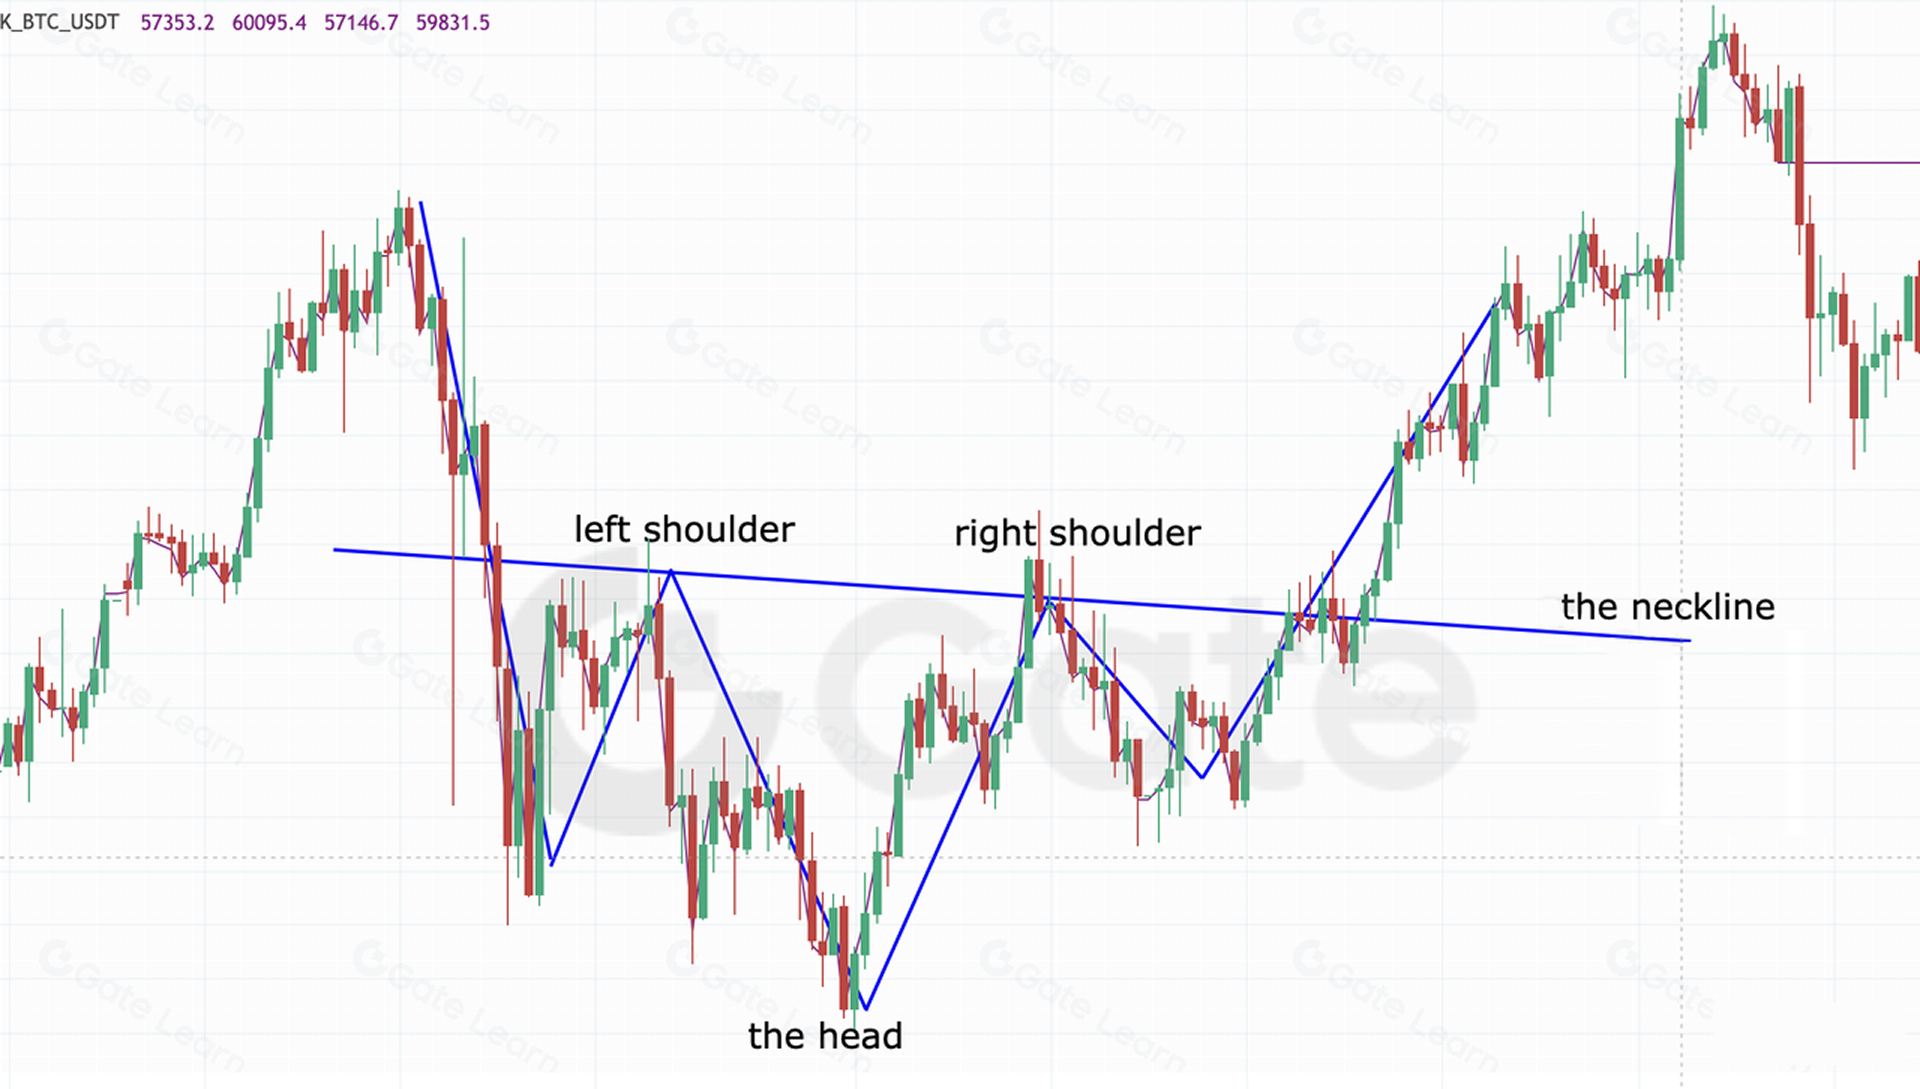
BTC fell from $49,000 to $38,500 within two weeks—a steep 21% decline. Later, near $42,000, a complex Head and Shoulders Bottom formed. After the price broke above the neckline and retested it successfully, BTC rallied to $73,500—a gain of more than 60% within five weeks, marking a strong trend reversal.
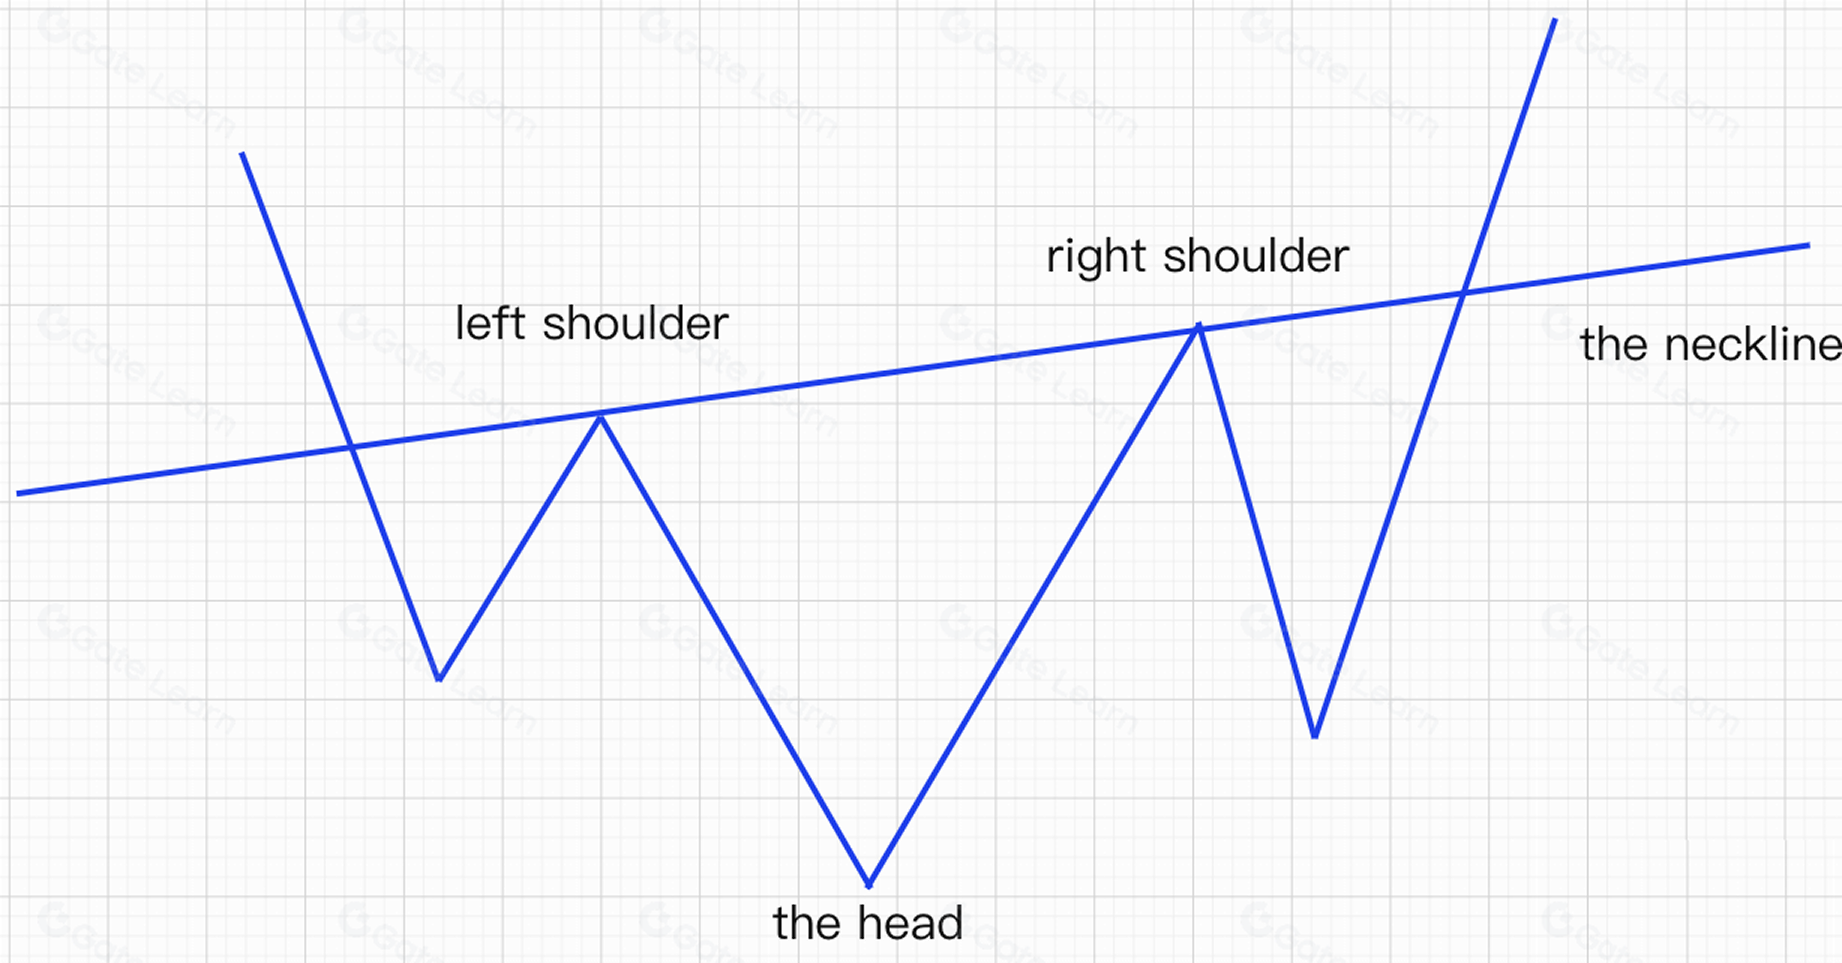
After simplifying the candlestick structure through technical analysis, the relative positions of the left shoulder, head, right shoulder, and the neckline connecting the shoulder highs become clearly visible.
Let’s study the specific technical characteristics of the Head and Shoulders Bottom:
- It appears after a sharp and extended downtrend.
- Price tests the bottom three times, forming three troughs: The left and right trough lows occur near the same level, which are the left shoulder and right shoulder; the middle trough is clearly lower, which is the head.
- The rebound highs of the left and right shoulders form the neckline. When the price breaks above this neckline, the pattern is confirmed.
- A breakout must be accompanied by a noticeable increase in volume; otherwise, the breakout may be false.
After understanding the technical characteristics of Head and Shoulders Bottom, let’s study when to buy and sell in actual trading.
Firstly, use the neckline as the boundary between bullish and bearish zones. The area above the neckline is the bullish zone, suitable for going long, while the area below the neckline is the bearish zone, suitable for going short.
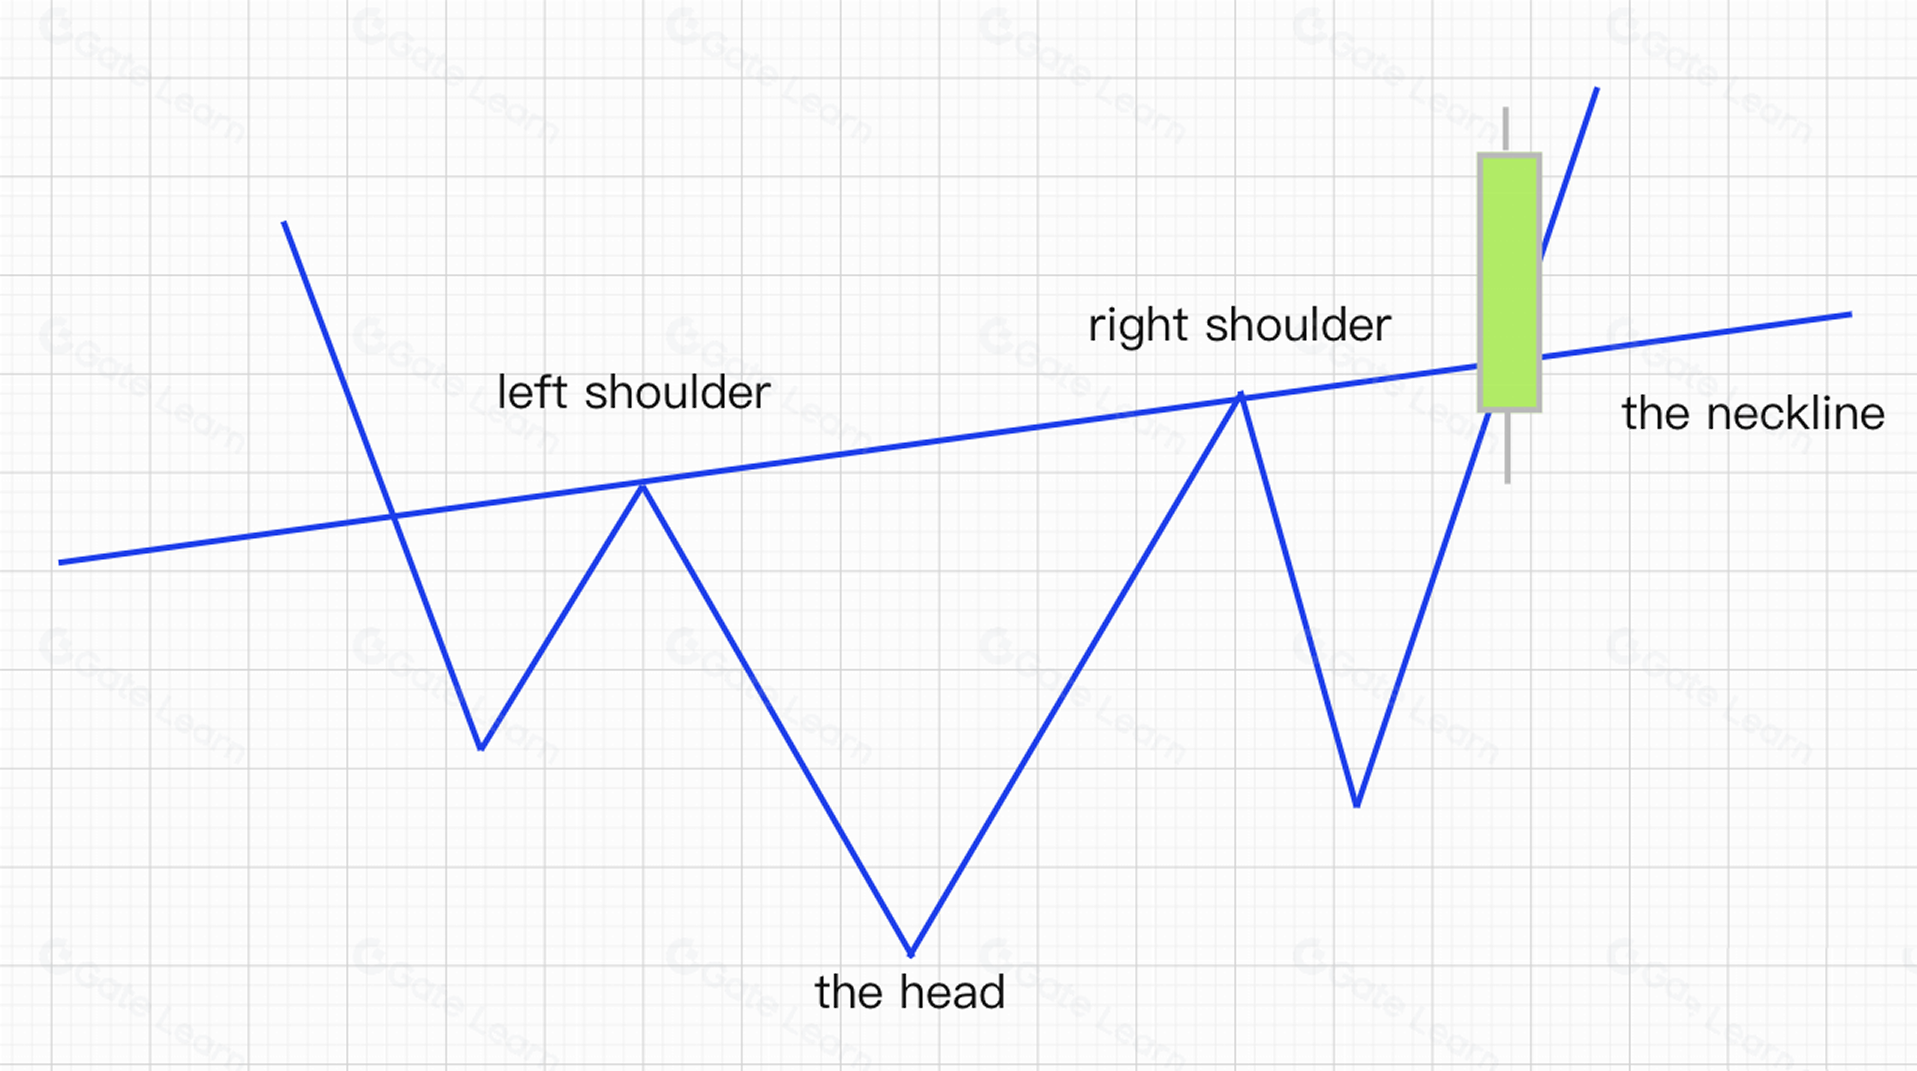
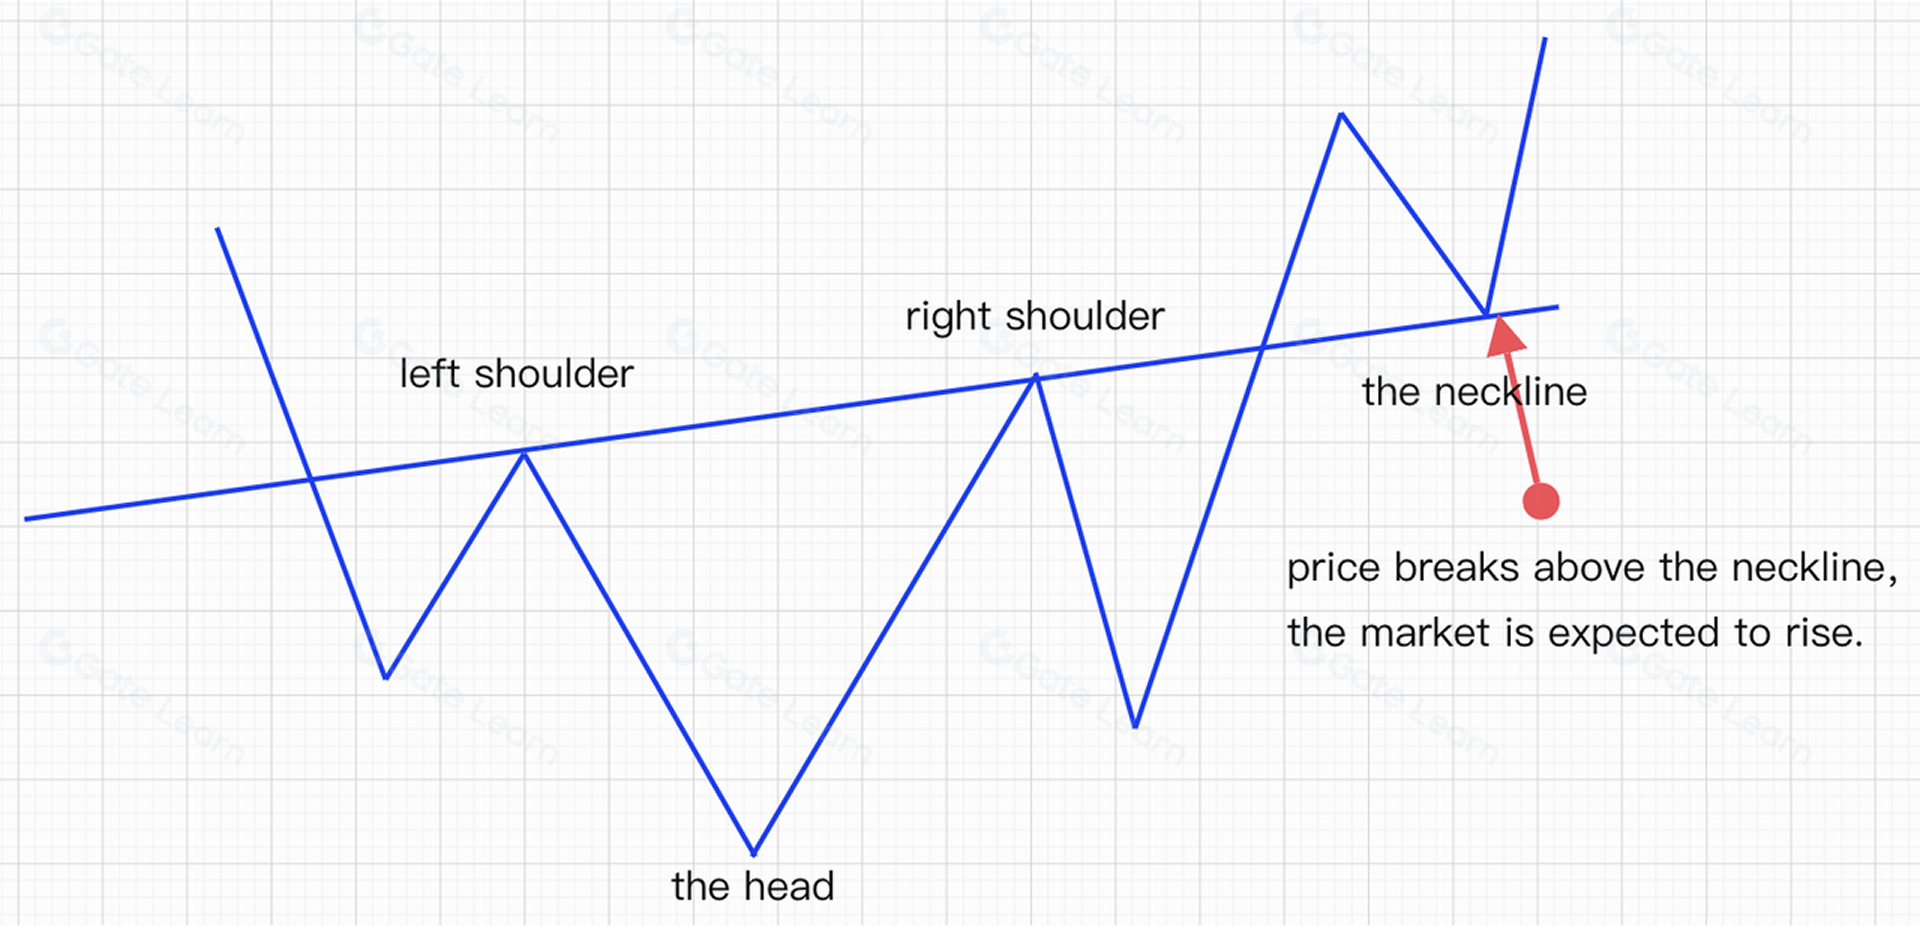
- Head and Shoulders Bottom Entry Opportunity #1: Breakout Above the Neckline
Once the Head and Shoulders Bottom pattern forms, a strong bullish candle breaking above the neckline signals the first clear buying opportunity. This confirmed pattern typically implies a high probability of upward continuation.
1.Head and Shoulders Bottom Entry Opportunity #2: Retest of the Neckline
After breaking the neckline, the price often pulls back to retest it. If the price rebounds after touching the neckline, this pullback confirmation creates the second buying opportunity.
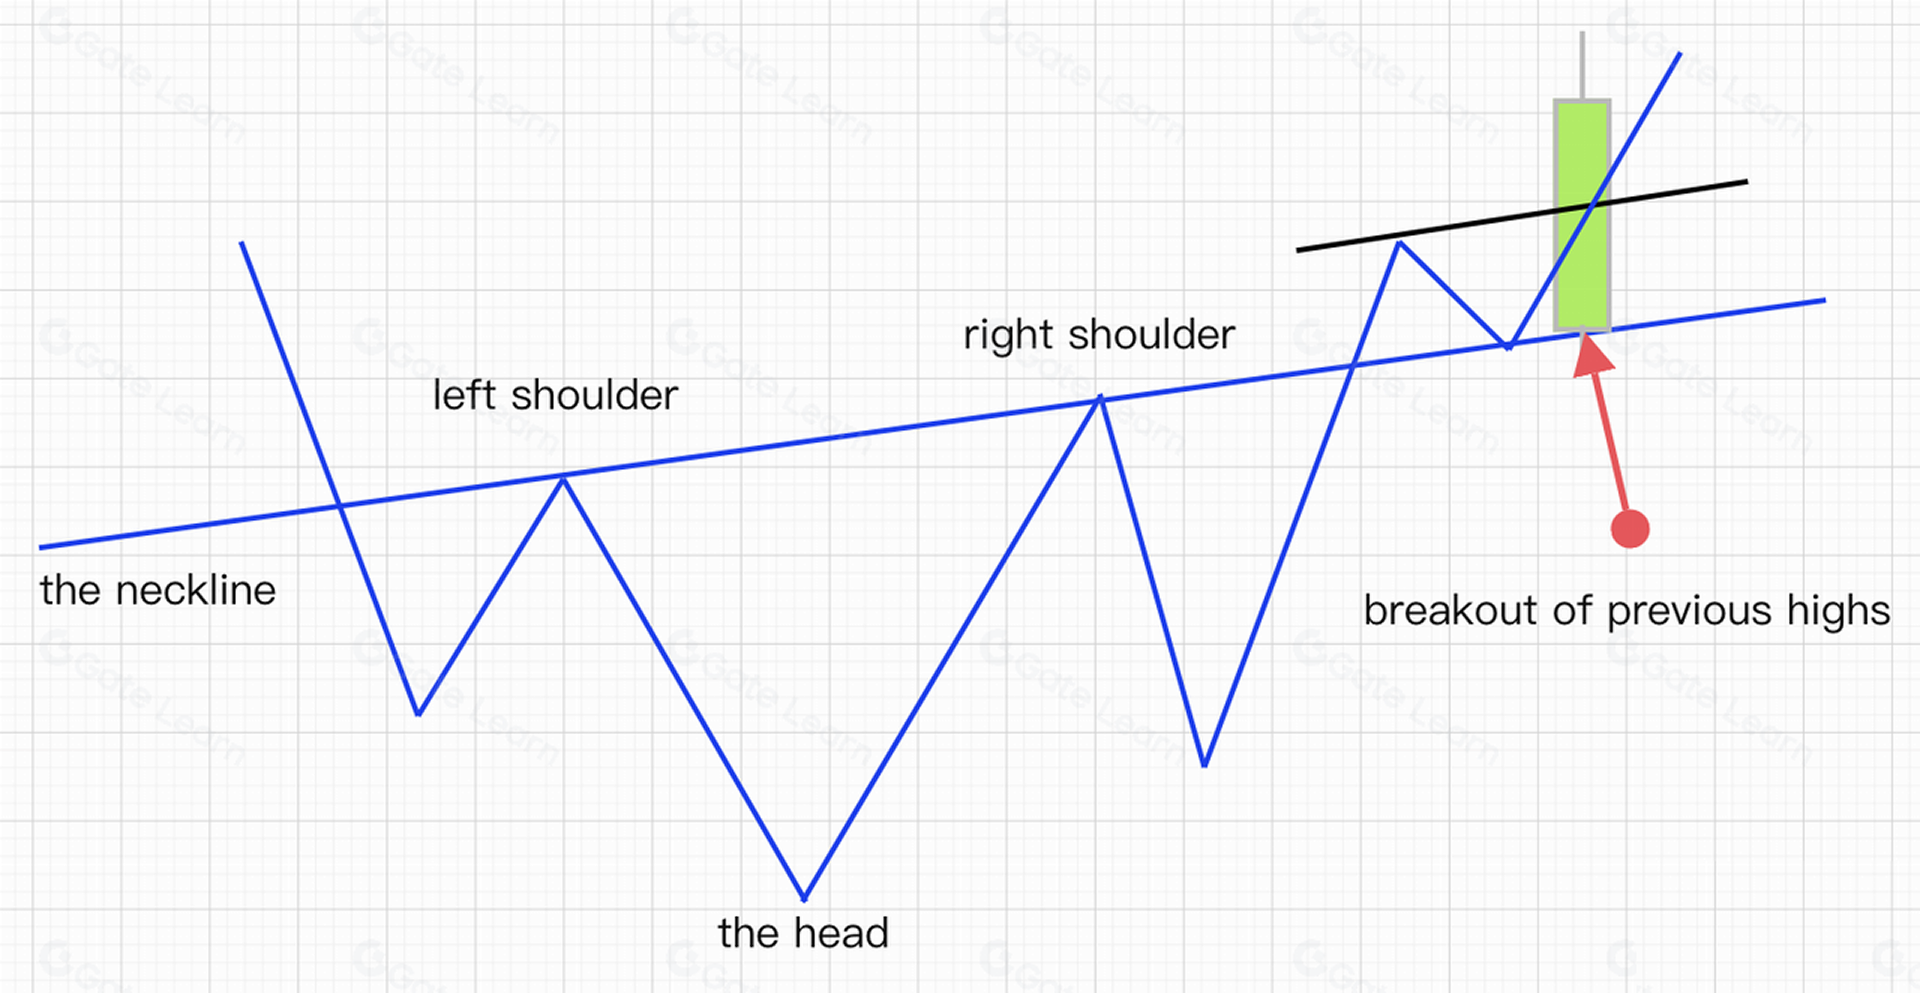
2.Head and Shoulders Bottom Entry Opportunity #3: Breakout Above the Previous High As the uptrend continues, a solid bullish candle closing above the previous swing high forms the third buying opportunity.
Summary of the Pattern and Its Trading Rules
To use the Head and Shoulders Bottom pattern effectively:
First, identify the three major structure points—left shoulder, head, right shoulder, and draw the neckline.
Second, look for the three typical buying opportunities: breakout of the neckline, pullback to retest the neckline, and breakout above previous highs.
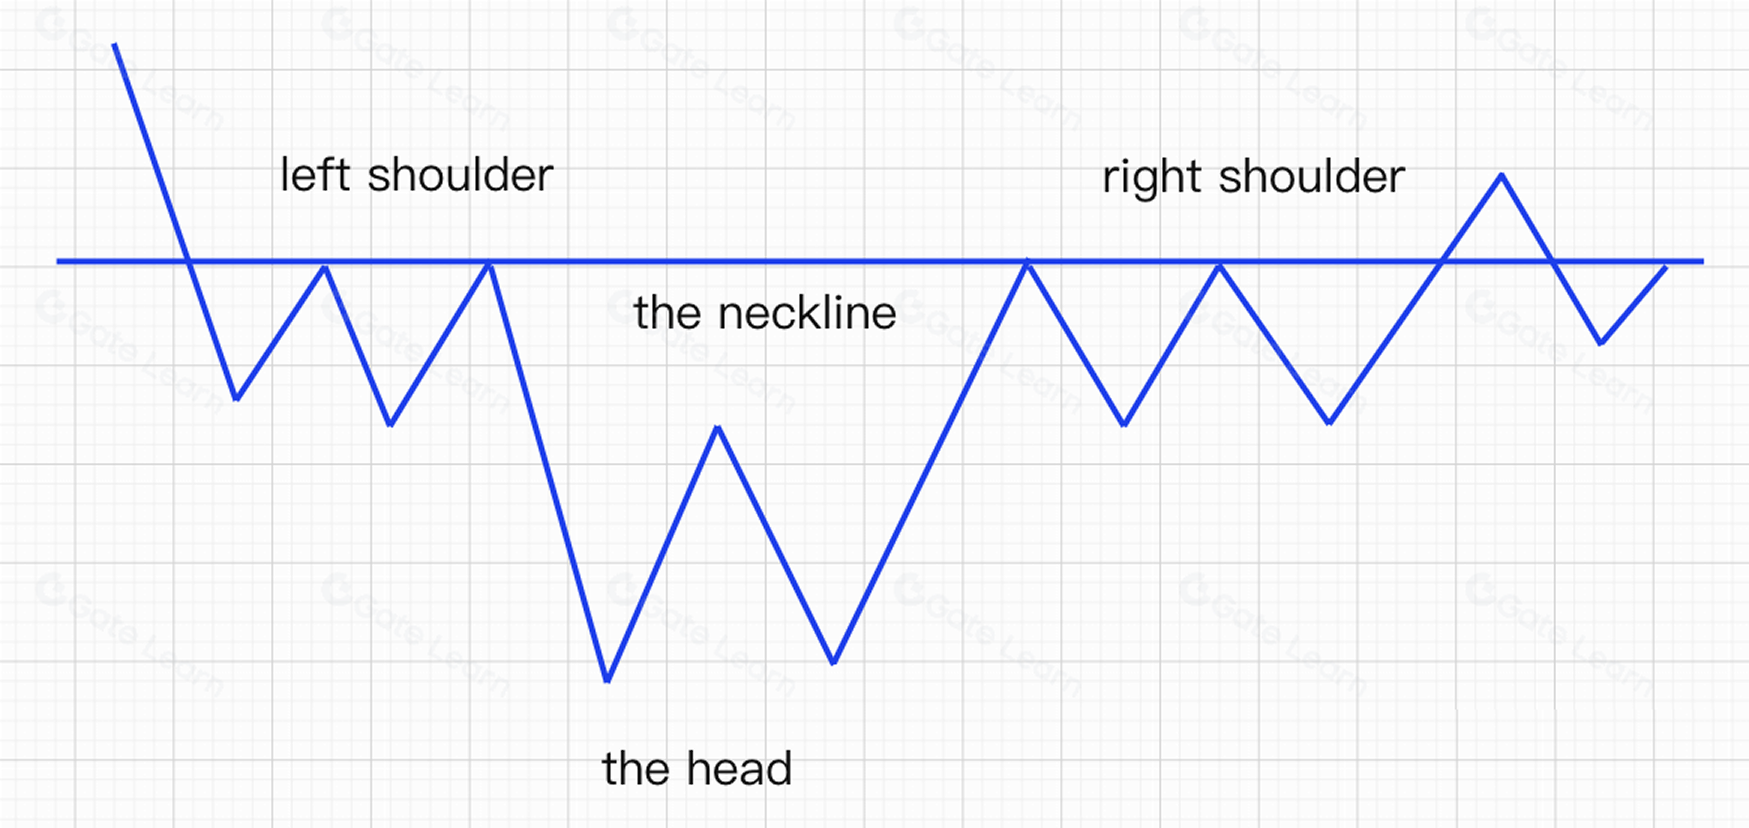
Complex Head and Shoulders Bottom
Because crypto markets are highly volatile, standard Head and Shoulders Bottompatterns rarely appear. Instead, irregular or complex Head and Shoulders Bottom patterns are more common. Complex head and shoulders bottom patterns are also trend-reversal patterns.
Appearing at the bottom, it indicates the end of a downtrend and the coming of an uptrend.
Appearing at the top, it indicates an uptrend’s end and a downtrend’s onset.
The Head and Shoulders Bottom pattern is generally a reliable bullish reversal pattern. However, the market always carries uncertainty. If you encounter the following scenario, even with a Head and Shoulders Bottom pattern, you should exit the market decisively.
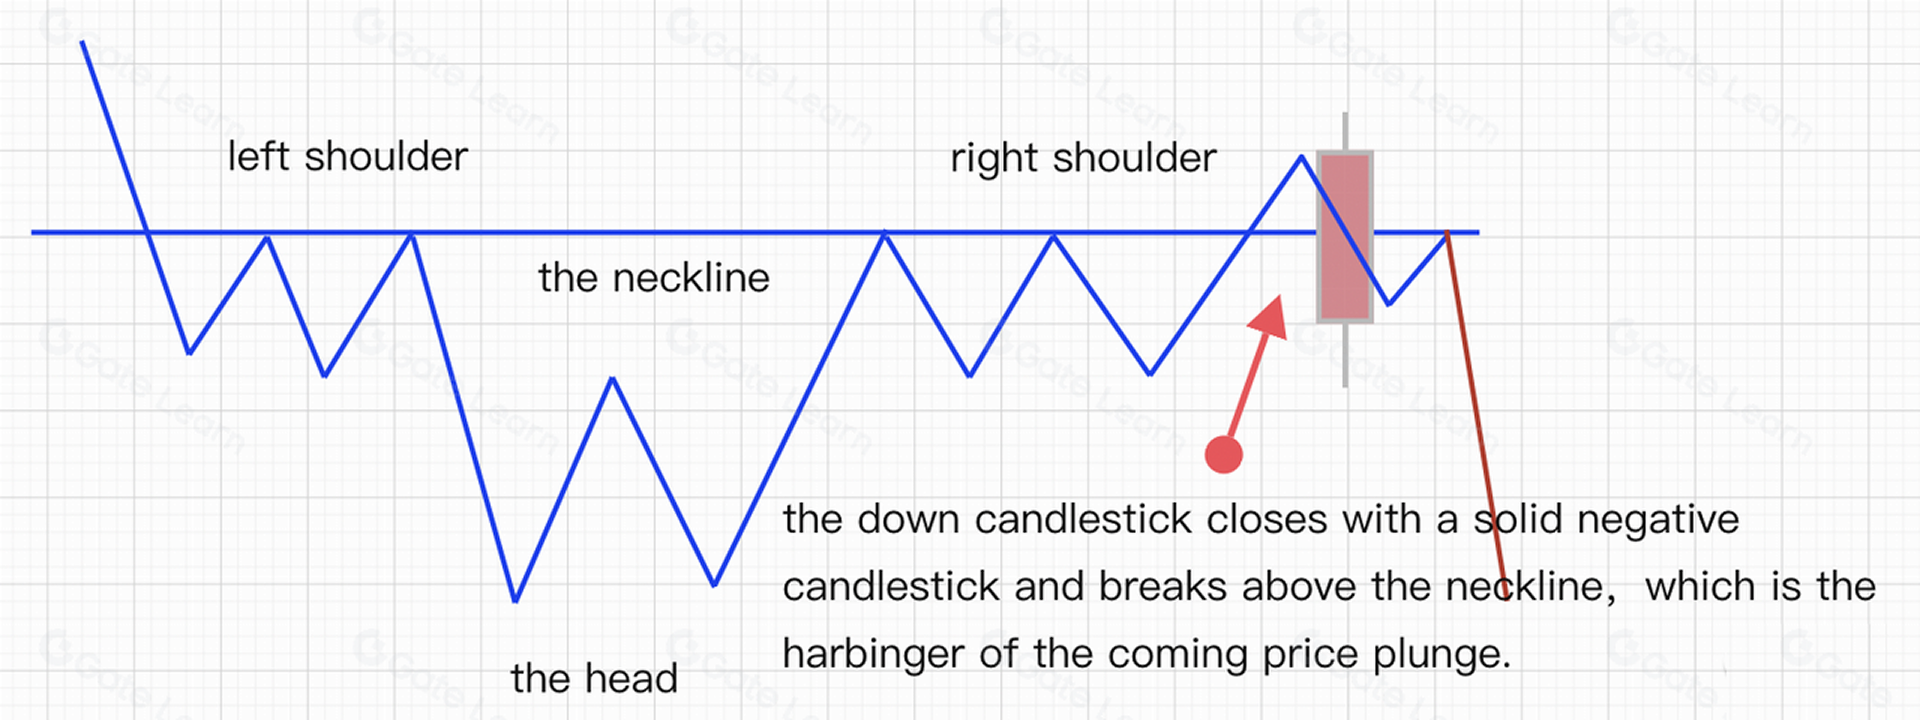
After forming the pattern, price rallies but then falls back below the neckline, and a strong bearish candle closes beneath the neckline, which signals stormy conditions ahead.
Often, price will attempt a secondary rebound toward the neckline but fail to break above it. If it cannot surpass the neckline or previous highs, this becomes the best exit opportunity before a deeper decline. Great traders maximize profits when winning and minimize losses when wrong—both are essential skills.
Summary
When a Head and Shoulders Bottom pattern appears at a market bottom, it is generally a reliable bullish signal and may indicate a trend reversal. Since trends have inertia, once confirmed, they often continue in the same direction—therefore, the breakout above the neckline is a genuine buying signal.
Apply what you’ve learned and train through practice—only then can you navigate the futures market with confidence. Visit the Gate futures platform and sign up to start your futures trading journey.
Disclaimer
This article is for informational purposes only. The information provided by Gate does not constitute investment advice, nor does Gate bear responsibility for any investment decisions made by users. Content involving technical analysis, market interpretation, trading strategies, or trader insights may include potential risks, uncertainties, and market variables. Nothing in this article guarantees profits, either explicitly or implicitly.
Lesson 1:What Is Technical Analysis in the Crypto Market?
Lesson 2:Common Bullish Candlestick Patterns
Lesson 3:Common Bearish Candlestick Patterns
Lesson 4:Bottom Reversal Pattern—Head and Shoulders Bottom
Lesson 5:How to Use the Top Reversal Pattern—Head and Shoulders Top
Lesson 6:How to Use the Bottom Reversal Pattern—Rounding Bottom
Lesson 7:How to Use the Top Reversal Pattern—Rounding Top
Lesson 8:How to Use the Bottom Reversal Pattern—Double Bottom (W-Shape)
Lesson 9:How to Use the Top Reversal Pattern—Double Top (M-Shape)
Lesson 10:How to Use the Bottom Reversal Pattern—V-Shaped Reversal
Lesson 11:How to Use the Consolidation Pattern—Ascending Triangle
Lesson 12:How to Use the Continuation Pattern—Descending Triangle
Lesson 13:How to Use the Continuation Pattern—Other Triangle Patterns
Lesson 14:How to Use the Continuation Pattern—Flag Pattern
Lesson 15:How to Use the Continuation Pattern—Wedge Pattern
Lesson 16:How to Use the Continuation Pattern—Rectangle Pattern
Lesson 17:Mastering Technical Analysis—Methodology Summary
Related Courses

Tools That Help You Trade Better: Moving Averages, Trend Lines, and Indicators

Gate Futures Trading Guide - A must-read for newbies

Futures Grid Trading User Guide
ETF Leveraged Tokens — Product Guide