How to Use the Bottom Reversal Pattern—Double Bottom (W-Shape)
Gate Learn's intermediate futures series helps users build a structured framework for technical analysis, covering candlestick basics, chart patterns, moving averages and trendlines, as well as technical indicators. In this article, we focus on the bottom reversal pattern—Double Bottom, covering its definition, features, application in BTC markets, and key considerations.
What Is a Double Bottom?
When the price of a crypto asset falls to a certain level, trading volume diminishes, showing that sellers are no longer willing to sell. The decline halts, and the price rebounds as buying interest increases, accompanied by rising volume.
However, the rebound soon encounters selling pressure and the price drops again. When it falls to nearly the same level as the previous low, the decline stops once more, and the volume decreases—even more than during the first drop.
At this point, the price begins a second rebound with noticeably stronger volume compared to the first rebound. This upward move successfully breaks above the previous rebound’s high, marking the completion of the Double Bottom pattern.
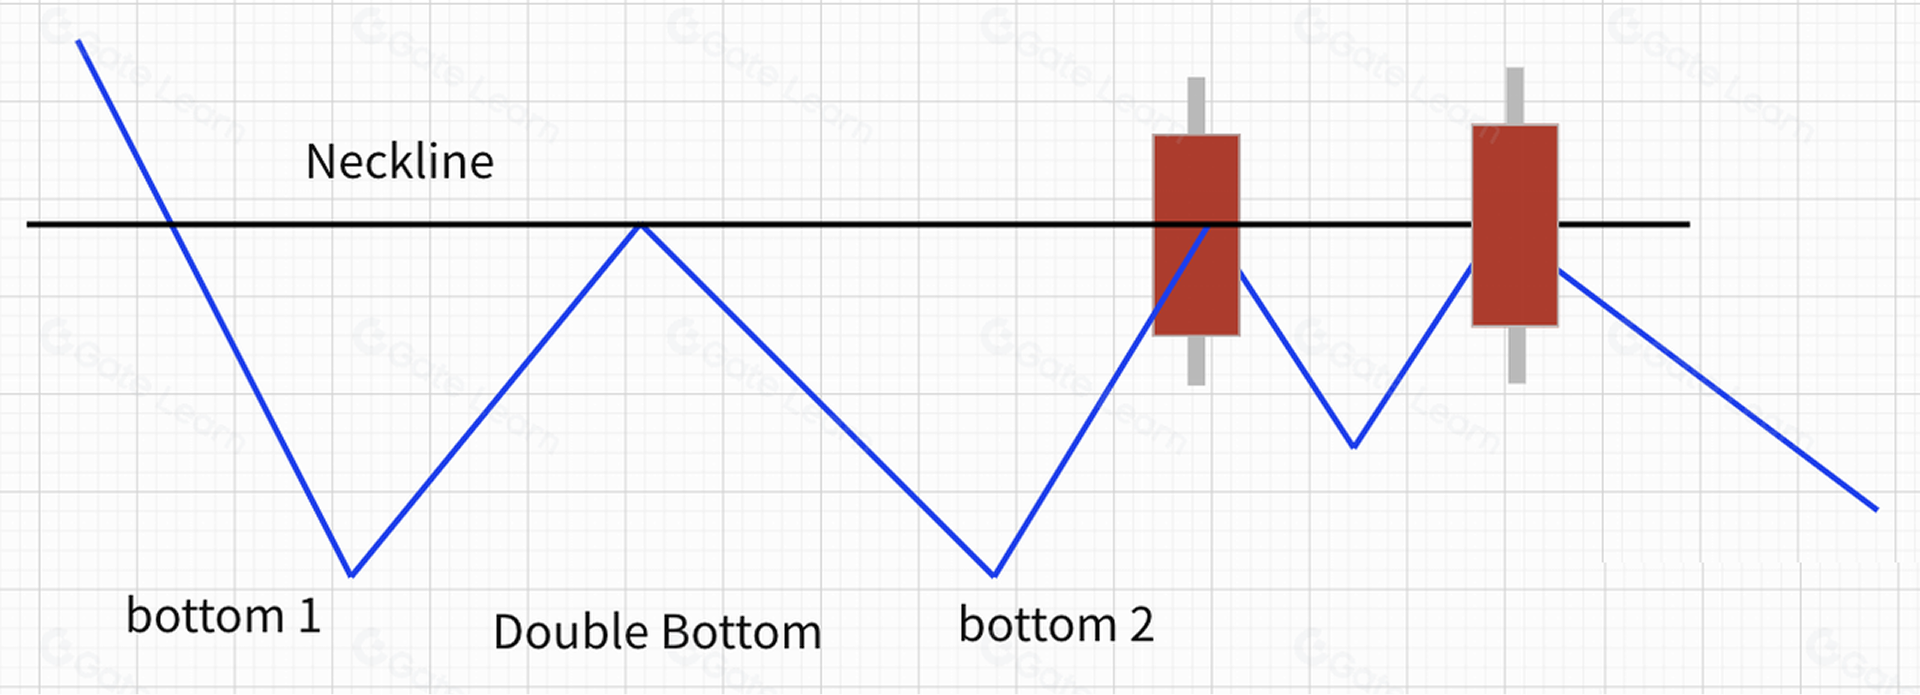
Visually, the pattern forms two valleys, hence the name “Double Bottom.” Because it resembles the letter “W,” it is also known as a W-Bottom, as shown below:
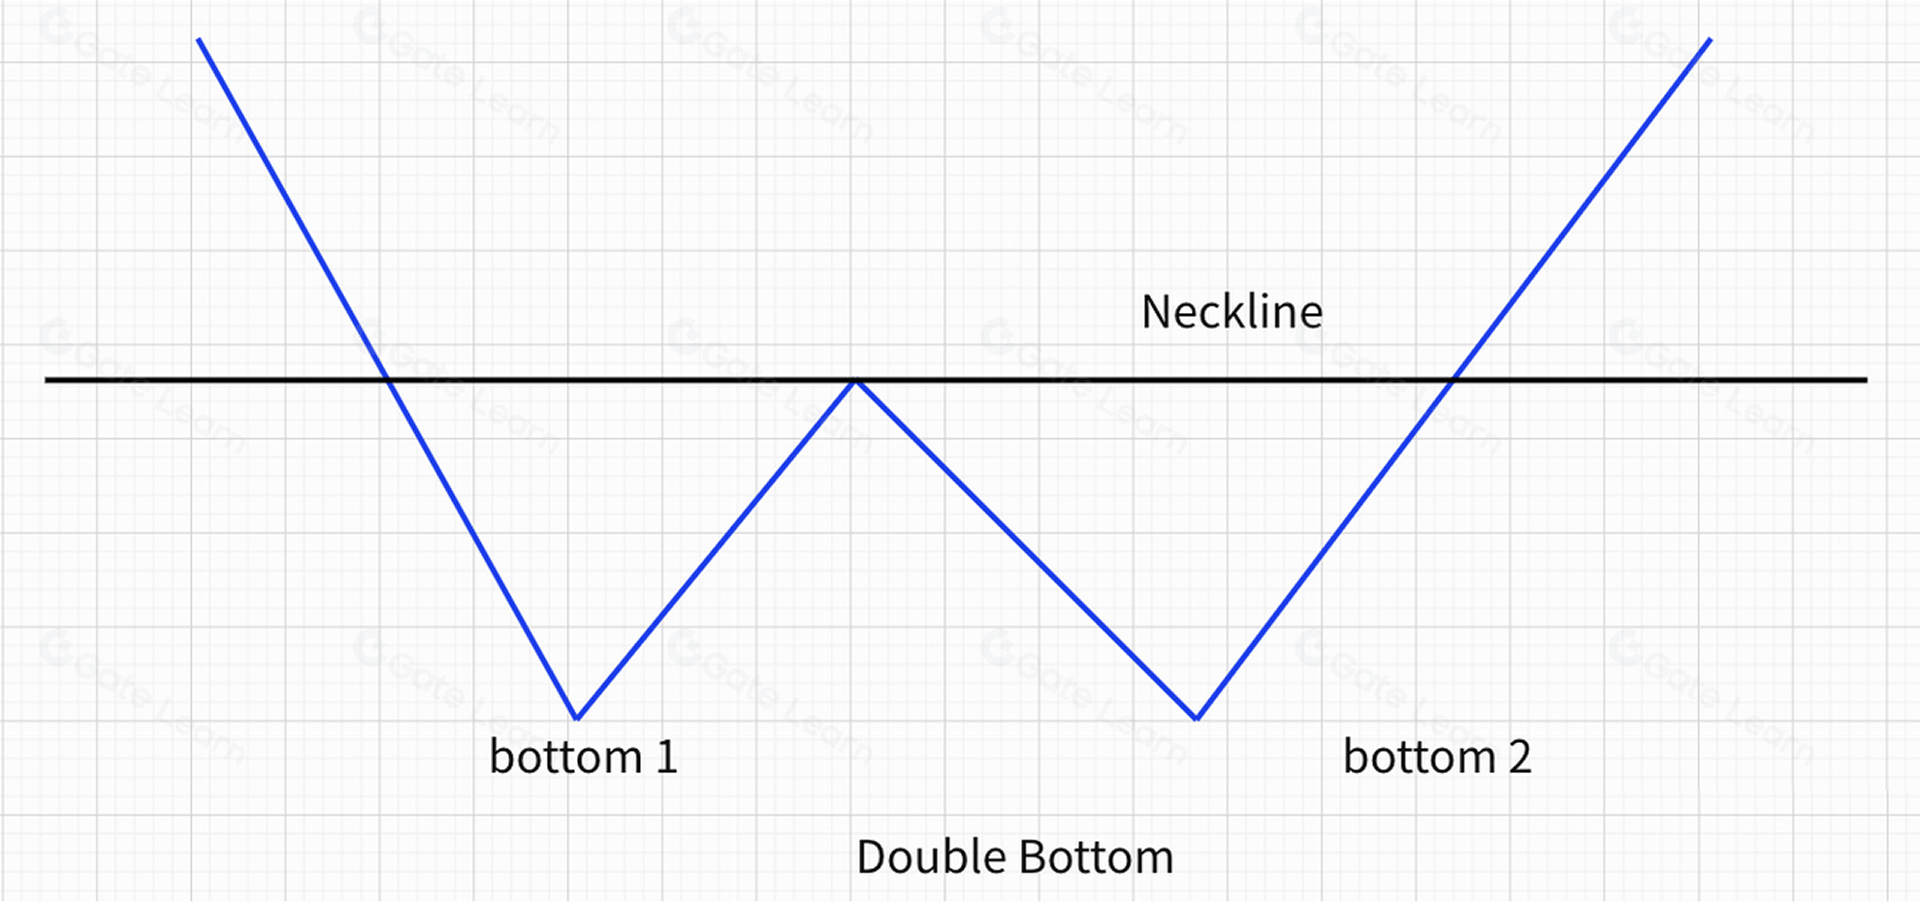
Drawing a horizontal line through the highest point of the rebound gives us the neckline, the key dividing line between bullish and bearish forces.
Technical Characteristics of a Double Bottom
- It appears at the end of a downtrend or a mid-term corrective trend.
- The two lows sit on roughly the same horizontal level, or the second low is slightly higher.
- For most patterns, the volume at the second low is smaller than at the first, but volume typically expands more during the second rebound.
- The neckline is usually a horizontal line drawn through the first rebound high, though it may be slightly slanted depending on the pattern.
Applications of the Double Bottom Pattern
A Double Bottom is a reversal pattern, signaling that the price has bottomed out and is turning upward—a buy signal. Its practical uses include the following examples:
Real Market Example
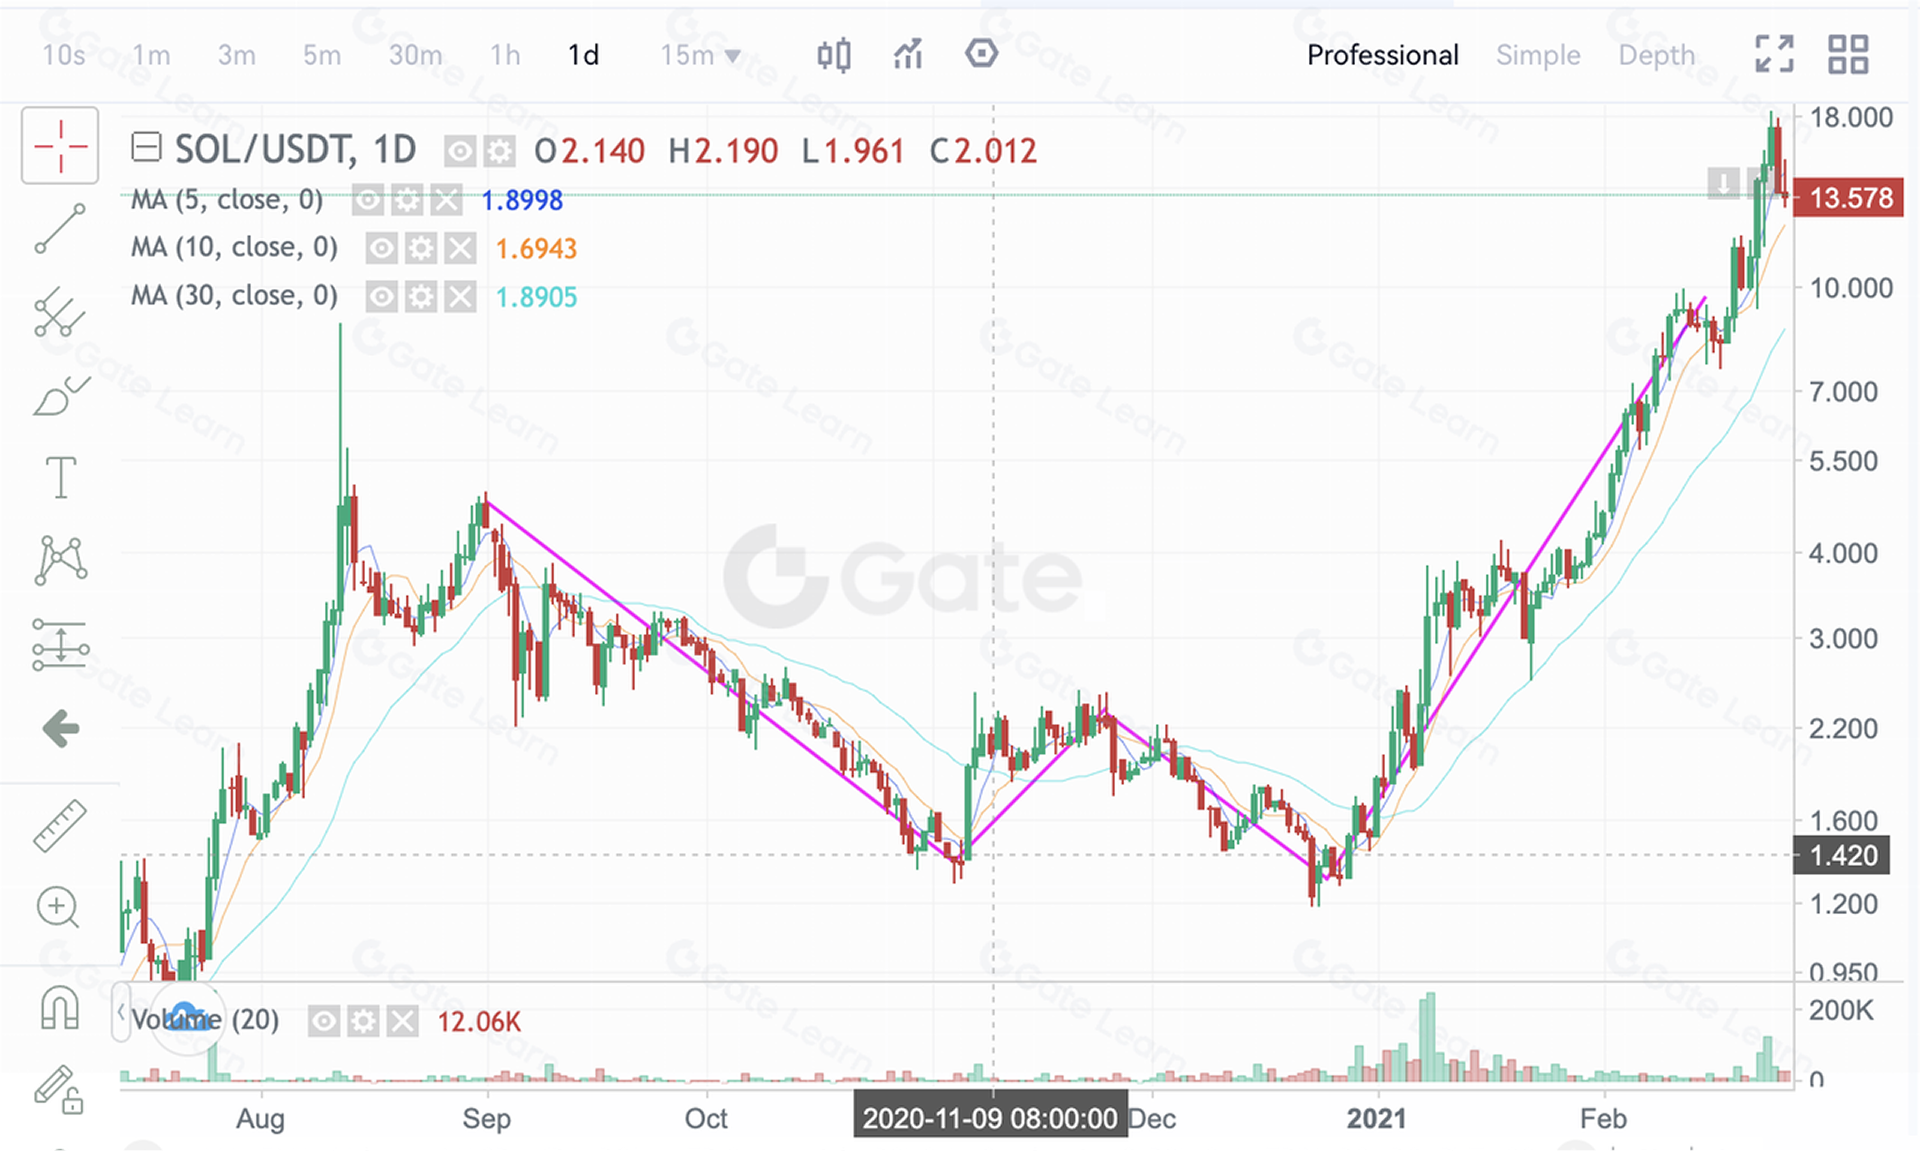
The chart above shows the SOL/USDT daily chart on Gate futures from 2020-09-01 to 2020-11-04. SOL fell from 4.5 USDT to a low of 1.28 USDT (a 72.8% drop), then staged a strong rebound to 2.4 USDT. As early bottom-fishers took profits, selling pressure emerged, and the price fell again to around 1.2 USDT, completing the Double Bottom formation. A massive bull run followed.
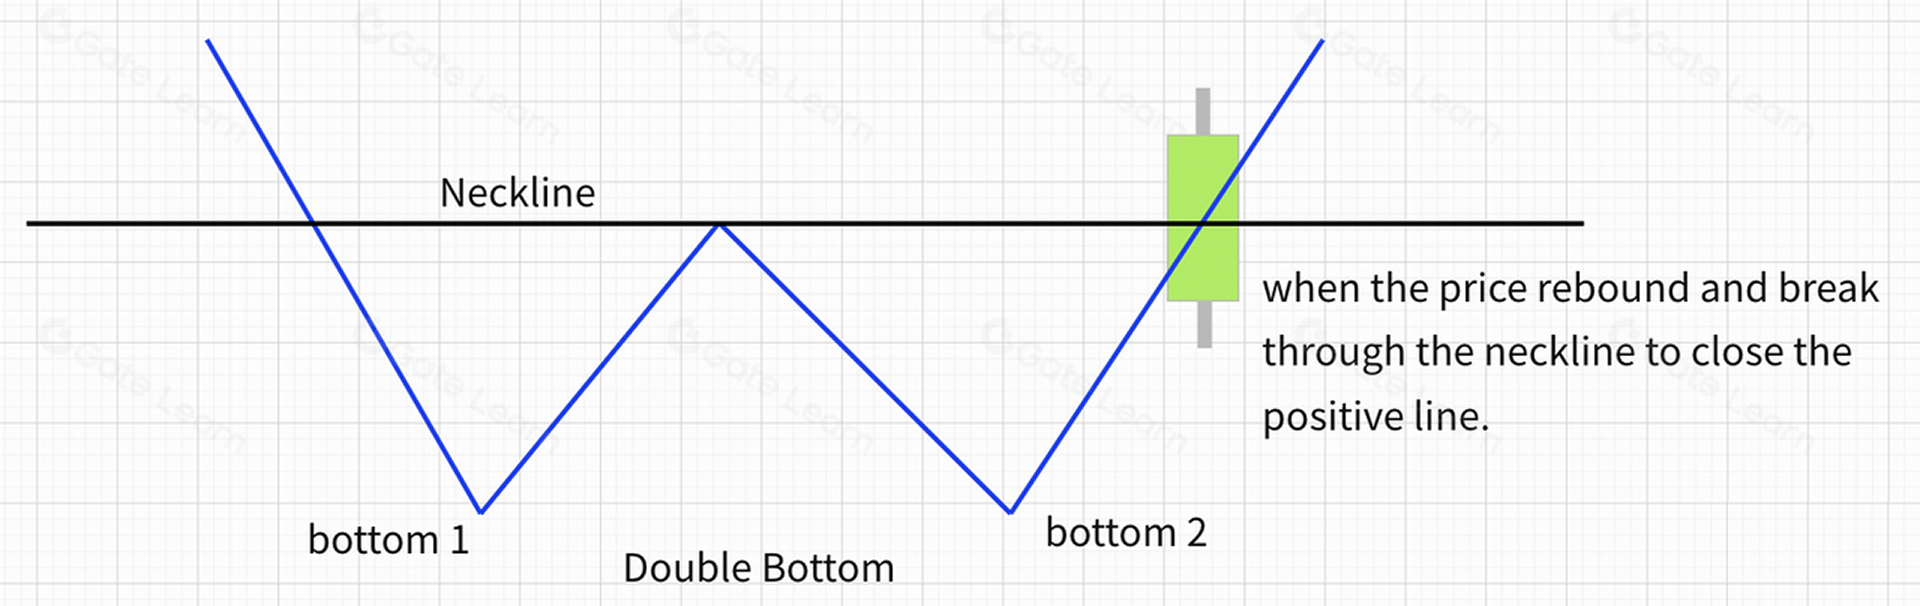
Double Bottom Buy Signal #1
When the second low forms and the price rebounds, a breakout above the neckline with a strong bullish candlestick generates the first buy signal, and the probability of further upside is relatively high.
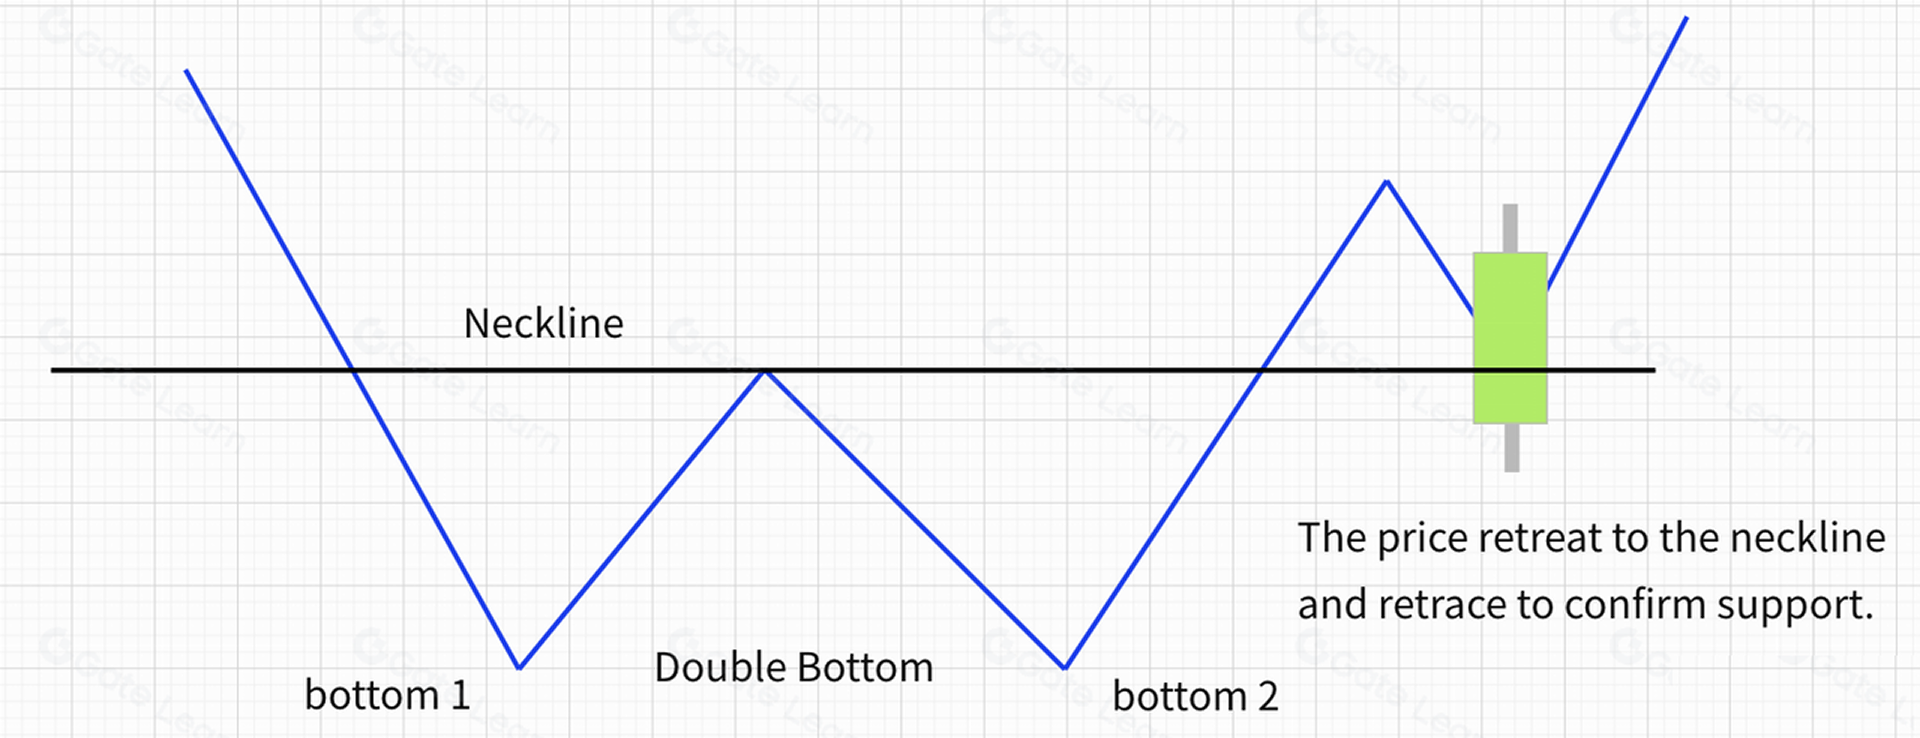
Double Bottom Buy Signal #2
After breaking the neckline, the price pulls back but holds above the neckline—confirming support. This produces the second buy signal.
Double Bottom Buy Signal #3
After the pullback to the neckline, the price rises again and breaks above the previous rebound high. If the bullish candlestick closes above the resistance level with a solid body, the third buy signal appears.
Finally, let’s summarize the Double Bottom trading techniques. First, draw the neckline through the rebound high. Then identify three buy points based on bullish candlestick closes:
- Breakout above the neckline → Buy #1
- Pullback to confirm neckline support → Buy #2
- Breakout above the previous rebound high → Buy #3
Double Bottoms Failure Conditions
Even if a Double Bottom forms, a successful reversal is not guaranteed. If the price retests the neckline and breaks below it with a strong bearish candlestick, it becomes a sell signal—often the precursor to a sharp decline, as shown below.
Summary
According to Dow Theory, the cornerstone of technical analysis, understanding trend structure greatly improves your ability to apply chart patterns. The Double Bottom is a textbook example of a trend reversal based on this theory.
For more information on futures trading, please visit the Gate futures platform and sign up to start your futures trading journey.
Disclaimer
This article is for informational purposes only. The information provided by Gate does not constitute investment advice, nor does Gate bear responsibility for any investment decisions made by users. Content involving technical analysis, market interpretation, trading strategies, or trader insights may include potential risks, uncertainties, and market variables. Nothing in this article guarantees profits, either explicitly or implicitly.
Lesson 1:What Is Technical Analysis in the Crypto Market?
Lesson 2:Common Bullish Candlestick Patterns
Lesson 3:Common Bearish Candlestick Patterns
Lesson 4:Bottom Reversal Pattern—Head and Shoulders Bottom
Lesson 5:How to Use the Top Reversal Pattern—Head and Shoulders Top
Lesson 6:How to Use the Bottom Reversal Pattern—Rounding Bottom
Lesson 7:How to Use the Top Reversal Pattern—Rounding Top
Lesson 8:How to Use the Bottom Reversal Pattern—Double Bottom (W-Shape)
Lesson 9:How to Use the Top Reversal Pattern—Double Top (M-Shape)
Lesson 10:How to Use the Bottom Reversal Pattern—V-Shaped Reversal
Lesson 11:How to Use the Consolidation Pattern—Ascending Triangle
Lesson 12:How to Use the Continuation Pattern—Descending Triangle
Lesson 13:How to Use the Continuation Pattern—Other Triangle Patterns
Lesson 14:How to Use the Continuation Pattern—Flag Pattern
Lesson 15:How to Use the Continuation Pattern—Wedge Pattern
Lesson 16:How to Use the Continuation Pattern—Rectangle Pattern
Lesson 17:Mastering Technical Analysis—Methodology Summary
Related Courses

Tools That Help You Trade Better: Moving Averages, Trend Lines, and Indicators

Gate Futures Trading Guide - A must-read for newbies

Futures Grid Trading User Guide
ETF Leveraged Tokens — Product Guide