How to Use the Consolidation Pattern—Ascending Triangle
Gate Learn's intermediate-level futures series helps users build a structured framework for technical analysis, covering candlestick basics, chart patterns, moving averages and trendlines, as well as the application of technical indicators. In this lesson, we will explain the application of the consolidation pattern—the ascending triangle—including the concept, characteristics, real BTC trading examples, and key considerations.
What Is an Ascending Triangle
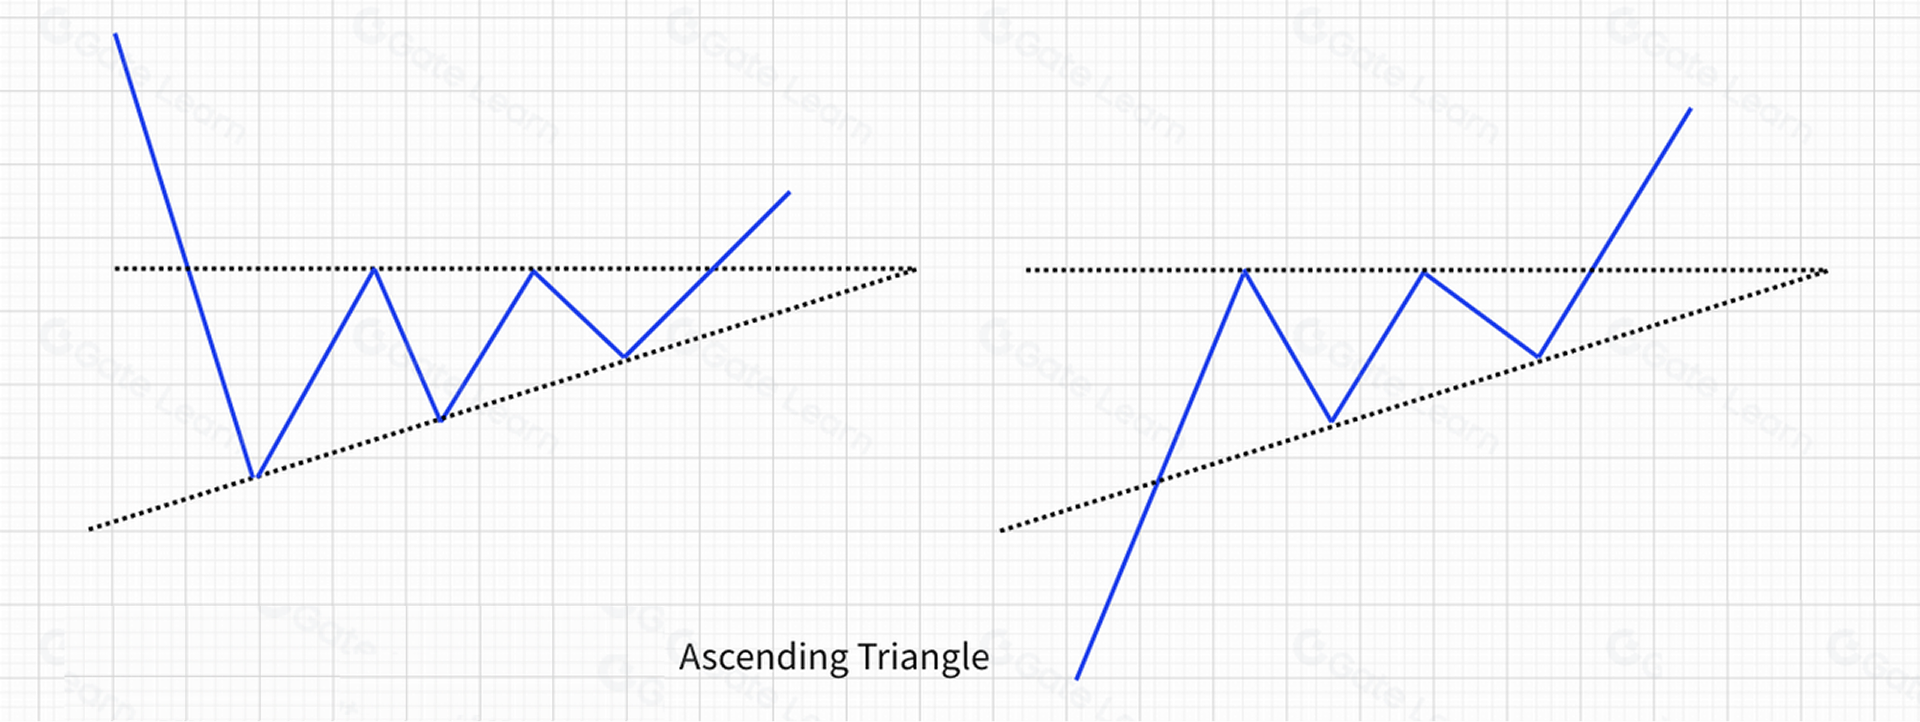
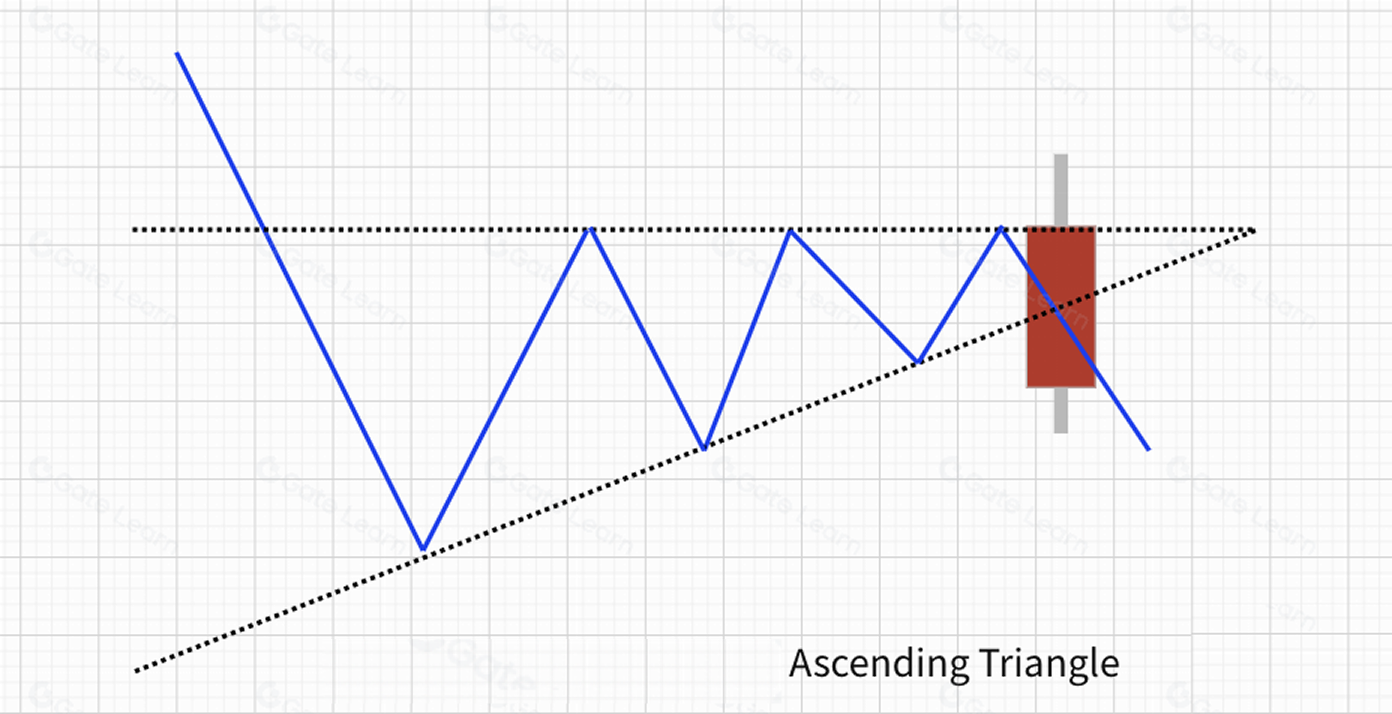
After a period of price increase, the cryptocurrency encounters resistance at a certain level and pulls back. The decline is short-lived, as buying pressure drives the price back up. When the price reaches the previous high, it encounters resistance and falls again. However, the subsequent low does not reach the previous low, as strong buying pressure pushes the price upward once more.
This cycle repeats, forming a right-angled triangle with a horizontal upper trendline and an upward-sloping lower trendline, as illustrated below:
How to Identify an Ascending Triangle
- Generally appears during an uptrend; occasionally occurs in a downtrend.
- Each successive high is roughly at the same horizontal level, while the lows gradually rise. Connecting the highs and lows forms a right-angled triangle with a horizontal upper line.
- Trading volume gradually contracts toward the apex of the triangle.
Technical Implications of an Ascending Triangle
Since prices often break upward after forming this pattern, the ascending triangle signals a continuation of the uptrend.
The rising lows within the triangle indicate strong buying pressure, increasing the likelihood of an upward breakout. When the price breaks above the horizontal upper trendline, it aligns with Dow Theory’s definition of an uptrend: each successive low is higher than the previous low, and each successive high is higher than the previous high. Therefore, the ascending triangle generally indicates a bullish outlook.
Applications of the Ascending Triangle
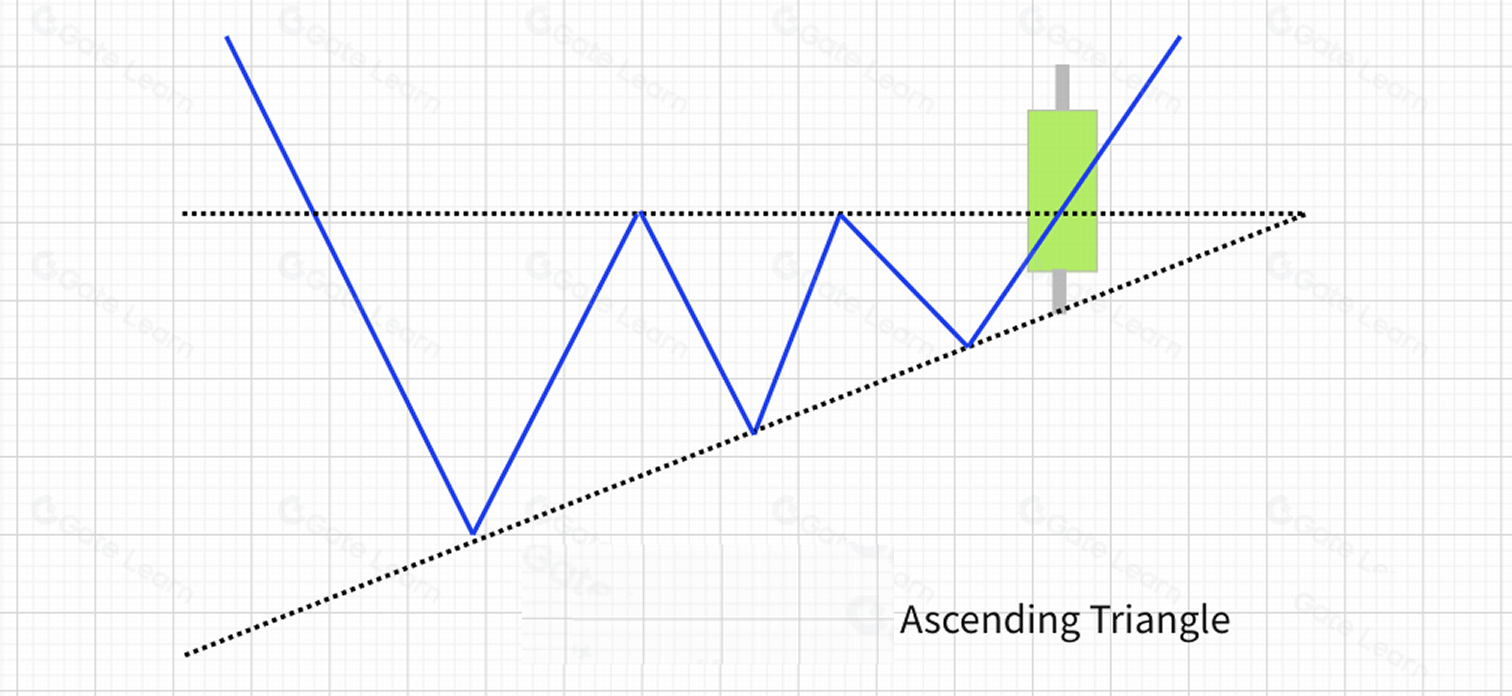
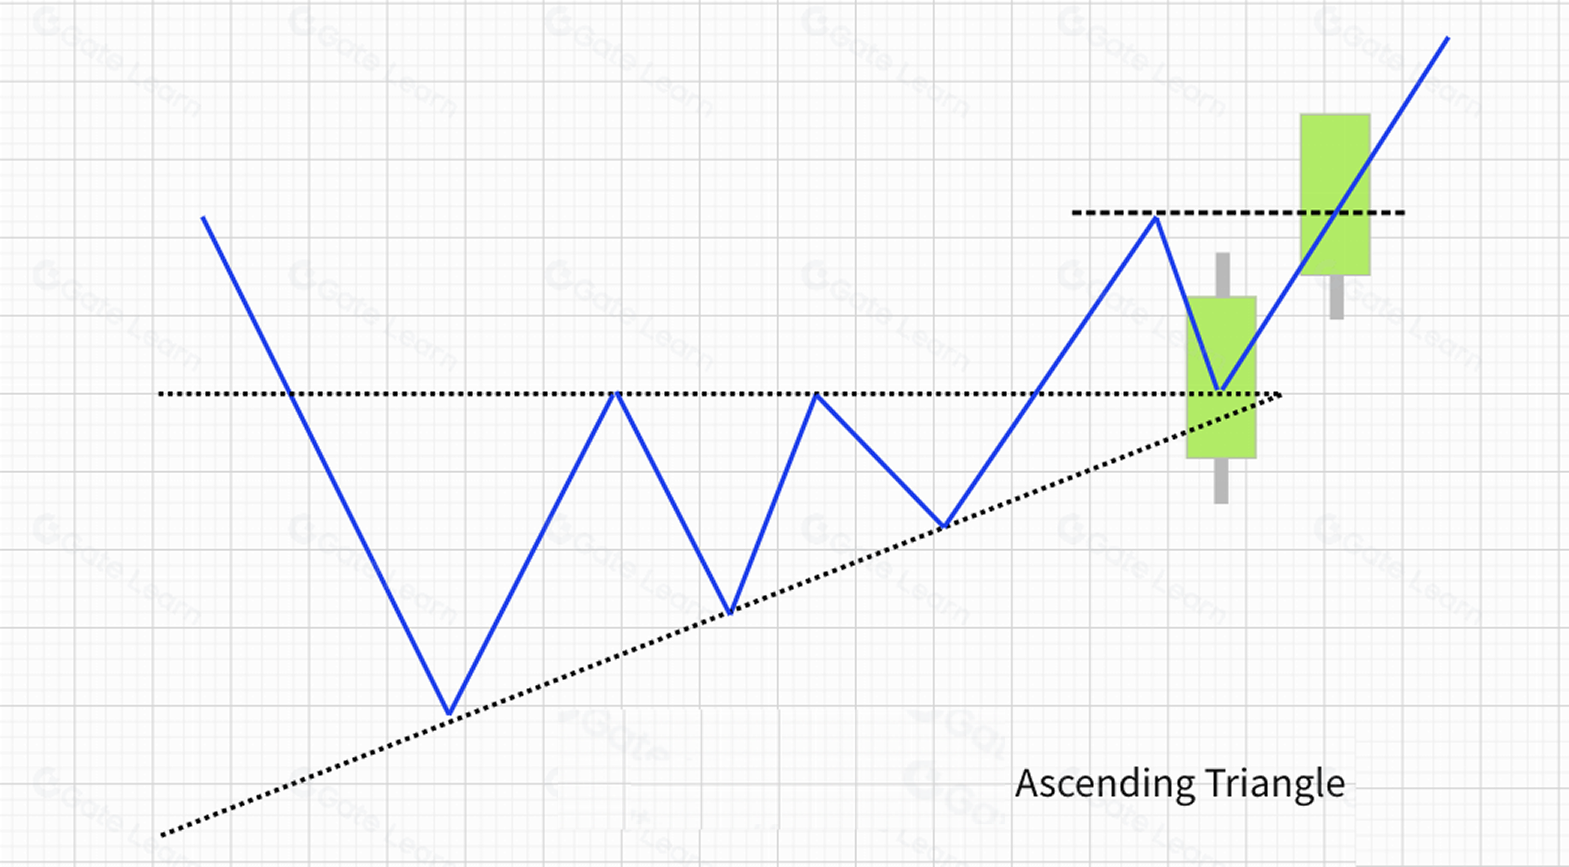
Based on the above, the ascending triangle is a bullish signal. Practical entry and exit signals include:
Buy Signal 1: When the price breaks above the triangle’s upper trendline and closes as a full-bodied bullish candlestick.
Buy Signal 2: After breaking above the upper trendline, if the price pulls back and successfully retests the previous high, this serves as a second entry opportunity.
Sell Signal: If the price falls below the triangle’s lower trendline, it signals an exit.
Real-Market Example
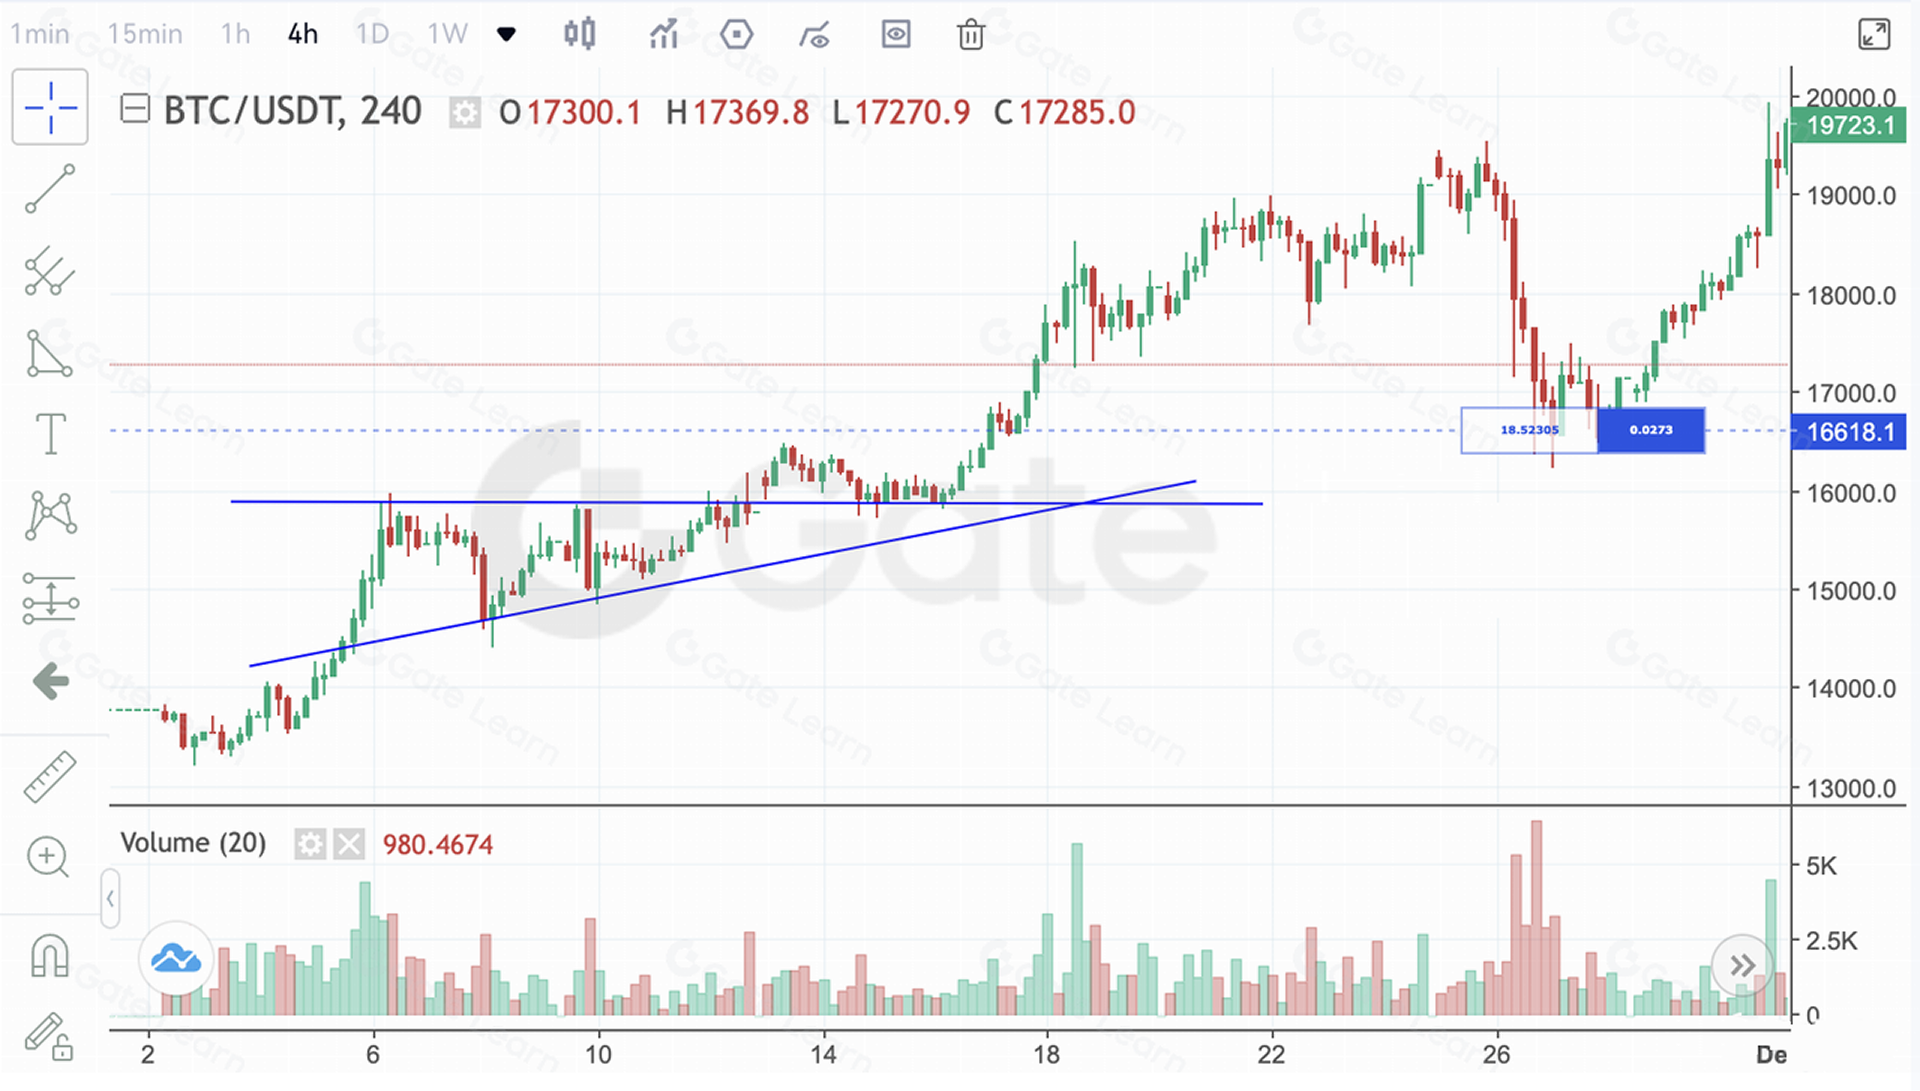
The figure above shows the BTCUSDT 4-hour chart on Gate futures. Between November 5 and November 12, 2020, BTC rose from approximately $13,500 to $15,800, then entered a consolidation phase forming an ascending triangle. When the price broke above the triangle’s upper trendline at $16,000, it triggered a strong upward rally.
Summary
Triangle consolidation patterns are widely used and frequently observed in actual trading, consistent with Dow Theory’s view on trend movements. In addition to standard formations, irregular variations appear even more often in practice and should be applied flexibly in real-market scenarios.
For more futures trading content, visit Gate futures and sign up to start your trading journey.
Disclaimer
This article is for reference only. Information provided by Gate does not constitute investment advice and Gate is not responsible for your investment decisions. Technical analysis, market judgment, trading strategies, and trader insights may involve potential risks, investment variability, and uncertainties. Nothing in this article guarantees returns or implies risk-free opportunities.
Lesson 1:What Is Technical Analysis in the Crypto Market?
Lesson 2:Common Bullish Candlestick Patterns
Lesson 3:Common Bearish Candlestick Patterns
Lesson 4:Bottom Reversal Pattern—Head and Shoulders Bottom
Lesson 5:How to Use the Top Reversal Pattern—Head and Shoulders Top
Lesson 6:How to Use the Bottom Reversal Pattern—Rounding Bottom
Lesson 7:How to Use the Top Reversal Pattern—Rounding Top
Lesson 8:How to Use the Bottom Reversal Pattern—Double Bottom (W-Shape)
Lesson 9:How to Use the Top Reversal Pattern—Double Top (M-Shape)
Lesson 10:How to Use the Bottom Reversal Pattern—V-Shaped Reversal
Lesson 11:How to Use the Consolidation Pattern—Ascending Triangle
Lesson 12:How to Use the Continuation Pattern—Descending Triangle
Lesson 13:How to Use the Continuation Pattern—Other Triangle Patterns
Lesson 14:How to Use the Continuation Pattern—Flag Pattern
Lesson 15:How to Use the Continuation Pattern—Wedge Pattern
Lesson 16:How to Use the Continuation Pattern—Rectangle Pattern
Lesson 17:Mastering Technical Analysis—Methodology Summary
Related Courses

Tools That Help You Trade Better: Moving Averages, Trend Lines, and Indicators

Gate Futures Trading Guide - A must-read for newbies

Futures Grid Trading User Guide
ETF Leveraged Tokens — Product Guide