How to Use the Continuation Pattern—Other Triangle Patterns
Gate Learn's intermediate-level futures series helps users build a structured framework for technical analysis, covering candlestick basics, chart patterns, moving averages and trendlines, as well as the application of technical indicators. In this lesson, we will explain the application of other triangle continuation patterns, including the concept, characteristics, real BTC trading examples, and key considerations.
What Are Other Triangle Patterns
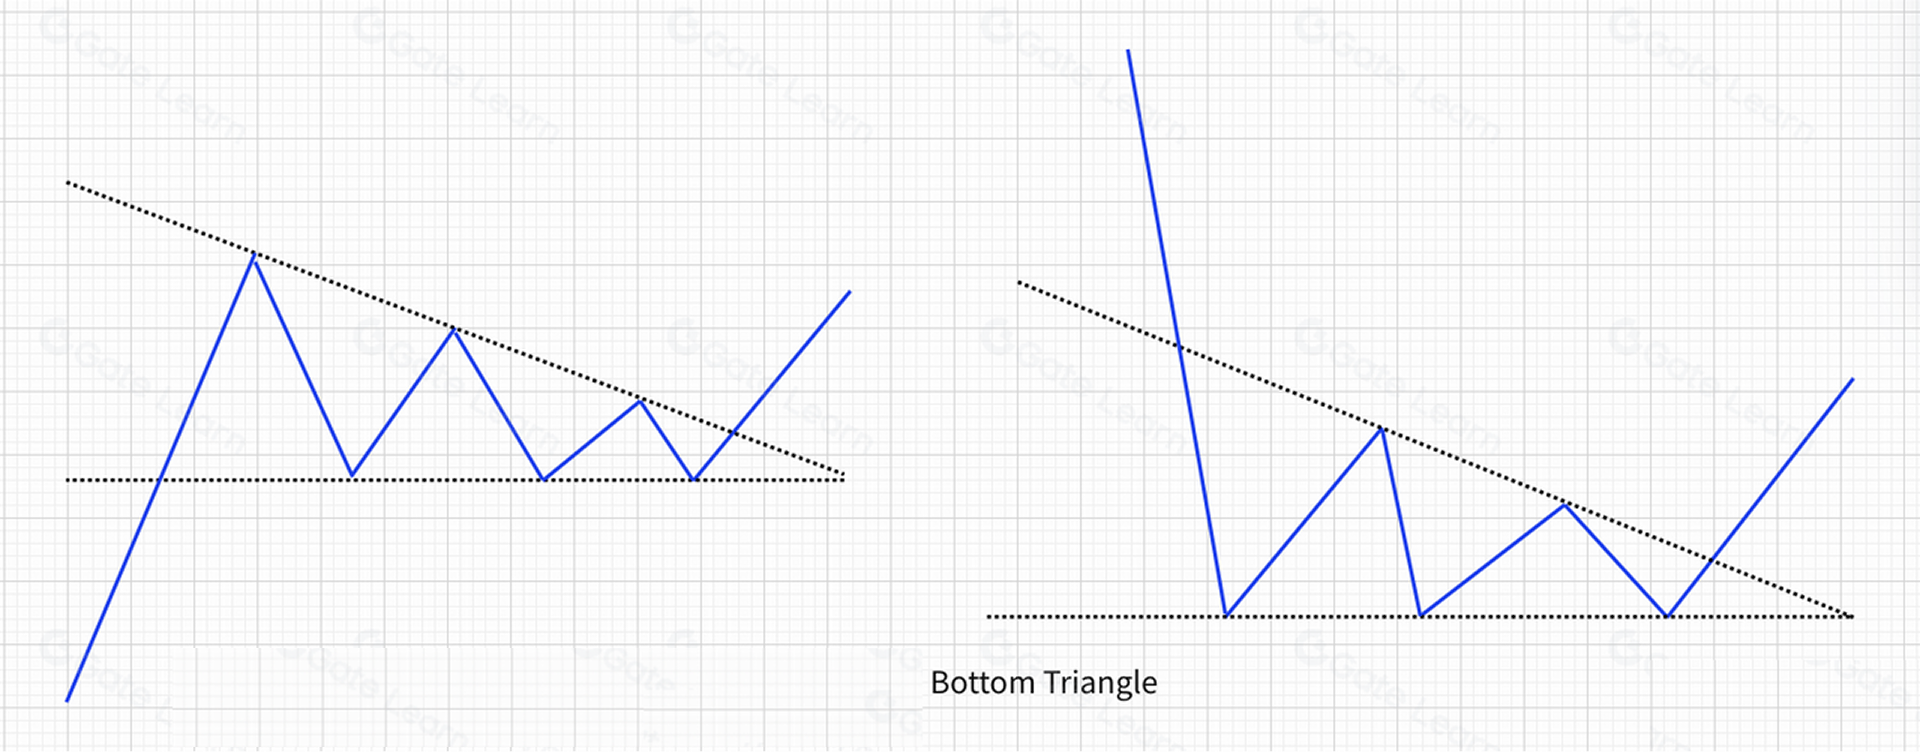
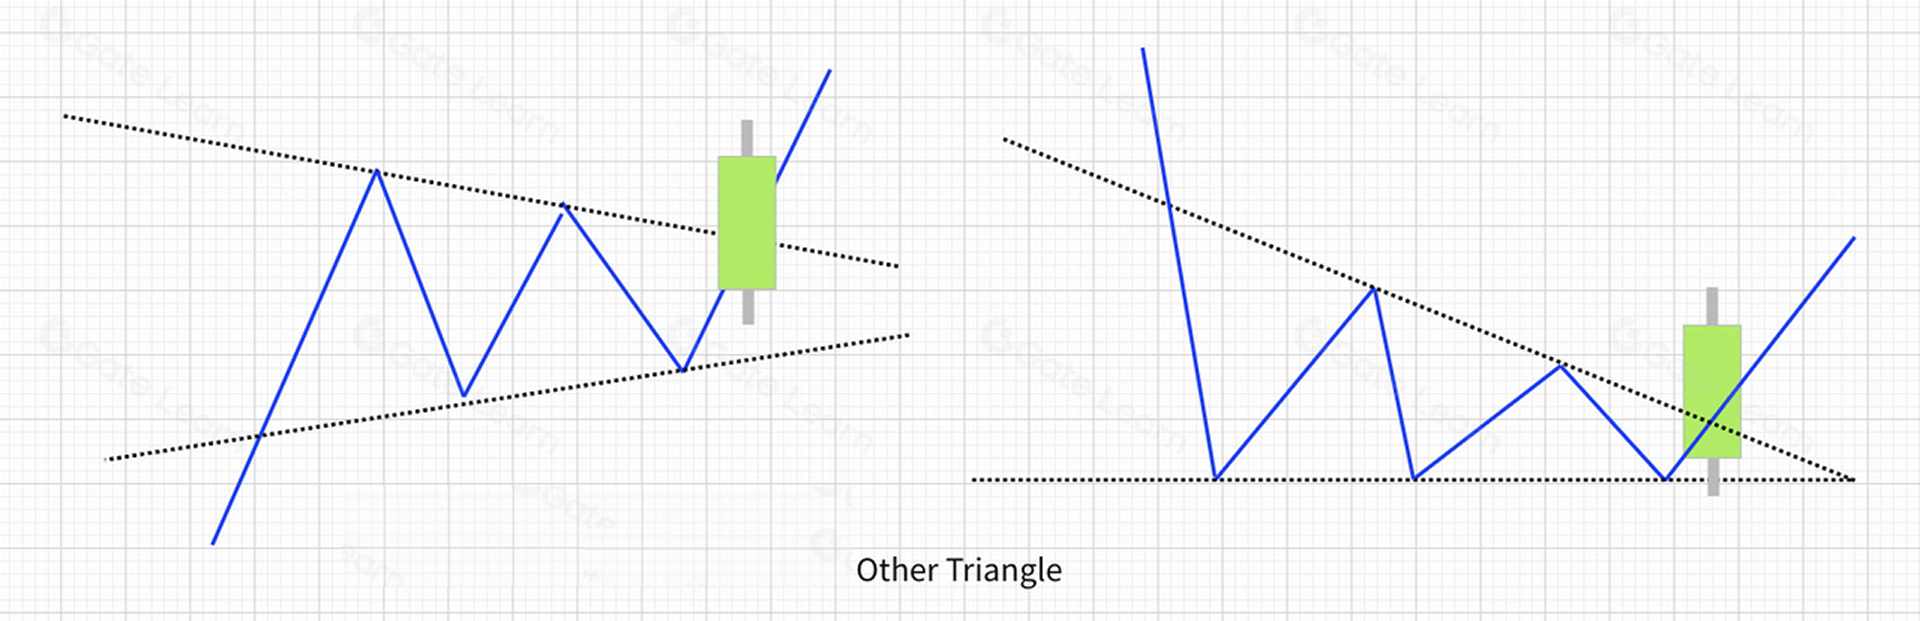
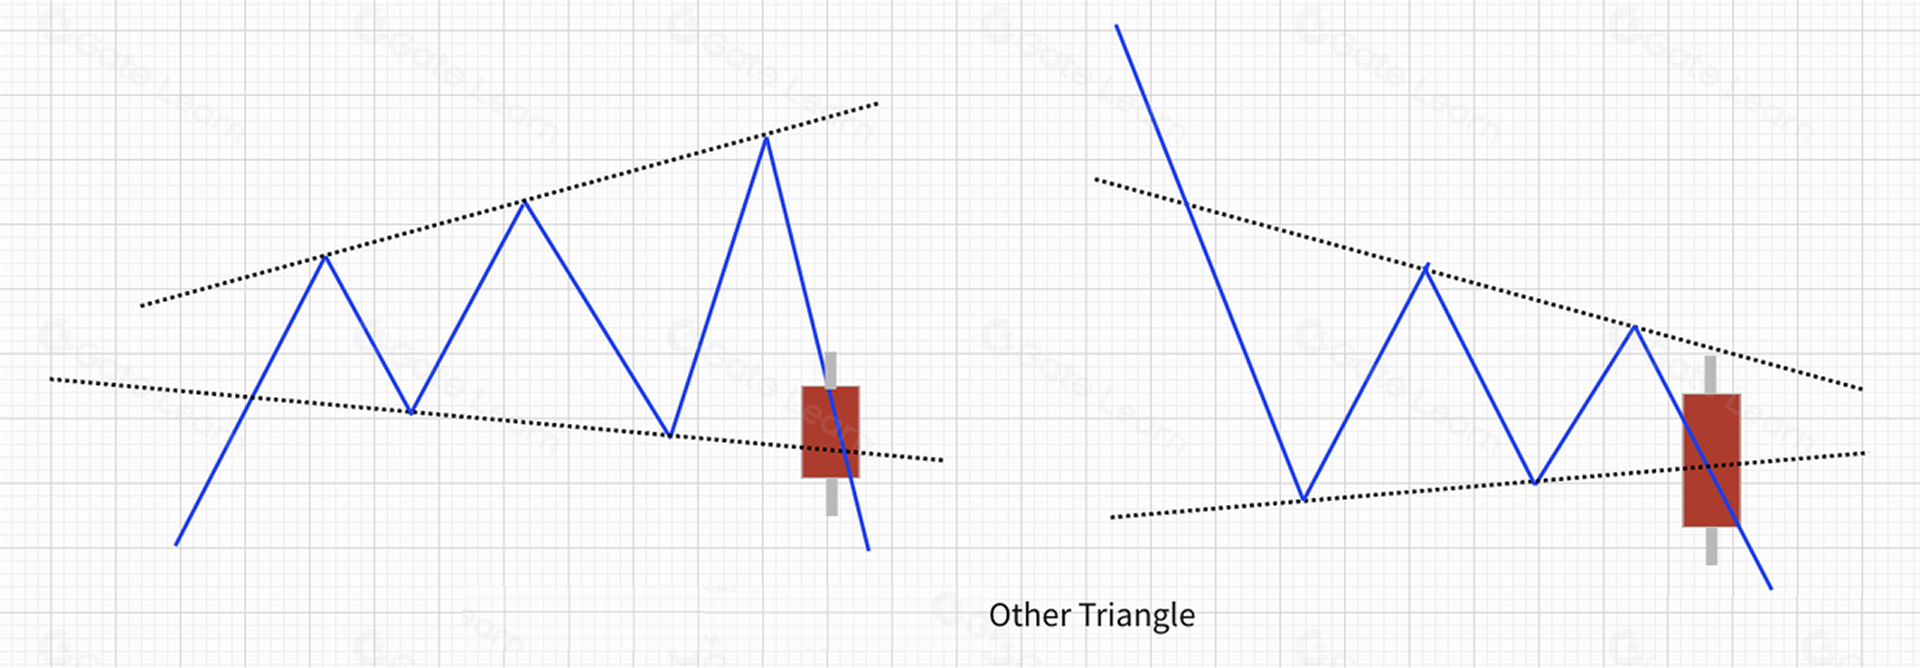
Among continuation patterns, triangle formations are among the most common in the market. Aside from ascending and descending triangles, the remaining structures—including the descending triangle reversal pattern—bottom, broadening triangle (megaphone), and symmetrical triangle—are grouped under “other triangle patterns.” It should be noted that in practice, the the descending triangle reversal pattern—bottom may sometimes overlap with the interpretation of a descending triangle. The distinction between the two should be made based on the analytical purpose and the specific application context. See the illustrations below:
- Descending Triangle Reversal Pattern—Bottom
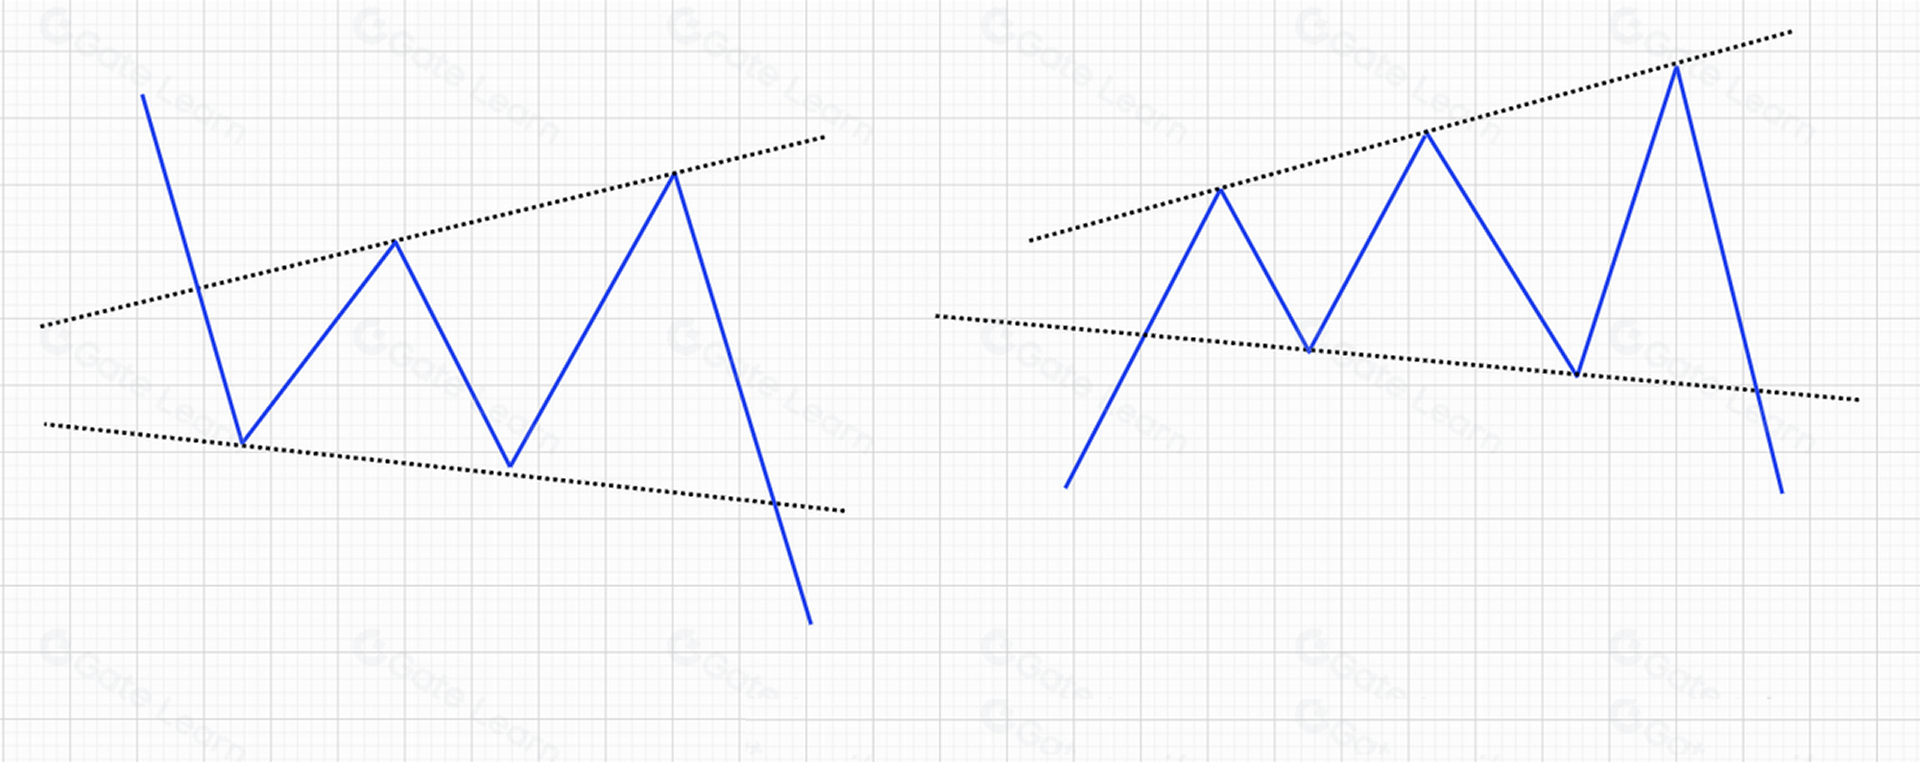
- Broadening Triangle (Megaphone)
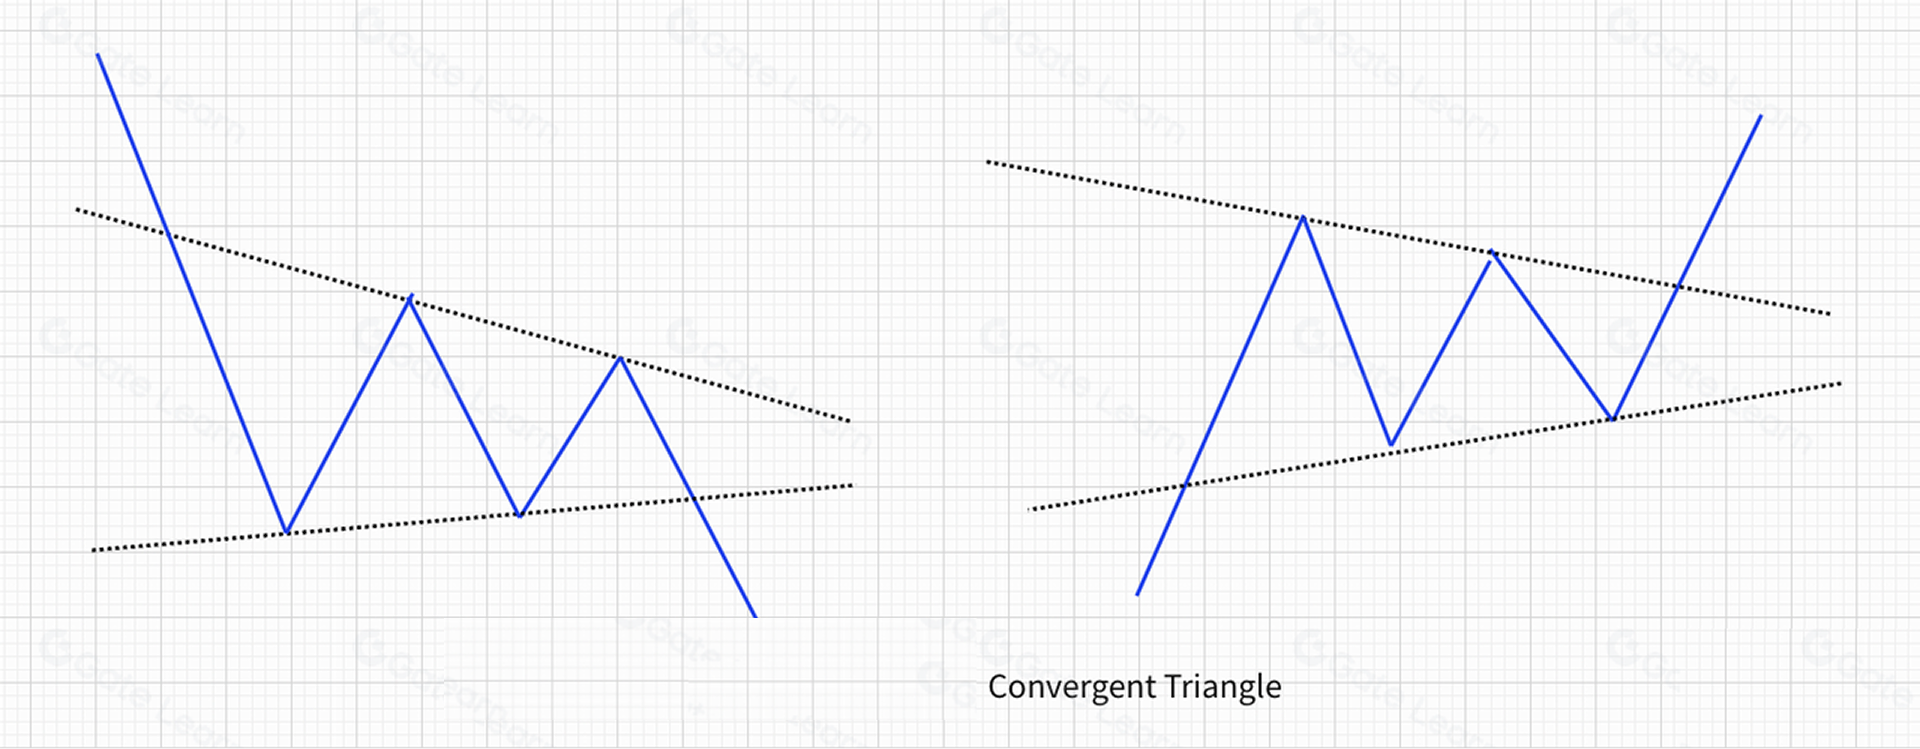
- Symmetrical Triangle
How to Identify Other Triangle Patterns
- Other triangle formations may occur in both uptrends and downtrends.
- When identifying them, trendline drawing techniques should be applied flexibly. These patterns should not be forced onto the chart.
Technical Implications of Other Triangle Patterns
All three patterns reflect a tug-of-war between buyers and sellers, with neither side taking a decisive lead. Before price breaks above or below the triangle boundaries, the market may move in either direction. The key dividing line lies in the triangle’s upper and lower trendlines: A breakout above the upper boundary signals a bullish move, while a breakdown below the lower boundary signals a bearish move.
Applications of Other Triangle Patterns
- Buy Signal: When price breaks above the triangle’s upper boundary and closes with a strong bullish candlestick, the outlook turns bullish—indicating a buy signal.
- Bearish Signal: When price breaks below the triangle’s lower boundary and closes with a strong bearish candlestick, the outlook turns bearish—indicating a sell signal.
Real-Market Examples
- Price Breaks Above the Triangle’s Upper Boundary
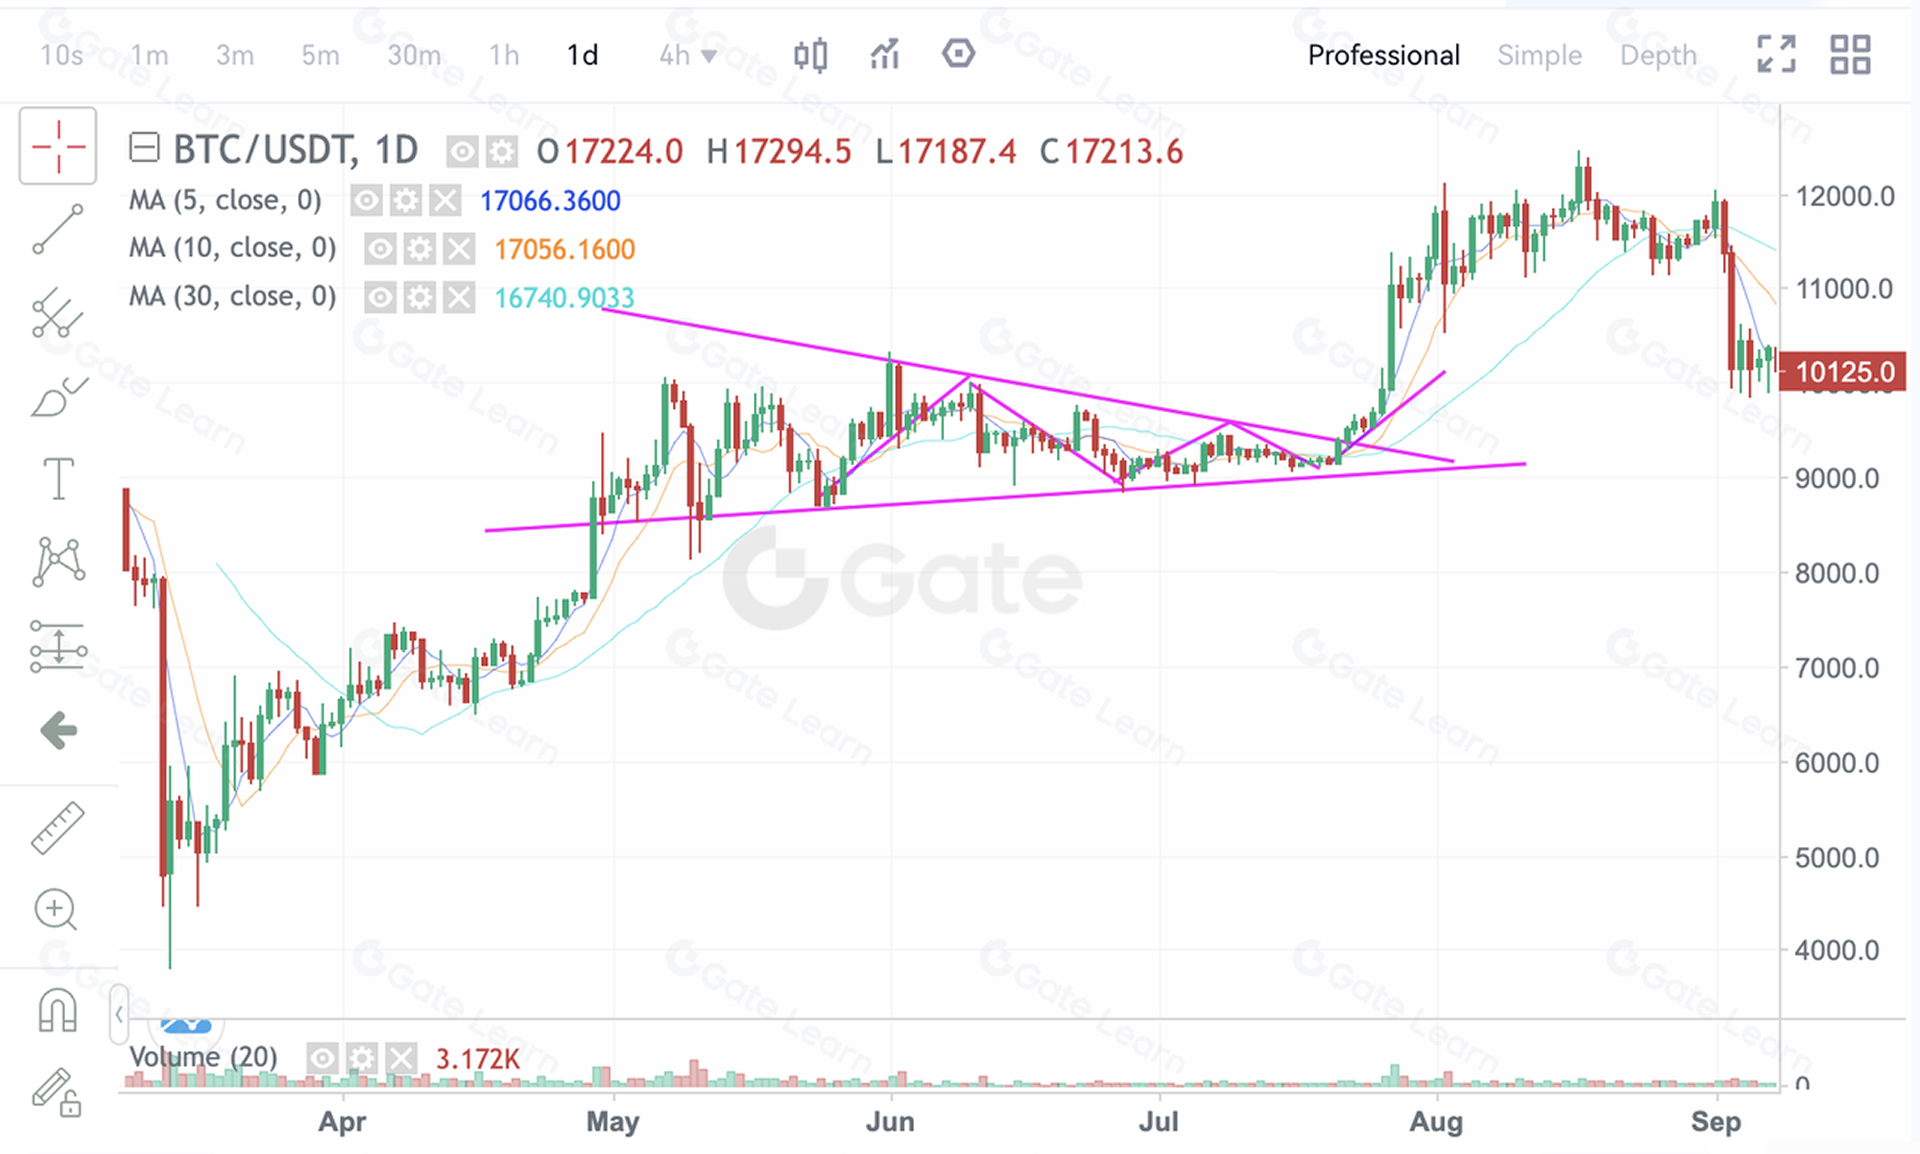
The figure above shows the BTCUSDT daily chart on Gate futures from April 29 to June 27, 2020. After rising from around $5,000 in March 2020, BTC broke above $10,000 on June 11. The market then entered a consolidation phase, gradually contracting into a standard symmetrical triangle. On July 21, BTC broke above $9,500—the upper boundary near the triangle’s apex—and launched a strong upward trend.
- Price Breaks Below the Triangle’s Lower Boundary
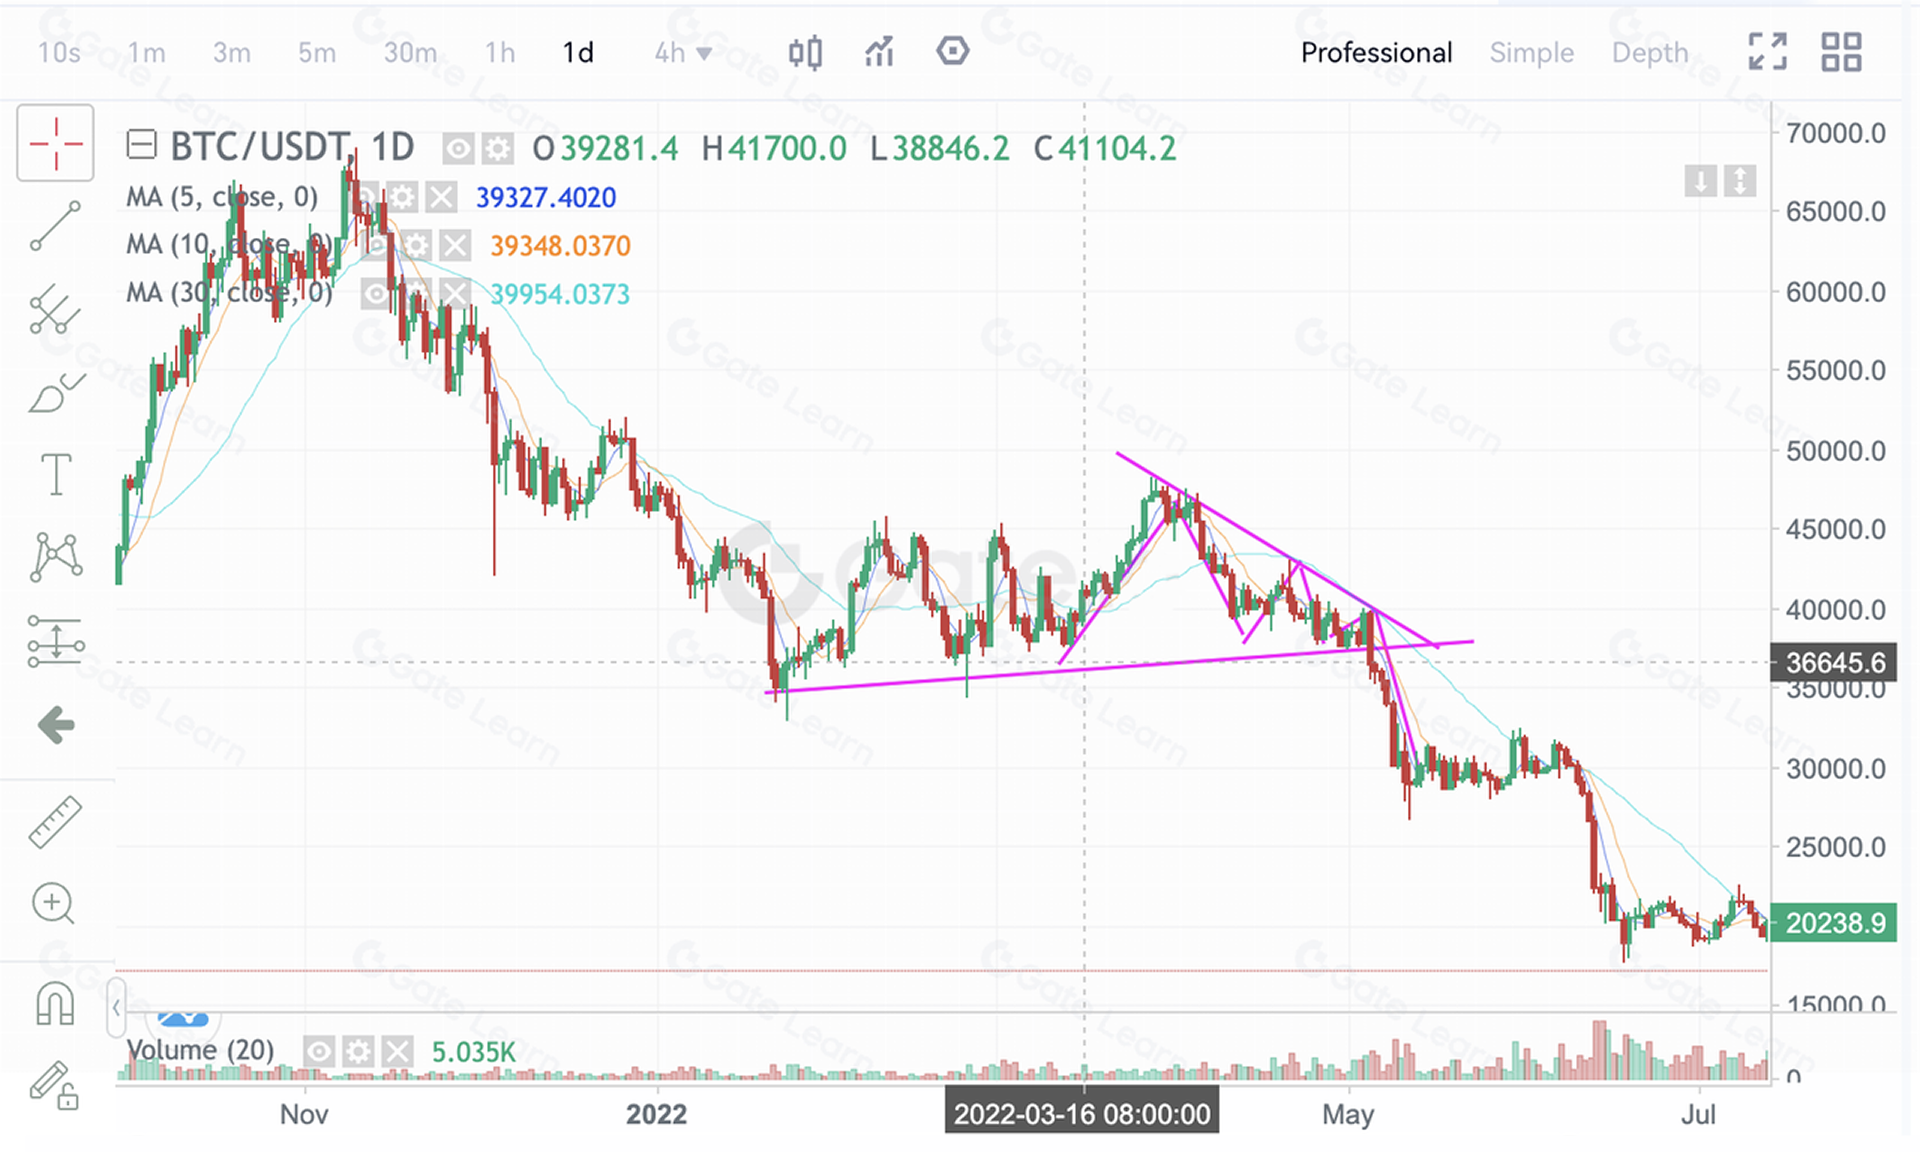
The figure above shows the BTCUSDT daily chart on Gate futures from January 23 to May 1, 2021. After dropping from $66,000 to around $35,000, BTC began to trade sideways between $35,000 and $47,000. As buying and selling pressure gradually balanced, the market formed a symmetrical triangle. When price broke below $37,000—falling through the triangle’s lower boundary—a new downtrend commenced.
Summary
It is important to note that whether it is a descending triangle reversal pattern—bottom, broadening triangle, or symmetrical triangle, the resulting directional bias is only a probability. Traders should not enter positions solely based on the pattern itself unless other trend analysis methods also confirm an entry signal.
Ultimately, whether price rises or falls after a triangle pattern does not depend on the shape or the location of the formation, but on the direction of the eventual breakout.
For more futures trading content, visit Gate futures and sign up to start your trading journey.
Disclaimer
This article is for reference only. Information provided by Gate does not constitute investment advice and Gate is not responsible for your investment decisions. Technical analysis, market judgment, trading strategies, and trader insights may involve potential risks, investment variability, and uncertainties. Nothing in this article guarantees returns or implies risk-free opportunities.
Lesson 1:What Is Technical Analysis in the Crypto Market?
Lesson 2:Common Bullish Candlestick Patterns
Lesson 3:Common Bearish Candlestick Patterns
Lesson 4:Bottom Reversal Pattern—Head and Shoulders Bottom
Lesson 5:How to Use the Top Reversal Pattern—Head and Shoulders Top
Lesson 6:How to Use the Bottom Reversal Pattern—Rounding Bottom
Lesson 7:How to Use the Top Reversal Pattern—Rounding Top
Lesson 8:How to Use the Bottom Reversal Pattern—Double Bottom (W-Shape)
Lesson 9:How to Use the Top Reversal Pattern—Double Top (M-Shape)
Lesson 10:How to Use the Bottom Reversal Pattern—V-Shaped Reversal
Lesson 11:How to Use the Consolidation Pattern—Ascending Triangle
Lesson 12:How to Use the Continuation Pattern—Descending Triangle
Lesson 13:How to Use the Continuation Pattern—Other Triangle Patterns
Lesson 14:How to Use the Continuation Pattern—Flag Pattern
Lesson 15:How to Use the Continuation Pattern—Wedge Pattern
Lesson 16:How to Use the Continuation Pattern—Rectangle Pattern
Lesson 17:Mastering Technical Analysis—Methodology Summary
Related Courses

Tools That Help You Trade Better: Moving Averages, Trend Lines, and Indicators

Gate Futures Trading Guide - A must-read for newbies

Futures Grid Trading User Guide
ETF Leveraged Tokens — Product Guide