2025 CITY Price Prediction: Expert Analysis and Market Forecast for the Coming Year

Introduction: Market Position and Investment Value of CITY
Manchester City Fan Token (CITY) serves as a functional governance and engagement token for Manchester City Football Club fans, enabling them to participate in club decisions through the Socios platform. Since its launch in 2021, CITY has established itself as a unique asset bridging sports entertainment and blockchain technology. As of December 2025, CITY maintains a market capitalization of approximately $12.88 million, with a circulating supply of around 12.42 million tokens, currently trading at $0.6523. This "fan empowerment token," as it is recognized in the sports blockchain ecosystem, is playing an increasingly vital role in tokenized fan engagement and governance mechanisms.
This article will provide a comprehensive analysis of CITY's price trends from 2025 to 2030, incorporating historical patterns, market dynamics, ecosystem development, and macroeconomic factors to deliver professional price forecasts and practical investment guidance for investors seeking exposure to the sports fan token sector.
I. CITY Price History Review and Current Market Status
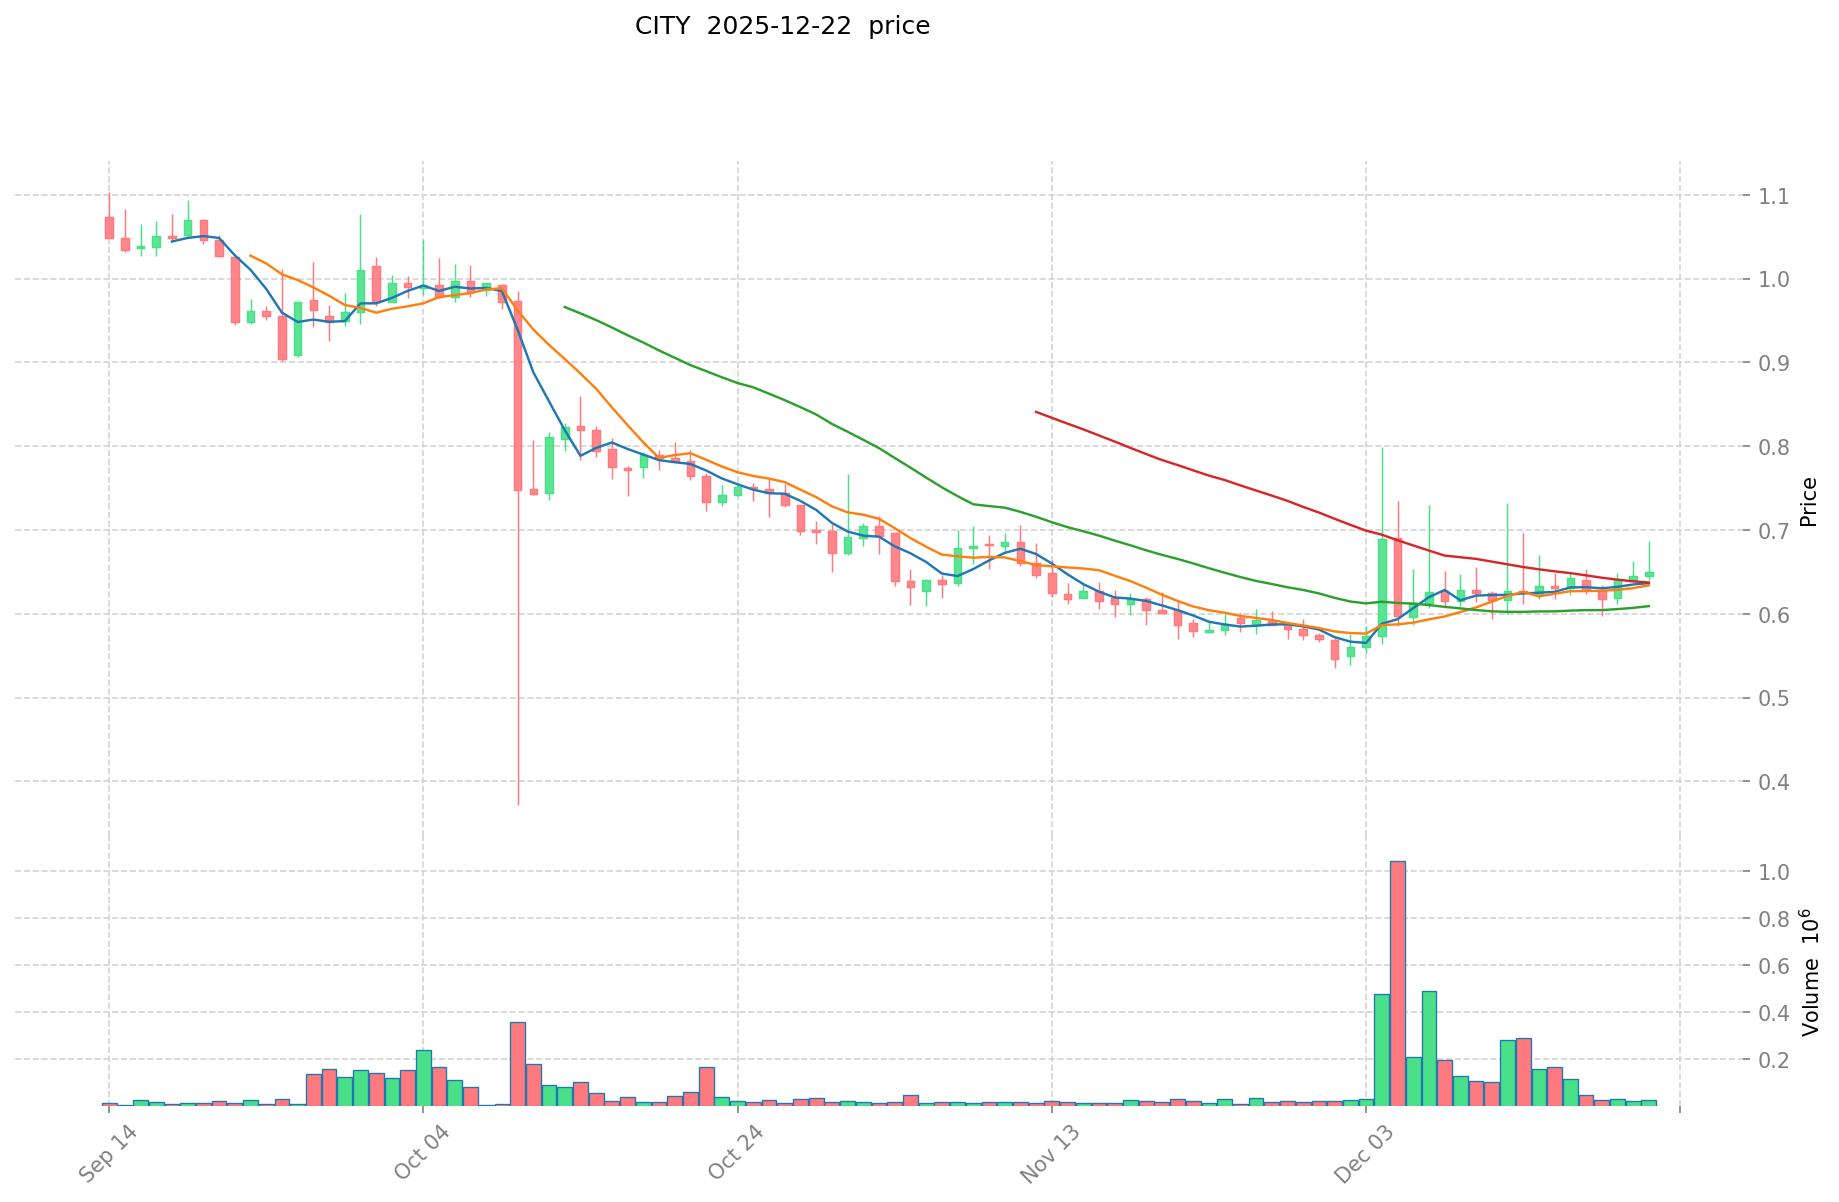
CITY Historical Price Evolution Trajectory
- August 27, 2021: Token listing milestone, reached all-time high of $36.19
- October 11, 2025: Price declined to all-time low of $0.514957
- 2021-2025: Extended bear market cycle, price depreciated from peak of $36.19 to current levels around $0.65
CITY Current Market Situation
As of December 22, 2025, CITY is trading at $0.6523, reflecting a market capitalization of approximately $8.1 million with a fully diluted valuation of $12.88 million. The token shows a 24-hour price decline of 2.24%, while demonstrating modest positive performance over the 30-day period with a 10.94% gain. However, the token's year-to-date performance remains significantly challenged, with a 65.52% decline from its value one year prior.
Current trading volume stands at $19,923.64 in the 24-hour period. The token maintains a circulating supply of 12,421,029 CITY out of a total maximum supply of 19,740,000, representing 62.92% circulation. With 7,316 token holders and a market ranking of 1,289, CITY maintains moderate liquidity across 15 exchange venues. The token's market dominance remains minimal at 0.00039% of the broader cryptocurrency market.
View current CITY market price
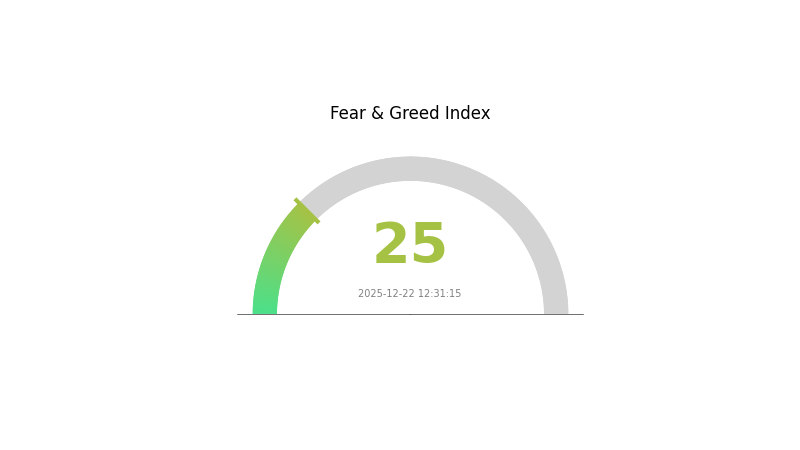
Market Sentiment Indicator
2025-12-22 Fear and Greed Index: 25 (Extreme Fear)
Click to view current Fear & Greed Index
The cryptocurrency market is experiencing extreme fear, with the index plunging to 25. This indicates investors are deeply pessimistic about market prospects, with panic selling and risk aversion dominating sentiment. Such extreme fear conditions often present opportunities for contrarian investors, as markets have typically reached oversold levels. However, caution remains essential—confirm market stabilization before entering positions. Monitor major support levels and regulatory developments closely. Gate.com provides real-time market sentiment analysis to help you navigate these volatile conditions effectively.
CITY Holdings Distribution
The address holdings distribution chart illustrates the concentration of token ownership across blockchain addresses, providing critical insights into the decentralization level and market structure of CITY. By analyzing the distribution of top holders relative to total circulating supply, researchers can assess the degree of wealth concentration and potential systemic risks associated with large token holders.
CITY exhibits pronounced concentration characteristics in its current holder structure. The top two addresses collectively control approximately 69.11% of the total supply, with the largest holder commanding 37.08% and the second-largest holder accounting for 32.03%. This significant concentration within a limited number of addresses raises concerns regarding centralization risk. The third through fifth largest holders contribute an additional 15.66%, leaving only 15.23% distributed among remaining addresses. Such a distribution pattern suggests that decision-making power and price influence are concentrated among a small number of entities, potentially creating vulnerabilities in terms of market stability and governance decentralization.
The heavily skewed holder distribution carries substantial implications for market dynamics and price stability. Large holders retain considerable capacity to influence market sentiment through significant token movements, potentially triggering cascading sell-offs or price volatility. The concentration at the top tier may indicate institutional accumulation, strategic reserves, or early investor positions that could be mobilized during key market transitions. The relatively thin distribution in the lower tiers suggests limited organic token adoption across retail participants, which may constrain genuine network participation and community-driven growth. This structural imbalance represents a material consideration for evaluating CITY's long-term decentralization trajectory and resilience against concentrated selling pressure.
Click to view current CITY holdings distribution

| Top | Address | Holding Qty | Holding (%) |
|---|---|---|---|
| 1 | 0x6F45...41a33D | 7318.97K | 37.08% |
| 2 | 0xF977...41aceC | 6322.02K | 32.03% |
| 3 | 0xc368...816880 | 1183.07K | 5.99% |
| 4 | 0xc80A...e92416 | 1131.08K | 5.73% |
| 5 | 0x76eC...78Fbd3 | 777.02K | 3.94% |
| - | Others | 3007.84K | 15.23% |
II. Core Factors Influencing CITY's Future Price
Supply Mechanism
-
Circulating Supply: CITY has a circulating supply of 11,539,106 tokens, representing 58.46% of the total supply of 19,740,000 tokens. The fully diluted market capitalization stands at $19,416,264.00.
-
Current Impact: The token's limited supply relative to total circulation creates scarcity dynamics that may support long-term value retention. However, with over 58% of tokens already in circulation, significant supply expansion remains possible through token unlock schedules.
Institutional and Major Holder Dynamics
-
Holder Concentration: The top two addresses control 74.59% of CITY tokens, with the largest holder (0x6F45...41a33D) commanding 41.54% and the second-largest (0xF977...41aceC) holding 33.05%. This concentration presents potential volatility risks from large-scale token movements.
-
Community Distribution: The remaining 25.41% is distributed across other addresses, with the top four holders comprising 88.2% of total supply, indicating a highly concentrated ownership structure.
Macroeconomic Environment
-
Inflation Hedge Attributes: As a speculative asset, CITY exhibits characteristics typical of cryptocurrency tokens during periods of monetary expansion, though its value is primarily driven by community sentiment and utility adoption rather than macroeconomic fundamentals.
-
Market Sentiment: Current market conditions show CITY operating in a speculative environment where investor psychology and adoption patterns significantly influence price movements more than traditional economic indicators.
This article is provided for informational purposes only and does not constitute investment advice from Gate.com or any other entity. Cryptocurrency investments carry substantial risk. Please conduct thorough research and consult with financial professionals before making investment decisions.
III. 2025-2030 CITY Price Forecast
2025 Outlook
- Conservative Forecast: $0.46-$0.65
- Neutral Forecast: $0.65-$0.80
- Optimistic Forecast: $0.80-$0.96 (requires sustained market momentum and positive ecosystem developments)
2026-2028 Medium-term Outlook
- Market Stage Expectation: Gradual recovery phase with consolidation patterns, characterized by incremental growth and market maturation.
- Price Range Predictions:
- 2026: $0.51-$1.15
- 2027: $0.90-$1.19
- 2028: $0.63-$1.46
- Key Catalysts: Ecosystem expansion, increased institutional adoption, protocol upgrades, and growing DeFi integration on platforms like Gate.com.
2029-2030 Long-term Outlook
- Base Case Scenario: $1.12-$1.34 (assuming steady adoption and market stability)
- Optimistic Scenario: $1.50-$1.76 (contingent on breakthrough partnerships and significant use-case expansion)
- Transformative Scenario: $1.76+ (under conditions of mass mainstream adoption and major technological advancement)
- 2030-12-22: CITY achieves approximately 100% cumulative gain potential (representing mature market positioning)
| 年份 | 预测最高价 | 预测平均价格 | 预测最低价 | 涨跌幅 |
|---|---|---|---|---|
| 2025 | 0.95756 | 0.6514 | 0.46249 | 0 |
| 2026 | 1.1504 | 0.80448 | 0.50682 | 23 |
| 2027 | 1.19248 | 0.97744 | 0.89925 | 49 |
| 2028 | 1.4647 | 1.08496 | 0.62928 | 66 |
| 2029 | 1.33857 | 1.27483 | 1.12185 | 95 |
| 2030 | 1.76404 | 1.3067 | 1.1499 | 100 |
Manchester City Fan Token (CITY) Professional Analysis Report
IV. CITY Investment Strategy and Risk Management
CITY Investment Methodology
(1) Long-term Holding Strategy
- Target Audience: Sports fan communities, Socios platform participants, and long-term blockchain enthusiasts interested in fan tokenomics
- Operational Recommendations:
- Establish a baseline position during market consolidation phases and accumulate during significant drawdowns
- Participate actively in governance votes through CITY token holdings to maximize utility value
- Reinvest earned rewards from Socios activities to compound your position over time
(2) Active Trading Strategy
- Market Context: CITY has experienced significant volatility, declining 65.52% over the past year while gaining 10.94% in the last 30 days
- Trading Observations:
- Current 24-hour price movement: -2.24% at $0.6523
- Support level: Historical low of $0.514957 (October 2025)
- Resistance level: Recent 30-day performance shows upward momentum of 10.94%
CITY Risk Management Framework
(1) Asset Allocation Principles
- Conservative Investors: 1-2% allocation maximum
- Active Investors: 2-5% allocation
- Specialist Investors: 5-10% allocation with dedicated monitoring
(2) Risk Hedging Considerations
- Diversification Strategy: Balance CITY holdings with other blockchain assets to reduce concentration risk from a single sports utility token
- Position Sizing: Never allocate more than your predetermined portfolio percentage, given the 89.43% market cap to fully diluted valuation gap
(3) Secure Storage Solutions
- Hardware Wallet Approach: Store substantial CITY holdings in hardware solutions for maximum security against exchange risks
- Exchange Custody: For active trading purposes, maintain working balances on Gate.com, which supports CITY trading with 15 exchange listings available
- Security Best Practices: Enable two-factor authentication, use strong passwords, never share private keys, and regularly audit wallet holdings
V. CITY Potential Risks and Challenges
CITY Market Risks
- Extreme Price Volatility: CITY has declined from an all-time high of $36.19 (August 2021) to $0.6523, representing a 98.2% decline over approximately four years
- Limited Liquidity: 24-hour trading volume of only $19,923.64 creates potential slippage during large trades and difficulty entering/exiting positions
- Fan Token Sector Risk: The broader sports tokenization sector remains experimental, with limited proven utility beyond governance voting
CITY Regulatory Risks
- Sports Intellectual Property Concerns: Regulatory clarity around fan tokens and their relationship to club intellectual property remains uncertain across different jurisdictions
- Securities Classification Risk: Different regulatory frameworks may eventually classify fan tokens as securities, subjecting them to stricter requirements
- Geographic Restrictions: Access to Socios platform and CITY trading may become restricted in certain jurisdictions pending regulatory developments
CITY Technical Risks
- Chiliz Chain Dependency: CITY operates on Chiliz Chain, a proof-of-authority sidechain, creating concentration risk around this infrastructure
- Smart Contract Risk: The governance voting mechanism and NFT reward distribution rely on smart contracts that could contain unforeseen vulnerabilities
- Adoption Risk: The utility value of CITY depends entirely on Manchester City's commitment to the Socios platform and fan engagement initiatives
VI. Conclusion and Action Recommendations
CITY Investment Value Assessment
Manchester City Fan Token (CITY) represents a specialized investment opportunity within the sports tokenization sector. As a functional token, CITY provides holders with governance rights and platform rewards through Socios, offering genuine utility beyond pure speculation. However, investors should recognize that CITY has experienced severe long-term depreciation (down 65.52% year-over-year) with extremely limited trading liquidity ($19,923.64 daily volume). The token's value proposition depends heavily on sustained engagement from Manchester City's fanbase and the long-term viability of the Socios platform.
CITY Investment Recommendations
✅ Beginners: Start with minimal positions (0.5-1% of investment capital) to understand the mechanics of fan token governance and Socios platform functionality before committing larger amounts.
✅ Experienced Investors: Consider CITY as a thematic play on sports blockchain integration, potentially combining it with other sports utility tokens for sector diversification.
✅ Institutional Investors: Evaluate CITY within the context of broader entertainment tokenomics trends, noting the significant valuation gap between market cap and fully diluted valuation (62.92%).
CITY Trading Participation Methods
- Direct Exchange Trading: Access CITY through Gate.com, which lists the token for direct trading against major cryptocurrency pairs
- Socios Platform Participation: Engage with CITY through the official Socios application to participate in governance votes and earn platform rewards
- NFT Reward Opportunities: Utilize staking opportunities when available to earn non-fungible token rewards, creating additional utility beyond trading
Cryptocurrency investments carry extreme risk. This report does not constitute investment advice. Investors should make decisions based on their individual risk tolerance and financial circumstances. It is strongly recommended to consult with professional financial advisors before making investment decisions. Never invest more than you can afford to lose completely.
FAQ
Can Coti reach $10?
Yes, COTI can potentially reach $10, though this would likely occur in the distant future beyond 2030. While possible with sustained growth and market development, near-term achievement of this price target remains unlikely based on current market conditions and projections.
Does Coti Coin have a future?
Yes, Coti Coin has strong future potential. Market analysis projects it reaching $0.2737, with promising long-term growth driven by increasing adoption and positive market trends in the blockchain ecosystem.
What factors influence COTI coin price movement?
COTI coin price is influenced by market sentiment, technical developments, user adoption rates, and macroeconomic events. Trading volume and network activity also impact price dynamics significantly.
What is COTI coin used for and what is its market potential?
COTI enables confidential transactions across DeFi applications, enhancing privacy and security. With growing DeFi adoption and enterprise demand for private transactions, COTI has significant market potential for expansion in the blockchain ecosystem.
How does COTI compare to other cryptocurrency projects in its sector?
COTI distinguishes itself through advanced privacy technology and efficient DeFi solutions. It excels at handling cross-chain privacy and supports confidential smart contracts, offering superior transaction speed and lower costs compared to competitors in the privacy-focused blockchain sector.
Share
Content
Introduction: Market Position and Investment Value of CITY
I. CITY Price History Review and Current Market Status
II. Core Factors Influencing CITY's Future Price
III. 2025-2030 CITY Price Forecast
IV. CITY Investment Strategy and Risk Management
V. CITY Potential Risks and Challenges
VI. Conclusion and Action Recommendations
FAQ
How to Buy Cryptocurrency


Trending Cryptocurrencies


Is WazirX (WRX) a good investment?: Analyzing the potential returns and risks of India's leading cryptocurrency exchange token

Is UNUS-SED-LEO (LEO) a good investment?: Analyzing the potential and risks of this cryptocurrency token
2025 LEO Price Prediction: Analyzing Market Trends and Potential Growth Factors

Gate leads the CEX rankings in capital inflow for 2025.

Analysis of GT coin price and investment prospects in 2025

2025 OKB Price Prediction: Analyzing Market Trends and Future Potential of OKB Token in the Crypto Ecosystem
Satoshi Mining
Understanding Bitcoin Dominance (BTC.D): An In-Depth Analysis of the Metric and Its Influence on the Cryptocurrency Market
Crypto Heatmap

What is GCOIN: A Comprehensive Guide to Understanding the Next Generation of Digital Currency
What is ZAP: A Comprehensive Guide to Zero-Day Attack Prevention Tools and Security Testing Methodologies