Trade
Basic
Futures
Futures
Hundreds of contracts settled in USDT or BTC
TradFi
Gold
Trade global traditional assets with USDT in one place
Options
Hot
Trade European-style vanilla options
Unified Account
Maximize your capital efficiency
Demo Trading
Futures Kickoff
Get prepared for your futures trading
Futures Events
Participate in events to win generous rewards
Demo Trading
Use virtual funds to experience risk-free trading
Earn
Launch
CandyDrop
Collect candies to earn airdrops
Launchpool
Quick staking, earn potential new tokens
HODLer Airdrop
Hold GT and get massive airdrops for free
Launchpad
Be early to the next big token project
Alpha Points
Trade on-chain assets and enjoy airdrop rewards!
Futures Points
Earn futures points and claim airdrop rewards
Investment
Simple Earn
Earn interests with idle tokens
Auto-Invest
Auto-invest on a regular basis
Dual Investment
Buy low and sell high to take profits from price fluctuations
Soft Staking
Earn rewards with flexible staking
Crypto Loan
0 Fees
Pledge one crypto to borrow another
Lending Center
One-stop lending hub
VIP Wealth Hub
Customized wealth management empowers your assets growth
Private Wealth Management
Customized asset management to grow your digital assets
Quant Fund
Top asset management team helps you profit without hassle
Staking
Stake cryptos to earn in PoS products
Smart Leverage
New
No forced liquidation before maturity, worry-free leveraged gains
GUSD Minting
Use USDT/USDC to mint GUSD for treasury-level yields
More
CyrilDeFi
BREAKING: X just announced a new feature that lets you disclose paid ads and AI slop videos

- Reward
- 2
- Comment
- Repost
- Share
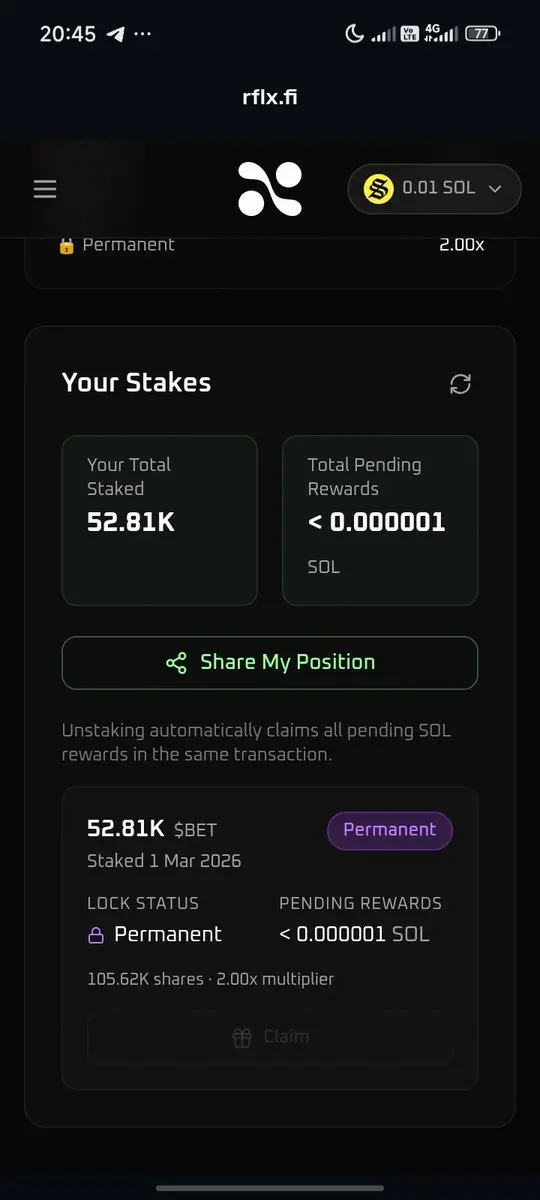
Just permanently locked my $Bet
Lfg i believe in this....
Lfg i believe in this....
- Reward
- 1
- Comment
- Repost
- Share
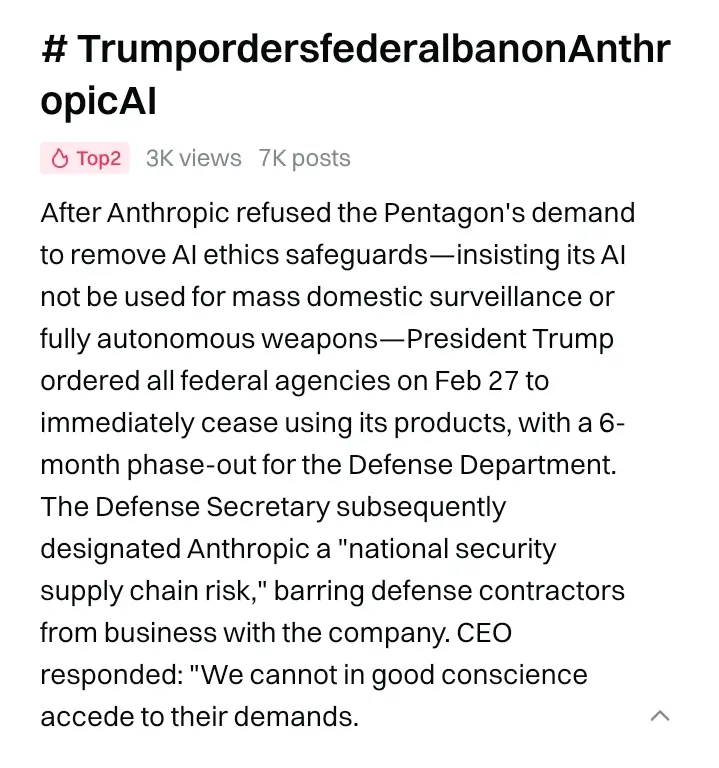
#TrumpordersfederalbanonAnthropicAI Trump’s Federal Ban on Anthropic AI: Safety Measure or Strategic Misstep?
In a move that is sending shockwaves across the AI and technology sectors, the federal government has officially announced a ban on Anthropic AI, citing concerns over national safety, the potential misuse of AI systems, and the risks associated with unregulated development. While the decision is being framed as a protective measure, industry experts and analysts warn that this ban could have far-reaching consequences for innovation, competitiveness, and global leadership in AI technolo
In a move that is sending shockwaves across the AI and technology sectors, the federal government has officially announced a ban on Anthropic AI, citing concerns over national safety, the potential misuse of AI systems, and the risks associated with unregulated development. While the decision is being framed as a protective measure, industry experts and analysts warn that this ban could have far-reaching consequences for innovation, competitiveness, and global leadership in AI technolo

- Reward
- like
- Comment
- Repost
- Share
DDR
内存条
Created By@AJourneyThroughMountainsAnd
Listing Progress
0.00%
MC:
$2.38K
More Tokens
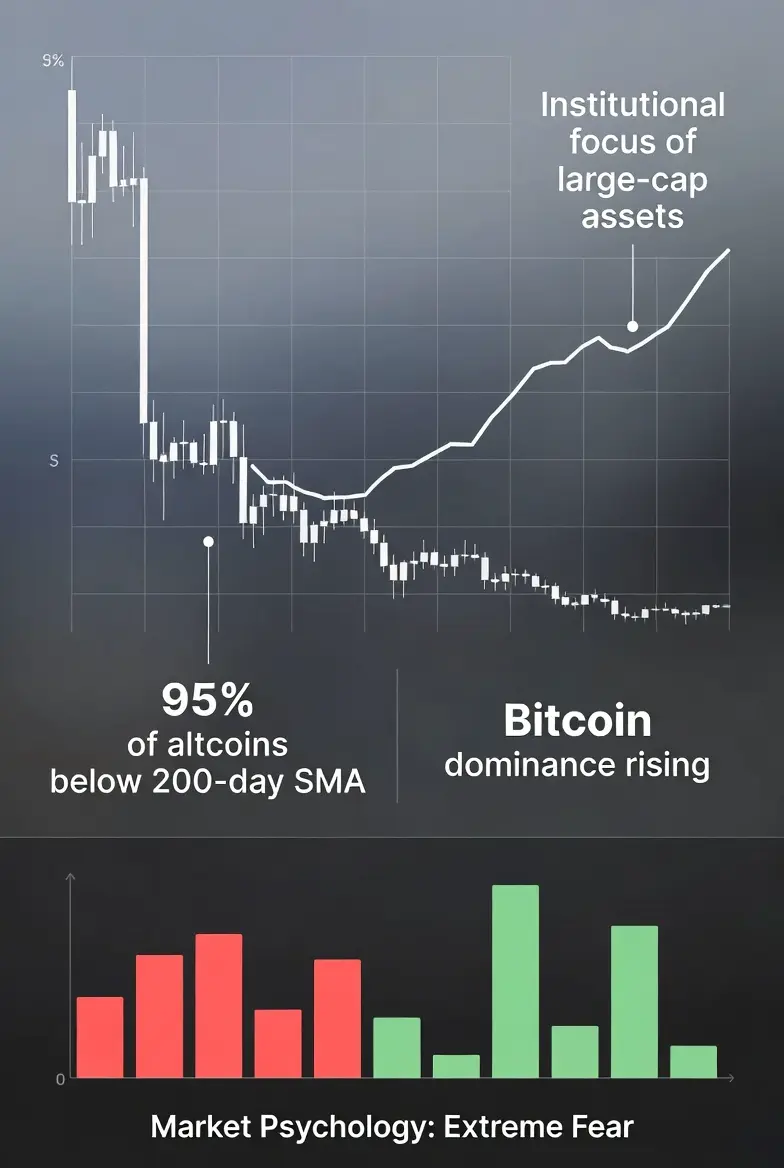
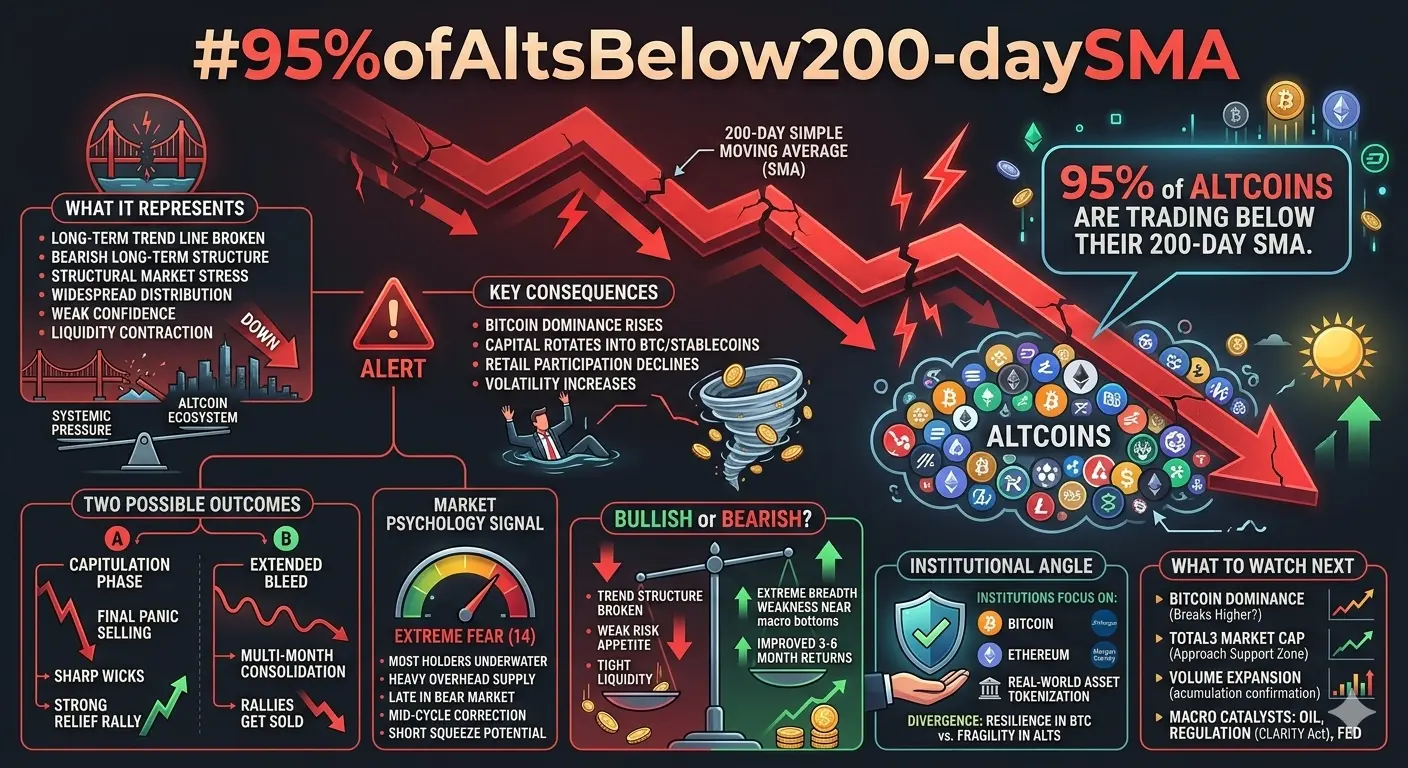
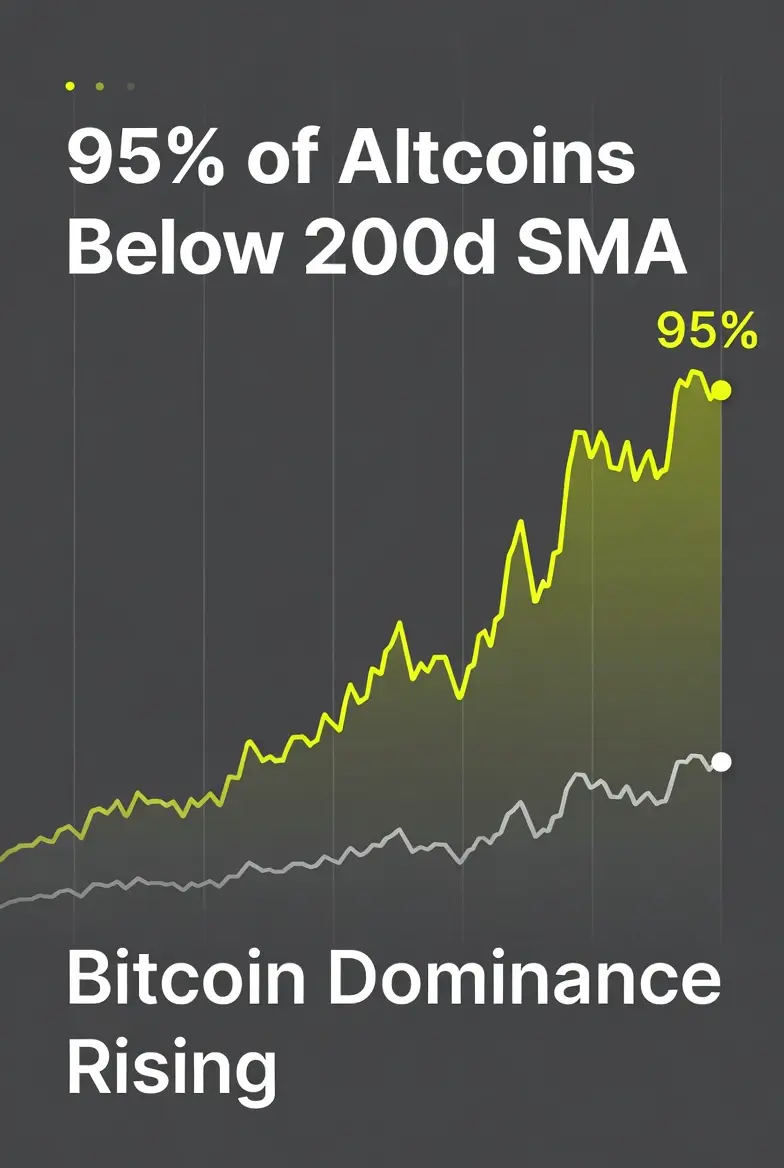
#95%ofAltsBelow200-daySMA
#95%ofAltsBelow200-daySMA
The statistic that 95% of altcoins are trading below their 200-day Simple Moving Average (SMA) is one of the strongest technical signals of broad market weakness — and it tells a much bigger story about the current crypto cycle.
📉 What Does the 200-Day SMA Represent?
The 200-day SMA is widely viewed as the long-term trend line in financial markets.
Trading above it → Bullish long-term structure
Trading below it → Bearish long-term structure
Mass breakdown across assets → Structural market stress
When 95% of altcoins are below this level, it
- Reward
- 3
- 2
- Repost
- Share
CryptoEye:
LFG 🔥View More
New projects are safe and reliable. If you want to learn more, reply with 1.
View Original
- Reward
- like
- Comment
- Repost
- Share
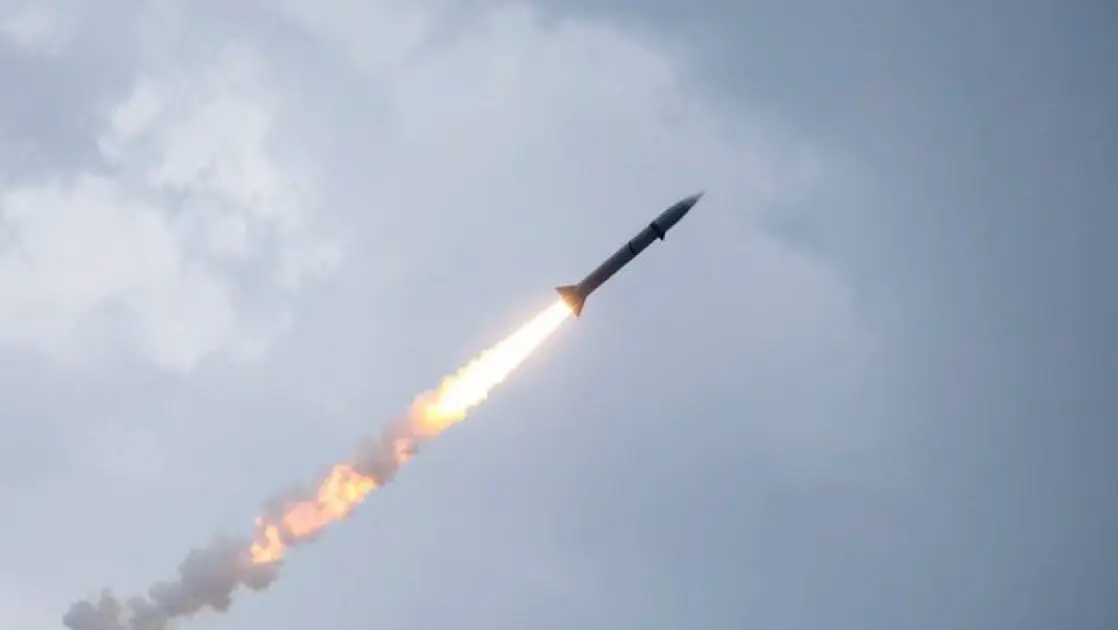
🚨BREAKING: Iran is striking major ports and oil tankers in the Middle East and this could trigger a supply shock in Crude Oil.
- Reward
- 2
- Comment
- Repost
- Share
#USIsraelStrikesIranBTCPlunges
It seems Bitcoin gone down $65k .. This is bad and tomorrow is the key in my opinion , anything can happen , Hopefully These situation turns in Very Positive market soon ! We don’t want people die .
It seems Bitcoin gone down $65k .. This is bad and tomorrow is the key in my opinion , anything can happen , Hopefully These situation turns in Very Positive market soon ! We don’t want people die .
BTC-2,19%

- Reward
- 3
- 1
- Repost
- Share
MosfickBrother:
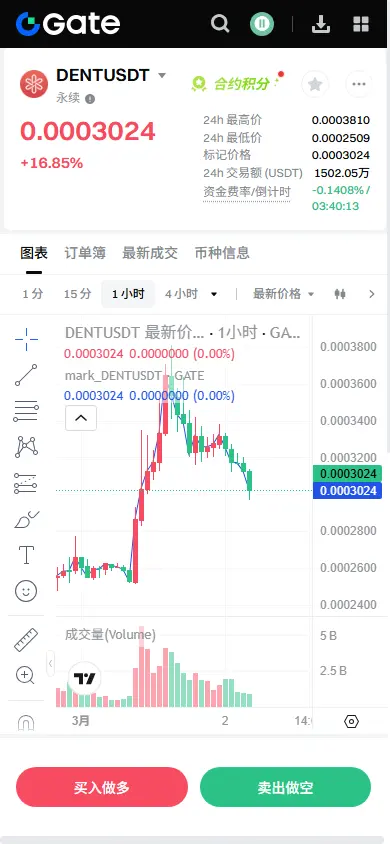
To The Moon 🌕【$DENT Signal】Pullback to Long Entry + Order Book Support Play
$DENT 1H timeframe is testing the key support zone with strong buy-side depth, indicating a typical pullback entry point for longs. Although the 4H chart experienced a sharp rally followed by consolidation at higher levels, the overall trend remains intact. In a negative funding rate environment, the price remains firm above 0.0003, showing limited bearish pressure, and the main force is clearly defending the price.
🎯Direction: Long (Long)
⚡Entry/Order: 0.000294 - 0.000295
🛑Stop Loss: 0.000285
🚀Target 1: 0.000315
🚀Target 2: 0.0
View Original$DENT 1H timeframe is testing the key support zone with strong buy-side depth, indicating a typical pullback entry point for longs. Although the 4H chart experienced a sharp rally followed by consolidation at higher levels, the overall trend remains intact. In a negative funding rate environment, the price remains firm above 0.0003, showing limited bearish pressure, and the main force is clearly defending the price.
🎯Direction: Long (Long)
⚡Entry/Order: 0.000294 - 0.000295
🛑Stop Loss: 0.000285
🚀Target 1: 0.000315
🚀Target 2: 0.0
- Reward
- 1
- Comment
- Repost
- Share
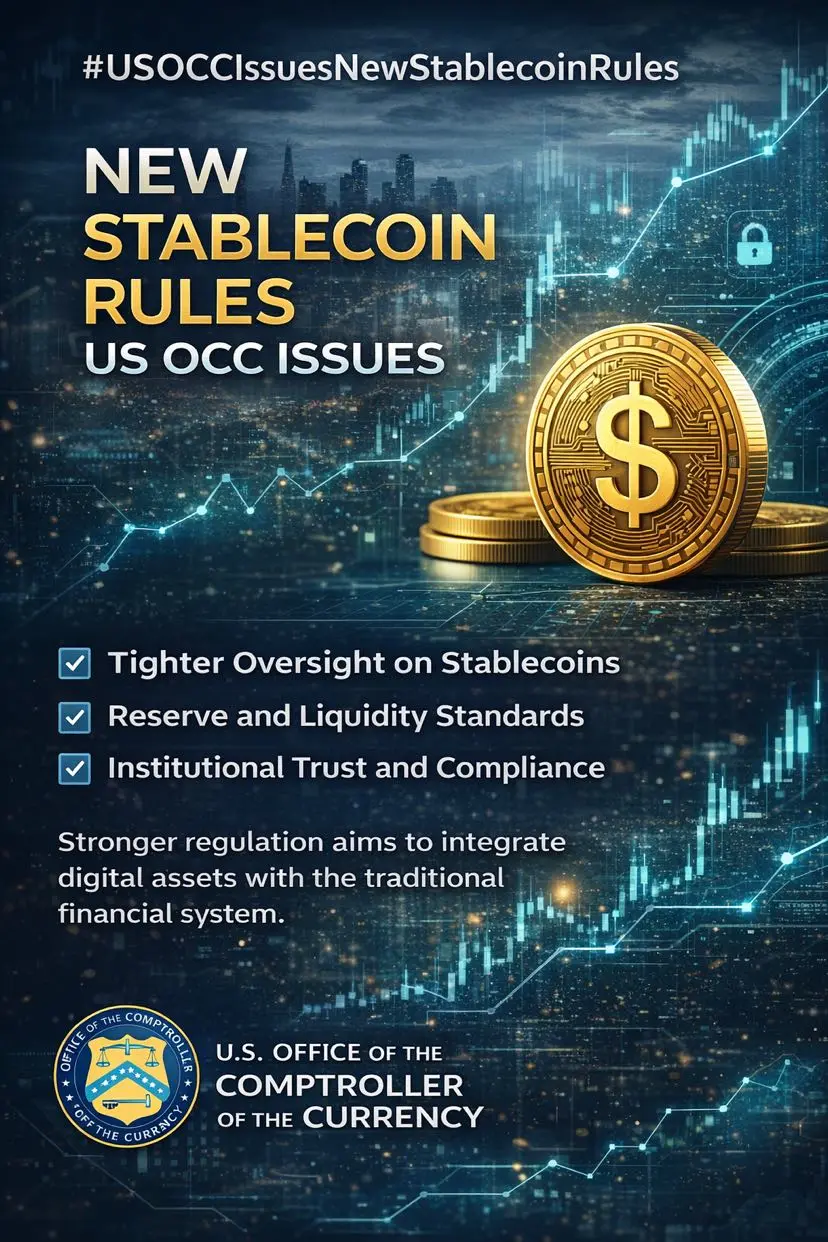
#USOCCIssuesNewStablecoinRules StablecoinsEnterNewEra
The digital asset landscape is stepping into a decisive phase where regulation is no longer perceived as a barrier but as a structural catalyst. With the evolving oversight framework shaped by the U.S. Office of the Comptroller of the Currency (OCC), stablecoins are transitioning from experimental liquidity tools into formally recognized components of the financial architecture. This is not just policy refinement — it is institutional validation in motion.
The emphasis on reserve transparency, liquidity sufficiency, and real-time auditabili
- Reward
- like
- Comment
- Repost
- Share
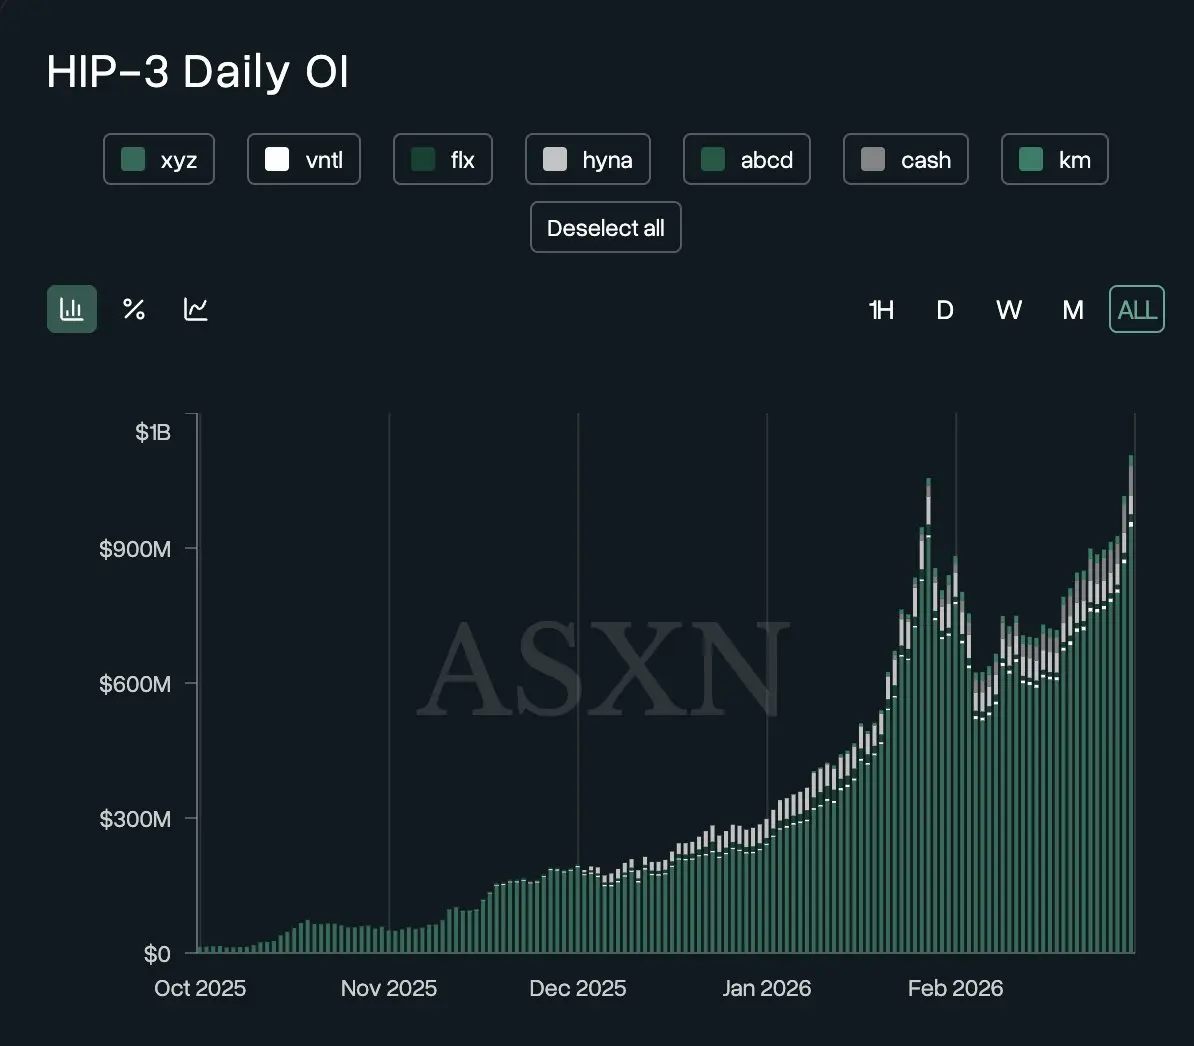
President Trump's weekend war antics fueling the biggest rise of 24/7 tokenized commodity trading ever wasn't on my bingo card for 2026 tbh
- Reward
- 1
- Comment
- Repost
- Share
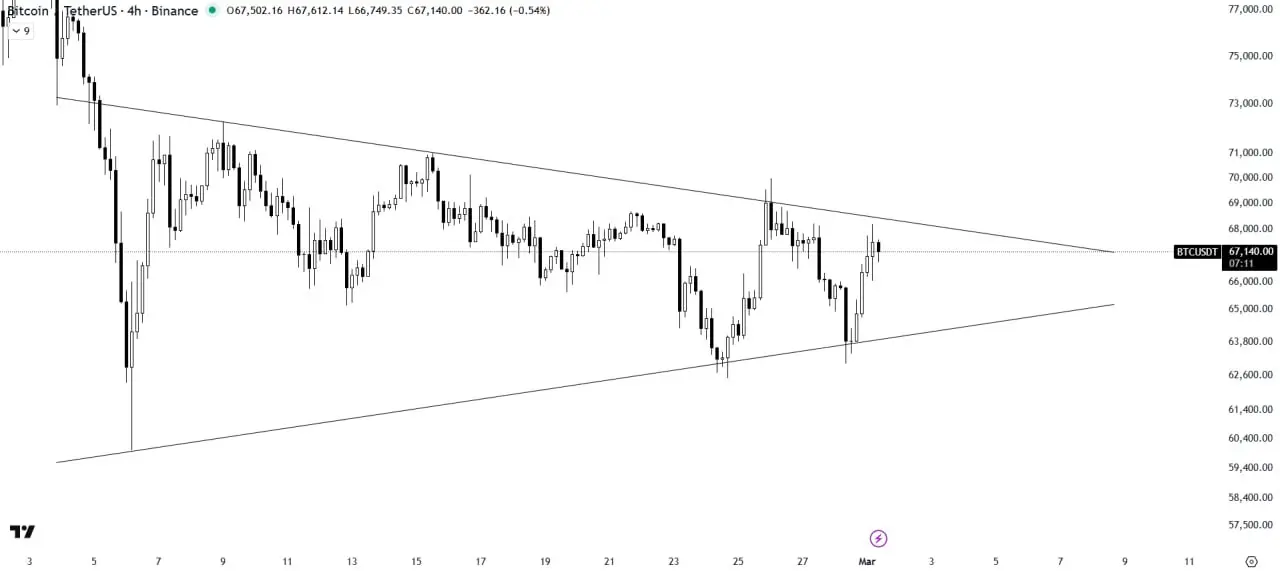
$BTC still moving inside that triangle.
It bounced from support, but it’s still under resistance.
So nothing confirmed yet.
If it breaks up with strength, that’s your signal.
If it loses support, that’s your answer too.
Right now? It’s just waiting.
Best move here is patience. Let the breakout decide.
#Bitcoin #USIsraelStrikesIranBTCPlunges
BTC-2,19%
- Reward
- 2
- 3
- Repost
- Share
GateUser-4a8b4621 :
:
To The Moon 🌕View More
F
飞驰人生
Created By@DonaldLiuTao
Subscription Progress
0.00%
MC:
$0
More Tokens
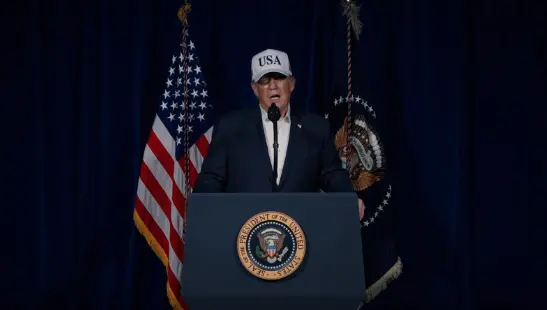
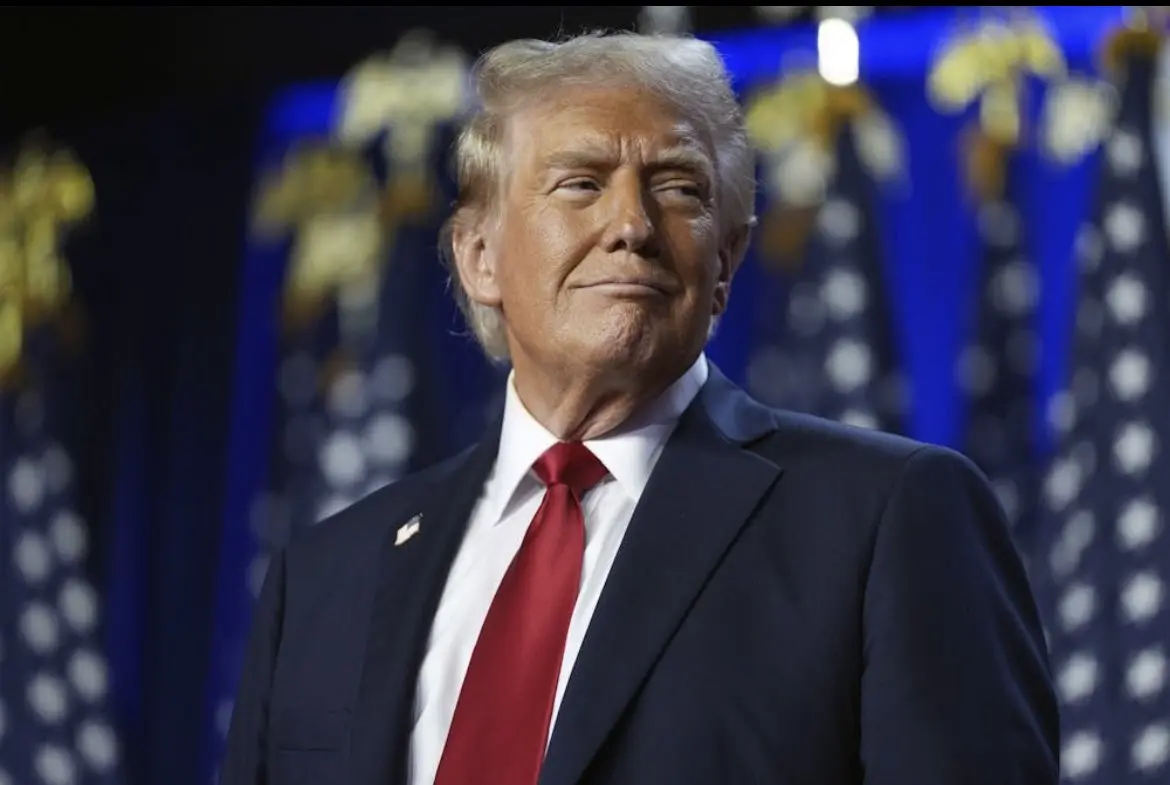
🚨 Rumors say 🚨
Trump: The new Iranian leadership wants to talk to me, and I agreed to speak with them.
✍️ I previously mentioned: Trump will seek to stop the war now to protect the markets and oil prices because they contribute to rising inflation.
View OriginalTrump: The new Iranian leadership wants to talk to me, and I agreed to speak with them.
✍️ I previously mentioned: Trump will seek to stop the war now to protect the markets and oil prices because they contribute to rising inflation.
- Reward
- like
- Comment
- Repost
- Share
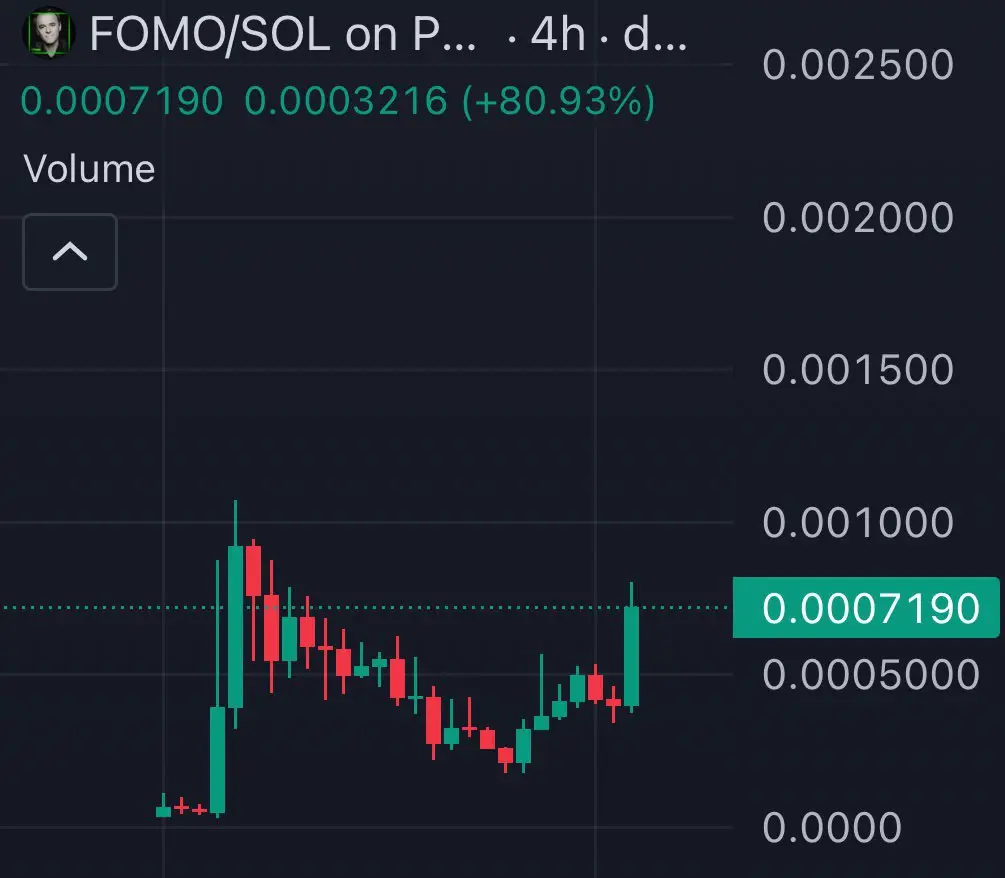
Woke up to a nice bounce on fomo to start the month
Gave a nice entry for those that missed now send it higher
Gave a nice entry for those that missed now send it higher
- Reward
- 3
- 1
- Repost
- Share
ybaser :
:
thanks for sharing information with us
- Reward
- 1
- Comment
- Repost
- Share
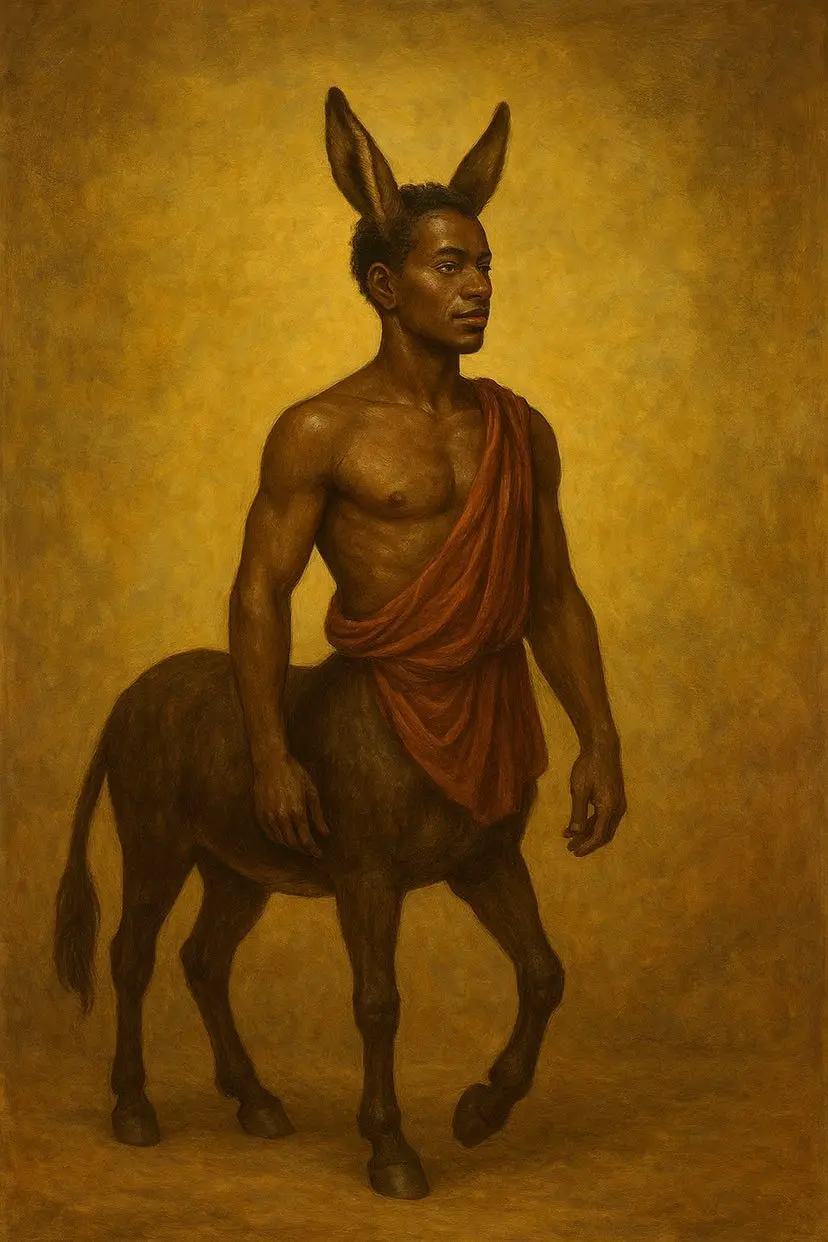
$SKYAI
💥💣⤵️↘️⤵️⬇️💣💥 And yes…
I’ve found myself a new donkey to play with. 😁🤣
(I’m still competing with the other donkeys too.)
But it feels a bit early to ride it! I think the drop will continue.
I’m waiting below — if it comes down, I’ll buy. If not, nothing to do! 😉
And of course, this is not financial advice!
SKYAI-35,23%

- Reward
- 3
- 1
- Repost
- Share
ybaser:
thanks for sharing information with usLearn a Simple & Profitable Trading Strategy LIVE!
23
- Reward
- like
- Comment
- Repost
- Share
🇦🇪 UAE JUST SHUT DOWN KTS STOCK MARKET
THE UAE WILL CLOSE ITS STOCK MARKET ON MONDAY AND TUEADAY
DUE TO THE US-ISRAEL BOMBING STRIKE ON IRAN
ARE STOCKS COOKED? 🤔
THE UAE WILL CLOSE ITS STOCK MARKET ON MONDAY AND TUEADAY
DUE TO THE US-ISRAEL BOMBING STRIKE ON IRAN
ARE STOCKS COOKED? 🤔

- Reward
- 2
- Comment
- Repost
- Share
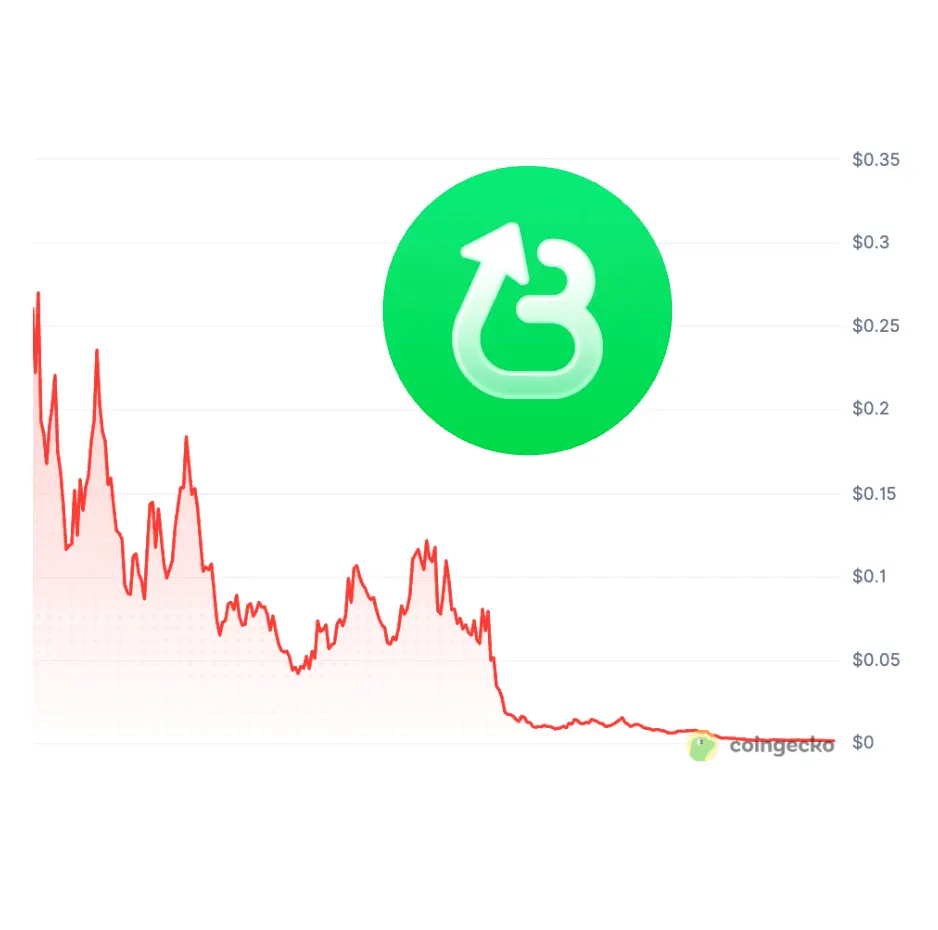
Dear @nikitabier,
Do you remember the “Killer Virus Cycle”?
Ultimately, Believe is not actually a hit product
The founder completely abandoned this project ( in his last post after October 2025, reportedly leaving with millions of dollars
In other words, it’s gone to zero
Obviously, this is not your fault
Cryptocurrency is still in its early stages. Some projects succeed, but most fail, which is normal in the startup world
My current question is:
How should we talk about high-risk investments like Believe?
How do I know if you have received compensation or played any advisory role?
If someone
BELIEVE1,76%

- Reward
- 2
- Comment
- Repost
- Share
Load More
Join 40M users in our growing community
⚡️ Join 40M users in the crypto craze discussion
💬 Engage with your favorite top creators
👍 See what interests you
Trending Topics
View More42.47M Popularity
166.28K Popularity
142.77K Popularity
1.67M Popularity
529.66K Popularity
Hot Gate Fun
View More- MC:$0.1Holders:10.00%
- MC:$2.38KHolders:10.00%
- MC:$2.43KHolders:20.14%
- MC:$2.38KHolders:10.00%
- MC:$2.38KHolders:10.00%
News
View MoreETH drops below 1950 USDT
59 m
Data: If BTC breaks through $69,628, the total liquidation strength of long positions on mainstream CEXs will reach $1.257 billion.
2 h
Data: If ETH drops below $1,882, the total long liquidation strength on major CEXs will reach $698 million.
2 h
European Central Bank's Nagel: The US dollar's safe-haven status is being questioned, and the weak exchange rate will persist
2 h
BTC drops below 66,000 USDT
3 h
Pin