Trade
Basic
Futures
Futures
Hundreds of contracts settled in USDT or BTC
TradFi
Gold
Trade global traditional assets with USDT in one place
Options
Hot
Trade European-style vanilla options
Unified Account
Maximize your capital efficiency
Demo Trading
Futures Kickoff
Get prepared for your futures trading
Futures Events
Participate in events to win generous rewards
Demo Trading
Use virtual funds to experience risk-free trading
Earn
Launch
CandyDrop
Collect candies to earn airdrops
Launchpool
Quick staking, earn potential new tokens
HODLer Airdrop
Hold GT and get massive airdrops for free
Launchpad
Be early to the next big token project
Alpha Points
Trade on-chain assets and enjoy airdrop rewards!
Futures Points
Earn futures points and claim airdrop rewards
Investment
Simple Earn
Earn interests with idle tokens
Auto-Invest
Auto-invest on a regular basis
Dual Investment
Buy low and sell high to take profits from price fluctuations
Soft Staking
Earn rewards with flexible staking
Crypto Loan
0 Fees
Pledge one crypto to borrow another
Lending Center
One-stop lending hub
VIP Wealth Hub
Customized wealth management empowers your assets growth
Private Wealth Management
Customized asset management to grow your digital assets
Quant Fund
Top asset management team helps you profit without hassle
Staking
Stake cryptos to earn in PoS products
Smart Leverage
New
No forced liquidation before maturity, worry-free leveraged gains
GUSD Minting
Use USDT/USDC to mint GUSD for treasury-level yields
More
JinchengA
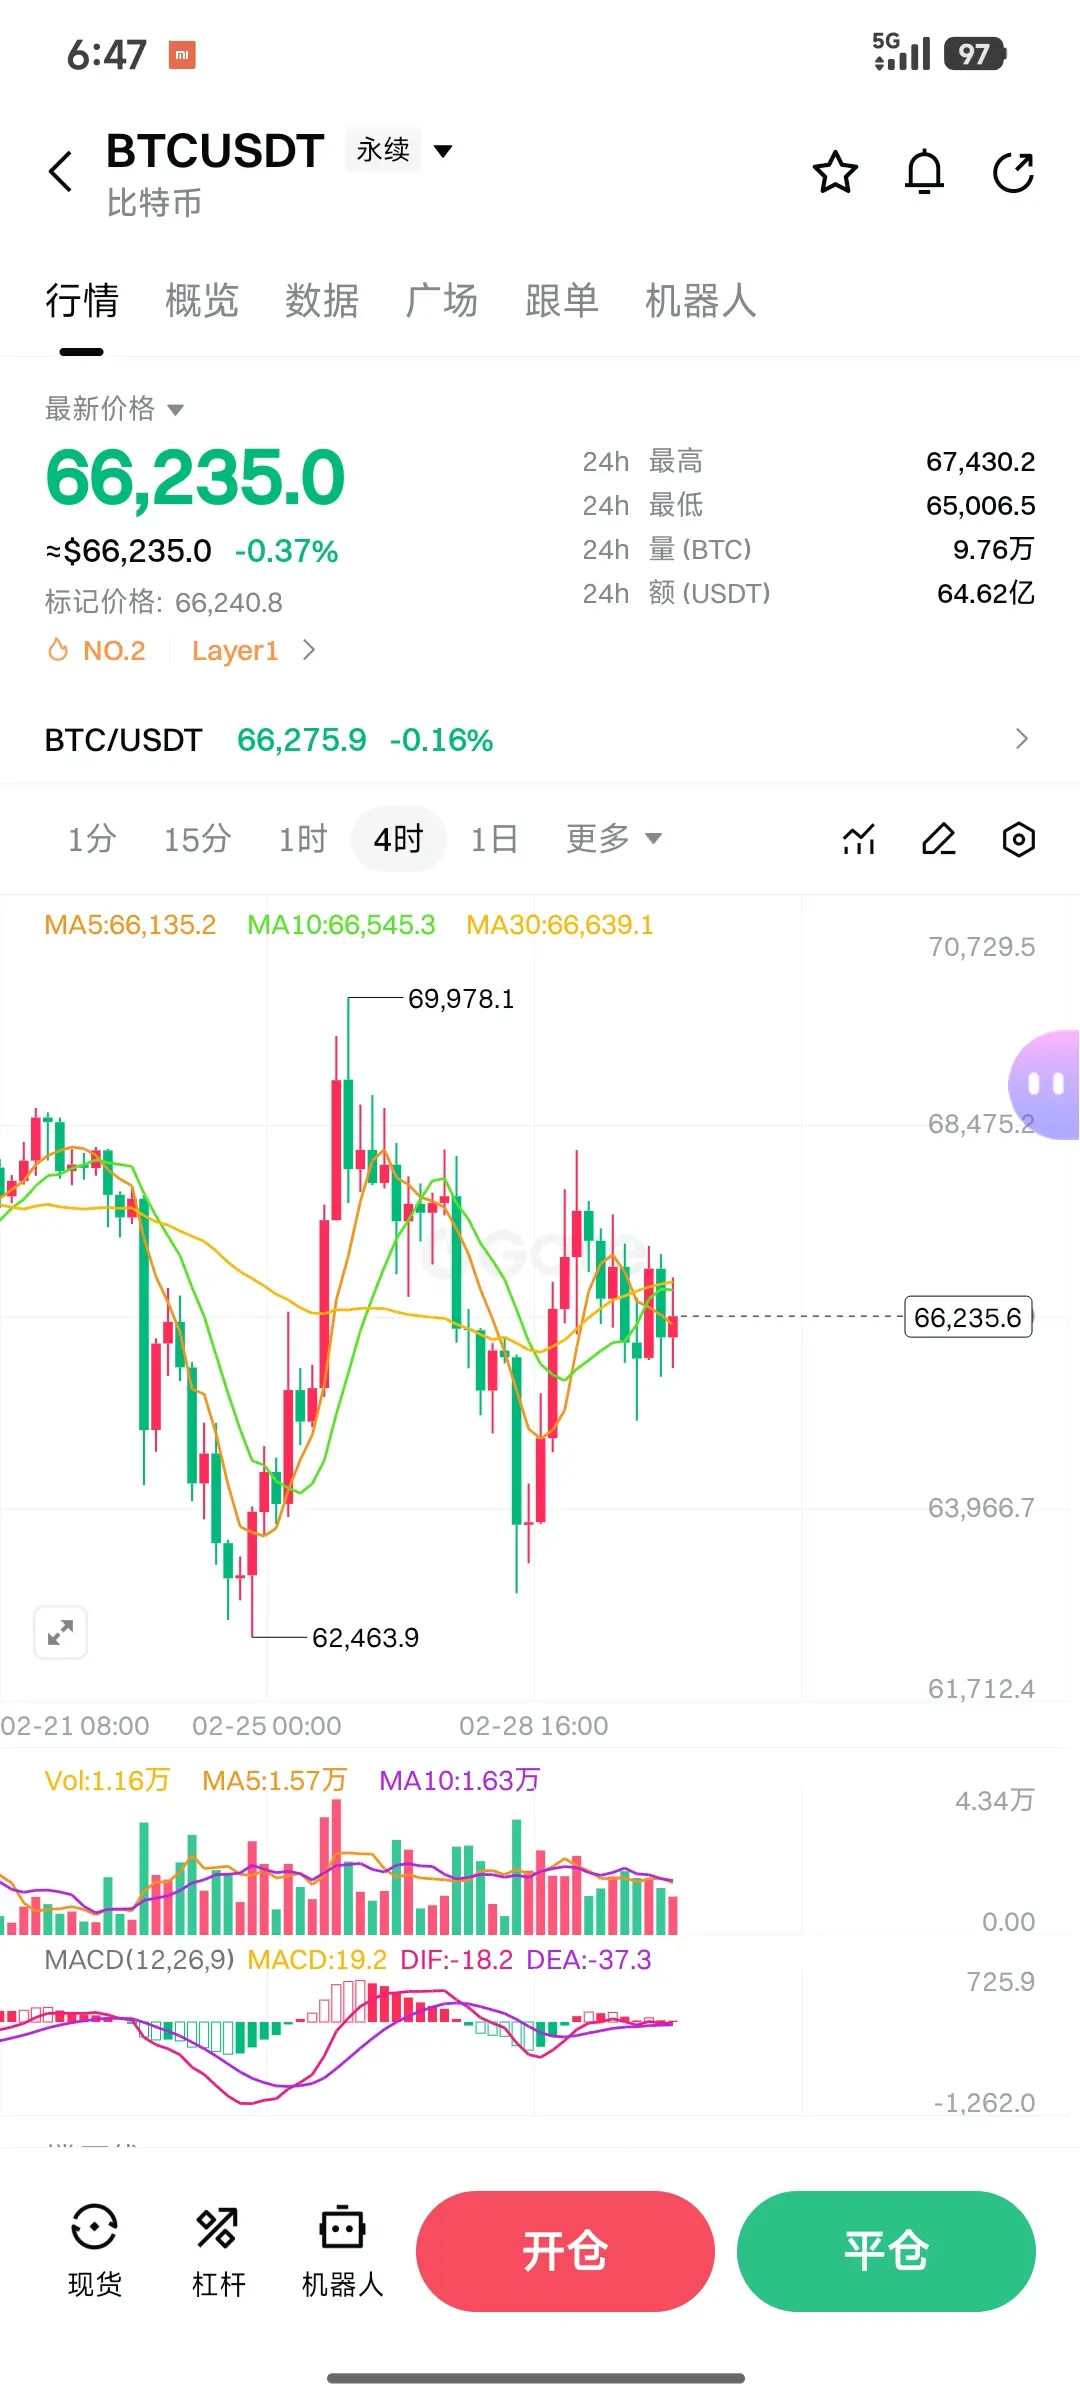
Bitcoin Evening Analysis!
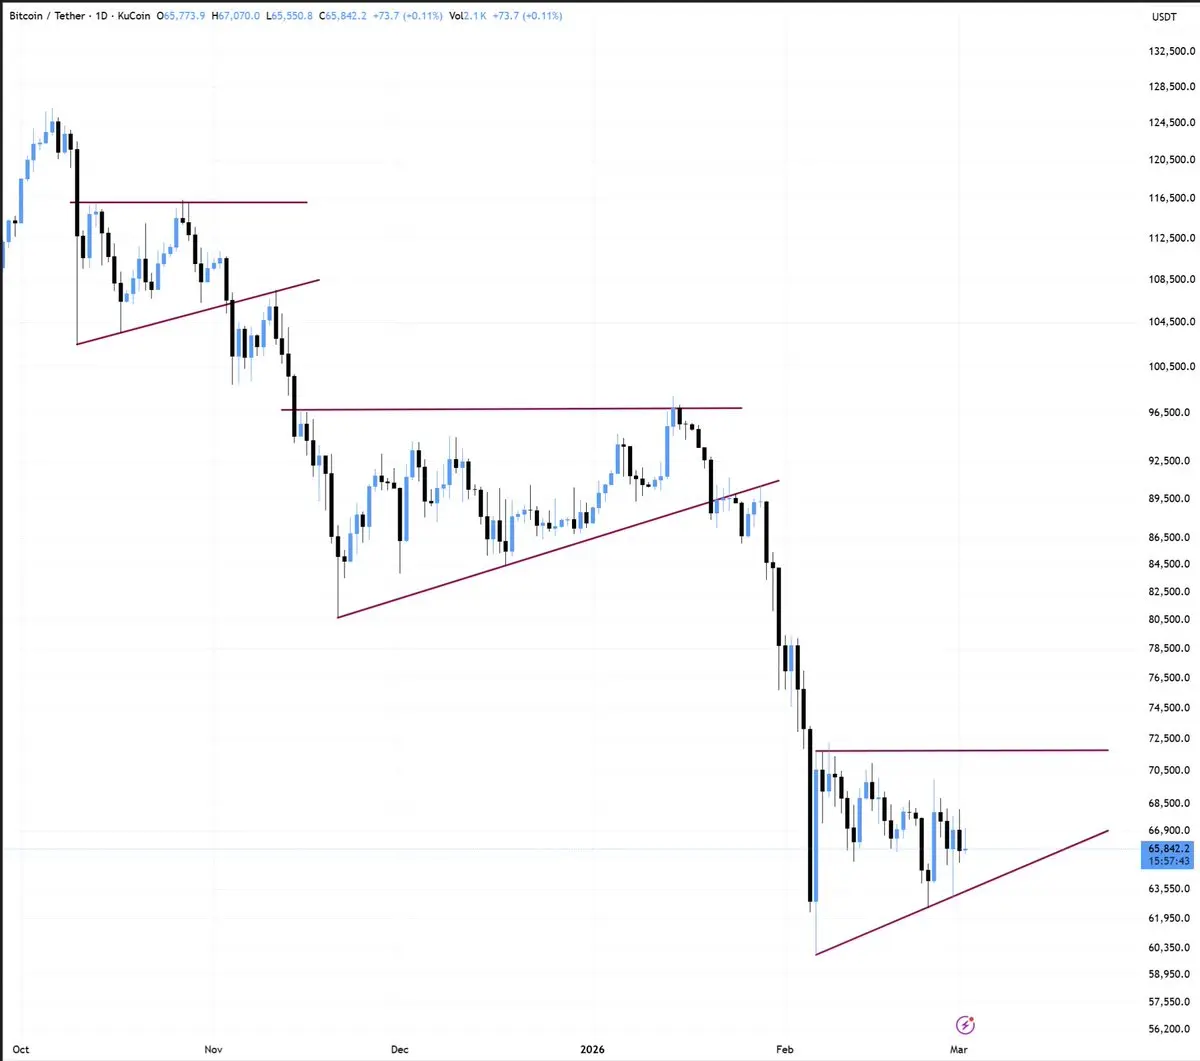
Currently, Bitcoin has officially entered the critical battle at 66,346. This level directly determines whether the market will rebound or continue to decline, and the trend is very clear.
At present, Bitcoin is fluctuating within a triangle range. It has been supported twice near 65,283, and the support below is temporarily effective. Whether it can strengthen depends on whether it can hold above 66,346. Only by breaking above this level can there be a rebound opportunity; if it cannot, it is likely to continue declining.
The market also shows two W-bottom patterns:
BTC-0,39%
- Reward
- 3
- Comment
- Repost
- Share
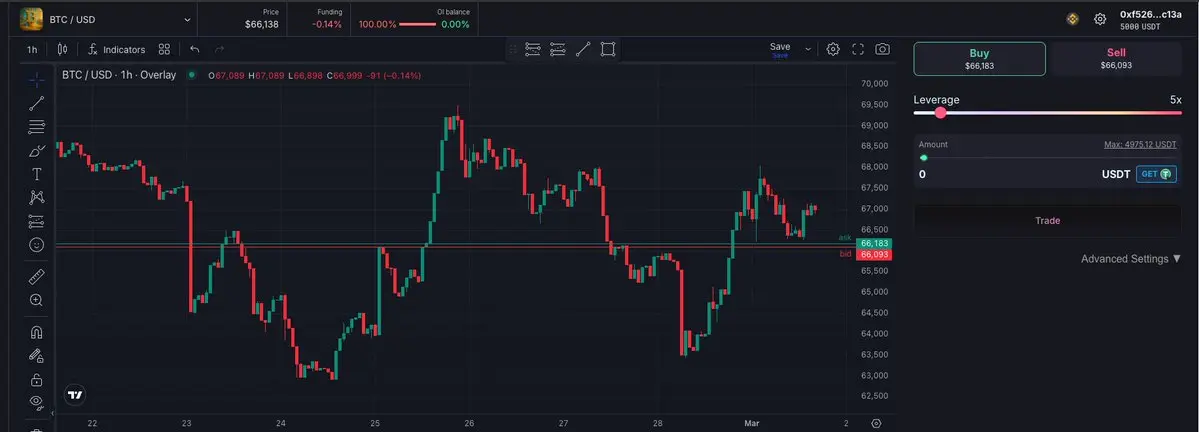
BTC Update - March 1, 2026
$BTC is currently consolidating around $66K after bouncing from the $63.5K lows. This level is acting as a key decision zone.
Support sits at $65K. As long as this holds, structure remains stable.
Resistance is at $67.5K–$69K. A breakout above that opens the door for a move toward $70K+.
Right now, BTC is ranging and building liquidity before the next major move.
$5k to 20k challenge. who's ready to trade with me?
BTC-0,39%
- Reward
- 2
- Comment
- Repost
- Share
🔹 Geopolitical tensions in the Middle East ignite a rush to safety! Gold, silver, and oil are all rallying—will capital flow into Bitcoin next?
1.188
- Reward
- 1
- 2
- Repost
- Share
MarketAdvicer:
LFG 🔥View More
SWXL
SanWeiXianLu
Created By@WhaleKingTyrannosaurusRex
Subscription Progress
0.00%
MC:
$0
More Tokens
⏳ The countdown is on — just 3 days left!
The $50,000 Red Envelope Rain event on **Gate.io Gate Plaza** is already underway, and the opportunity is simple: post and earn. Whether you're a new user or a long-time participant, this campaign makes it easy to grab rewards with minimal effort.
Here’s what stands out:
• Up to **28U per post**
• Increased daily reward limits
• Automatic credit after posting
• Open to both new and existing users
If you're already active on Gate Plaza, this is a smart moment to stay consistent and maximize the boosted cap. A few quality posts over the next few days cou


- Reward
- 2
- 2
- Repost
- Share
CryptoFiler:
2026 GOGOGO 👊View More
Don't let momentary excitement ruin your trading
Getting overly excited and chasing highs
Fearing and cutting losses
Feeling anxious and constantly trading
It looks busy, but it's all in vain
Trading should be steady, not driven by excitement, but by discipline
Once you learn to accept "boredom"
Control your hands and sit still
That's when you've truly entered the door
$BTC $GT $ETH
View OriginalGetting overly excited and chasing highs
Fearing and cutting losses
Feeling anxious and constantly trading
It looks busy, but it's all in vain
Trading should be steady, not driven by excitement, but by discipline
Once you learn to accept "boredom"
Control your hands and sit still
That's when you've truly entered the door
$BTC $GT $ETH
- Reward
- 1
- Comment
- Repost
- Share
- Reward
- like
- Comment
- Repost
- Share
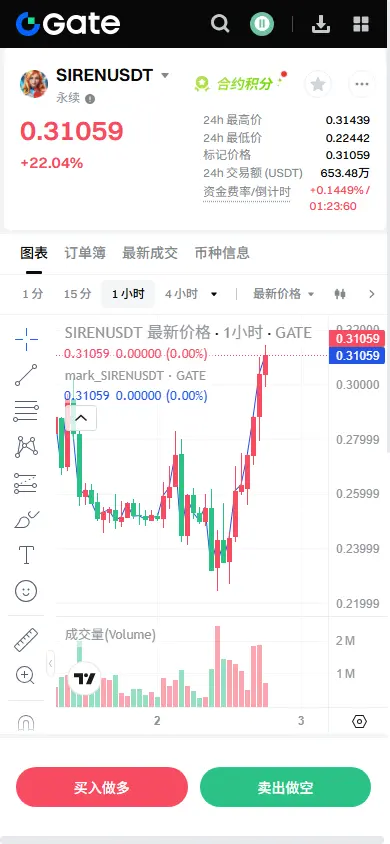
【$SIREN Signal】Long + 1H Momentum Breakout & 4H Trend Confirmation
$SIREN The 1H timeframe has strongly broken above the previous high and stabilized above EMA20, with increasing volume and price, indicating strong momentum. The 4H chart has formed a bullish engulfing pattern, breaking through the descending trendline, shifting the trend from weak to strong. Market depth shows active buying, stable open interest, and clear institutional support.
🎯Direction: Long (Long)
⚡Entry/Order: 0.30579 - 0.30611 (Current market range, aggressive traders can enter at the current price)
🛑Stop Loss: 0.2787
View Original$SIREN The 1H timeframe has strongly broken above the previous high and stabilized above EMA20, with increasing volume and price, indicating strong momentum. The 4H chart has formed a bullish engulfing pattern, breaking through the descending trendline, shifting the trend from weak to strong. Market depth shows active buying, stable open interest, and clear institutional support.
🎯Direction: Long (Long)
⚡Entry/Order: 0.30579 - 0.30611 (Current market range, aggressive traders can enter at the current price)
🛑Stop Loss: 0.2787
- Reward
- 2
- Comment
- Repost
- Share
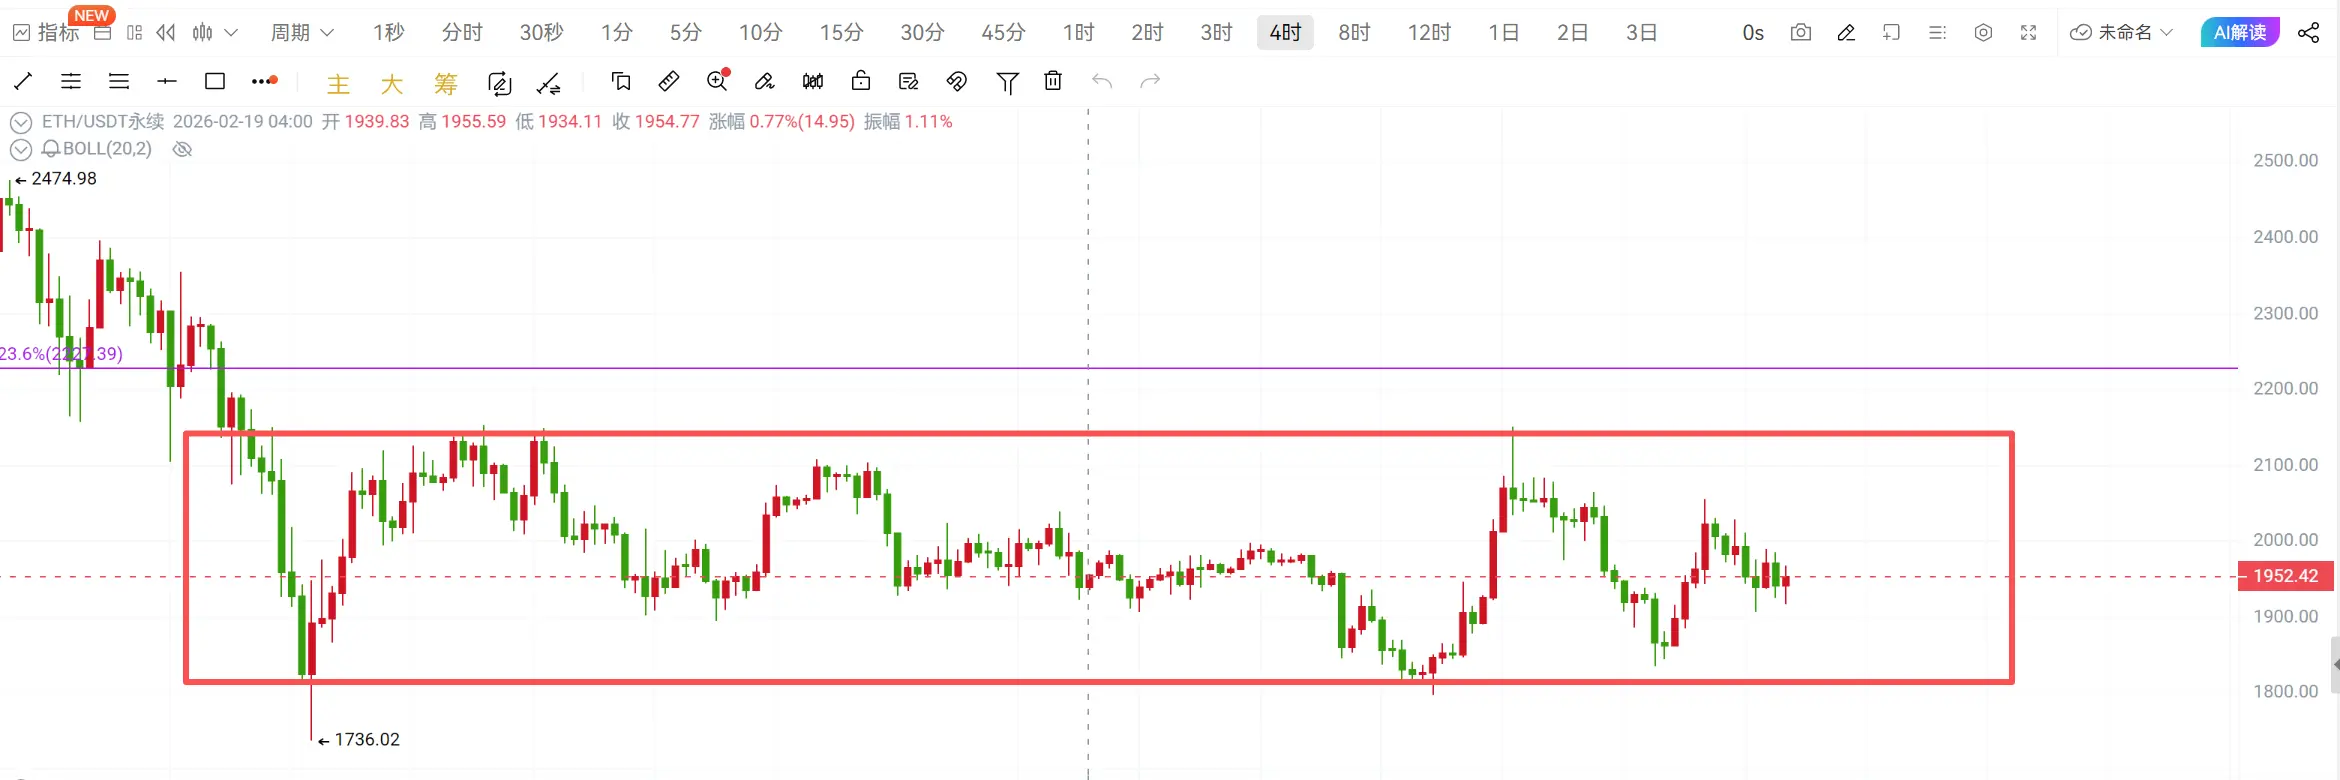
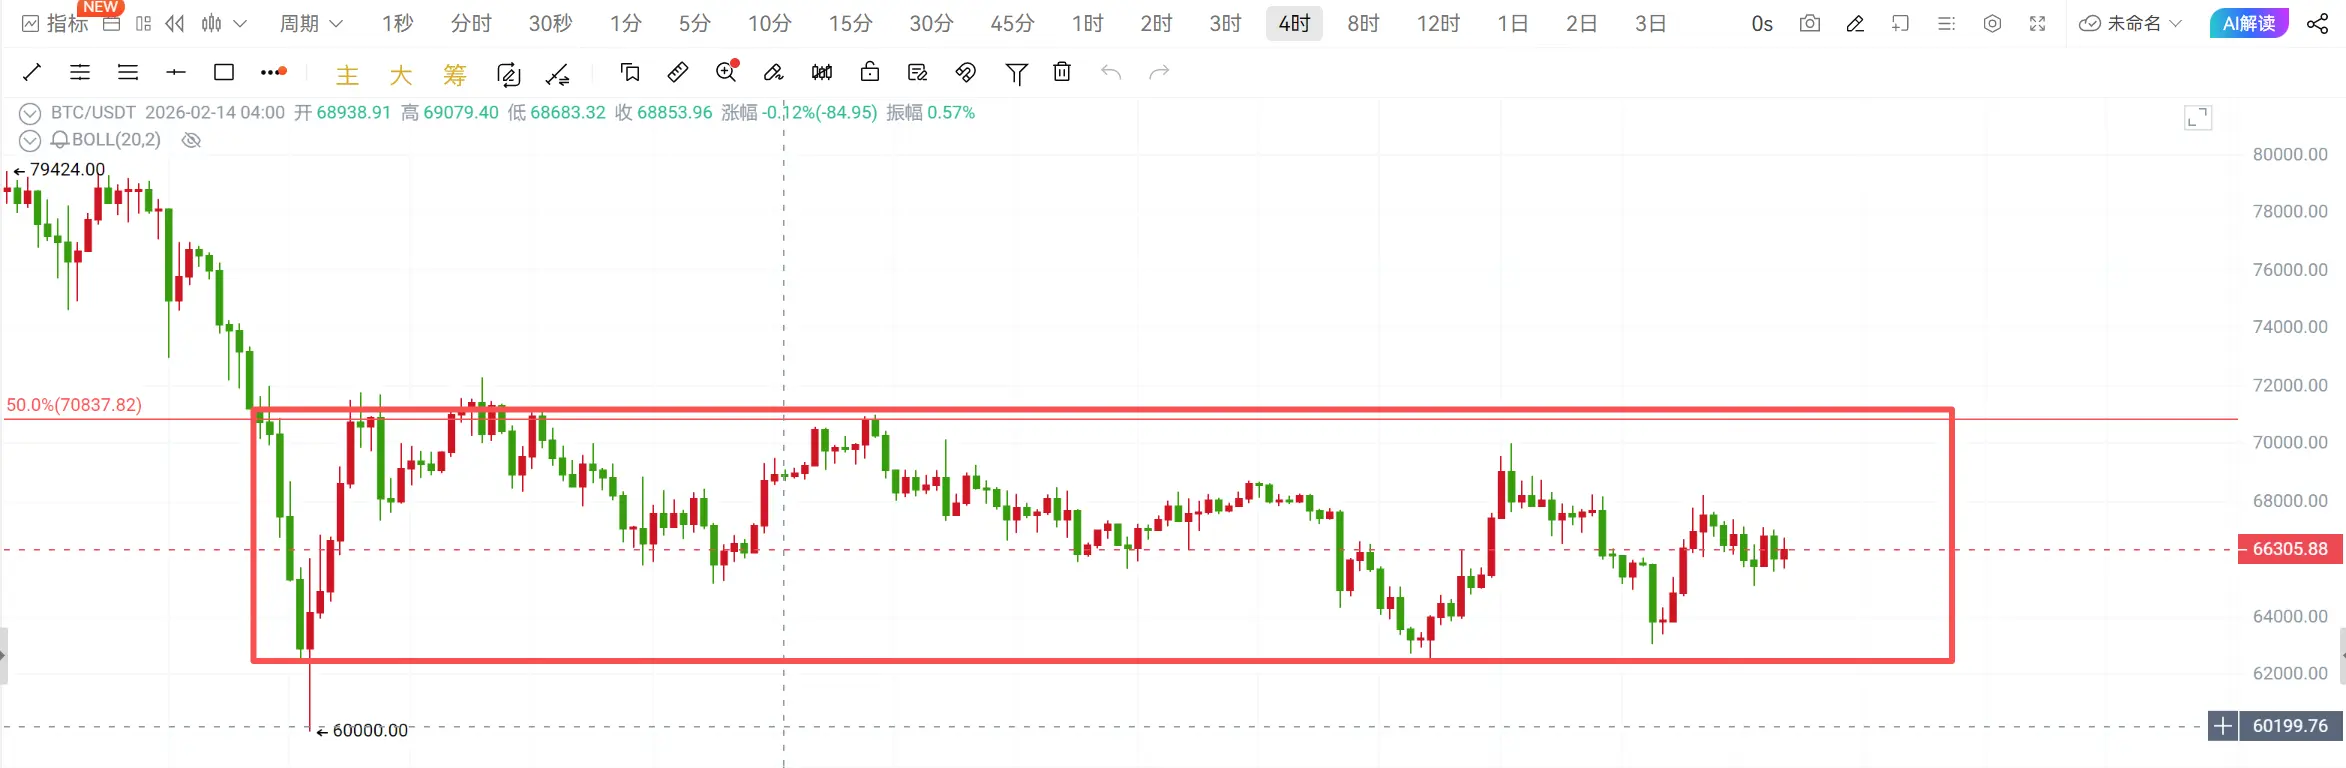
Weekly chart shows Bitcoin and Ethereum both closing with alternating bullish and bearish candles, indicating a typical consolidation phase. The trading range is gradually narrowing. Previously, the box structure was between 71,000 and 63,000. Currently, it is between 68,000 and 65,000, with resistance at 68,000-70,500 and support at 65,000-63,000. Ethereum's daily chart trend is synchronized with Bitcoin, with the previous box range between 1,800 and 2,150. Currently, it is between 2,000 and 1,900, with resistance at 2,050-2,150 and support at 1,920-1,800.
On the 4-hour chart, after the overs
View OriginalOn the 4-hour chart, after the overs
- Reward
- like
- Comment
- Repost
- Share
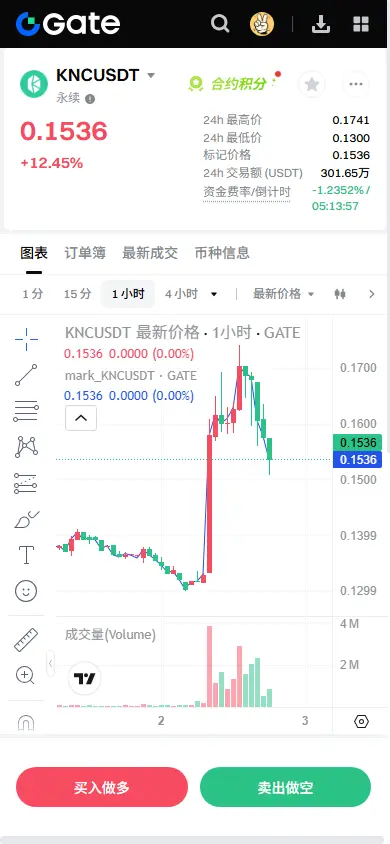
【$KNC Signal】Pullback to add longs + 1H level retest confirmation, main force clearly supporting the market
$KNC After experiencing a massive rally, the 1H level is undergoing a healthy correction, with the price retracing to near the key EMA20 (0.1521). The 4H level has formed a strong breakout structure, and the current pullback shows decreasing volume, with open interest (OI) remaining stable, indicating that the main force has not exited. This is a typical strong consolidation. The order book depth imbalance (8.92%) favors buyers, with dense support below.
🎯 Direction: Long (Long)
⚡ Ent
View Original$KNC After experiencing a massive rally, the 1H level is undergoing a healthy correction, with the price retracing to near the key EMA20 (0.1521). The 4H level has formed a strong breakout structure, and the current pullback shows decreasing volume, with open interest (OI) remaining stable, indicating that the main force has not exited. This is a typical strong consolidation. The order book depth imbalance (8.92%) favors buyers, with dense support below.
🎯 Direction: Long (Long)
⚡ Ent
- Reward
- 1
- Comment
- Repost
- Share
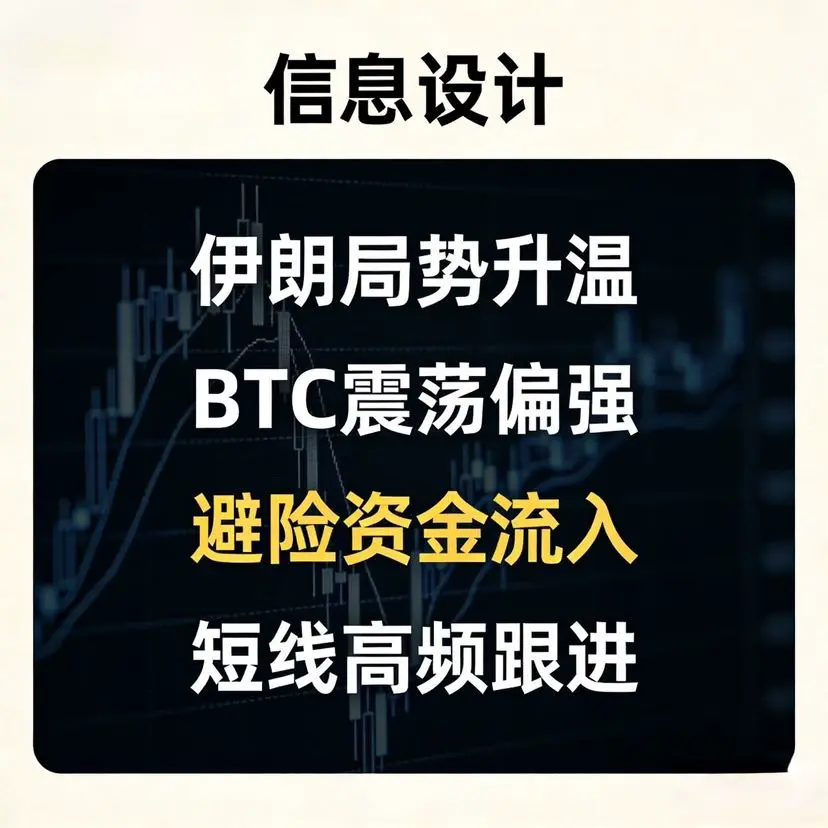
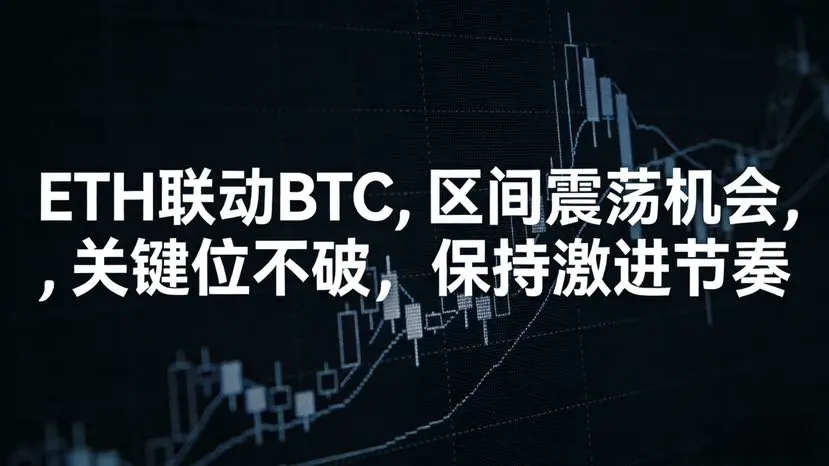
—Iran Situation Escalates | Latest Trends in BTC/ETH
Recent international geopolitical conflicts continue, and the situation in Iran has become more tense. Market risk aversion sentiment has clearly increased, leading to correlated fluctuations between traditional safe-haven assets and the crypto market.
BTC remains volatile at high levels in the short term, with the overall bullish trend intact. Key support levels have not been broken, and a high-frequency follow-up rhythm is maintained in the short term.
ETH moves in tandem with Bitcoin, with potential swing trading opportunities amid fluctu
View OriginalRecent international geopolitical conflicts continue, and the situation in Iran has become more tense. Market risk aversion sentiment has clearly increased, leading to correlated fluctuations between traditional safe-haven assets and the crypto market.
BTC remains volatile at high levels in the short term, with the overall bullish trend intact. Key support levels have not been broken, and a high-frequency follow-up rhythm is maintained in the short term.
ETH moves in tandem with Bitcoin, with potential swing trading opportunities amid fluctu
- Reward
- 2
- Comment
- Repost
- Share
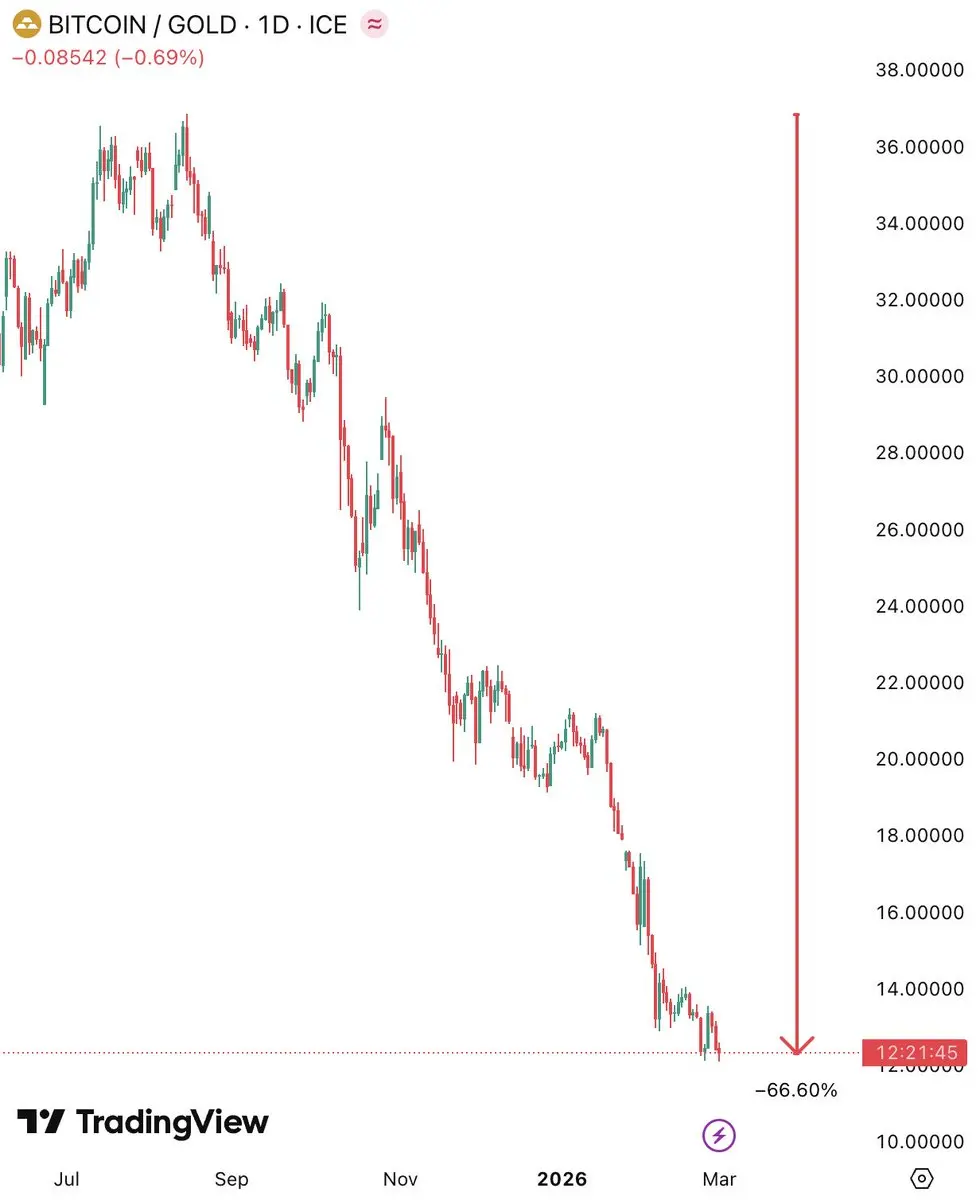
One of the craziest charts I've ever seen.
Bitcoin is down 66% against Gold since August 2025
Bitcoin is down 66% against Gold since August 2025
BTC-0,39%
- Reward
- like
- Comment
- Repost
- Share
TRUMP
TRUMP
Created By@gatefunuser_773c
Listing Progress
0.00%
MC:
$2.37K
More Tokens
⏰ Final 3 Days — Don’t Miss the Boosted Rewards
The $50,000 Red Envelope Rain campaign on Gate.io Gate Plaza is entering its final stretch — and this is where consistency pays.
For a limited time, users can earn rewards simply by publishing quality posts. No complicated tasks. No hidden requirements. Just contribute and get rewarded.
🔹 What Makes This Campaign Worth It?
• Earn up to 28 USDT per post
• Higher daily earning limits
• Automatic reward distribution
• Available for both new and existing users
If you're already active on Gate Plaza, this is the perfect opportunity to maximize your a


- Reward
- 2
- 3
- Repost
- Share
Crypto_Teacher:
Ape In 🚀View More

- Reward
- 3
- 3
- Repost
- Share
Crypto_Teacher:
Ape In 🚀View More
Not having expressed an opinion is truly my luck
View Original
- Reward
- 1
- Comment
- Repost
- Share
🔹 Bitcoin's monthly chart shows five consecutive red candles. The $70,000 level has become a make-or-break battleground—can it break through this time?
0
- Reward
- like
- Comment
- Repost
- Share
Is there a presence of you in Gate TradFi? Show your mindset before flaunting gains
When turbulence arrives, many people's first reaction isn't analysis but opening their accounts to check unrealized gains. Some have caught a tailwind in oil and gold on Gate TradFi, while others have been "educated" by market swings. Don't rush to just show profits; first, showcase your position management: Have you set stop-losses? Are you entering and exiting in batches? Have you been emotionally "harvested" by a single big bullish candle?
The biggest risk in this kind of market is "all-in bravado." The vola
View OriginalWhen turbulence arrives, many people's first reaction isn't analysis but opening their accounts to check unrealized gains. Some have caught a tailwind in oil and gold on Gate TradFi, while others have been "educated" by market swings. Don't rush to just show profits; first, showcase your position management: Have you set stop-losses? Are you entering and exiting in batches? Have you been emotionally "harvested" by a single big bullish candle?
The biggest risk in this kind of market is "all-in bravado." The vola


[The user has shared his/her trading data. Go to the App to view more.]
- Reward
- 1
- Comment
- Repost
- Share
#Серебро
Currently, locally, the sideways trend ( uncertainty and a wait-and-see stance), we leave the short at resistance and the long at support.
View OriginalCurrently, locally, the sideways trend ( uncertainty and a wait-and-see stance), we leave the short at resistance and the long at support.

- Reward
- 3
- 1
- Repost
- Share
AllaGr:
Buy for earning 💎Hurry up 🙏. Everyone go and join this event to get rewards 🎁✨
https://www.gate.com/activities/watch-to-earn/?now_period=17&refUid=44133226
#rewards
#gate
#Bitcoin’sSafeHavenAppeal
https://www.gate.com/activities/watch-to-earn/?now_period=17&refUid=44133226
#rewards
#gate
#Bitcoin’sSafeHavenAppeal
BTC-0,39%
- Reward
- 3
- 3
- Repost
- Share
Crypto_Teacher:
To The Moon 🌕View More
Load More
Join 40M users in our growing community
⚡️ Join 40M users in the crypto craze discussion
💬 Engage with your favorite top creators
👍 See what interests you
Trending Topics
View More332.99K Popularity
89.33K Popularity
162.07K Popularity
10.95M Popularity
12.09K Popularity
Hot Gate Fun
View More- MC:$2.38KHolders:10.00%
- MC:$2.38KHolders:10.00%
- MC:$2.38KHolders:10.00%
- MC:$0.1Holders:00.00%
- MC:$0.1Holders:10.00%
News
View MoreOverview of Mainstream Perp DEXs: Platform data remains relatively stable, with Hyperliquid's trading volume fluctuating around $5 billion.
1 m
Traditional Finance Alert: LMT Up Over 6%
3 m
IDOS(IDOS) will be officially launched on Gate Global on March 5th. The 336th HODLer Airdrop begins, and holding 1GT grants free access to share 5 million IDOS tokens.
9 m
Data: If BTC breaks through $69,504, the total liquidation strength of mainstream CEX short positions will reach $1.251 billion.
28 m
Data: If ETH breaks through $2,048, the total liquidation strength of mainstream CEX short positions will reach $869 million.
29 m
Pin