2025 TET Price Prediction: Expert Analysis and Market Forecast for the Coming Year
Introduction: TET's Market Position and Investment Value
Tectum (TET) is an innovative Layer 2 scaling solution for Bitcoin and cryptocurrencies, developed by cybersecurity company CrispMind. Built on the Tectum Layer 1 blockchain—the fastest blockchain in the world with transaction speeds of 1.3 million TPS/BPS—TET has established itself as a unique solution to blockchain scalability challenges. Since its launch in June 2023, Tectum has developed the SoftNote™ protocol, enabling users to enjoy instant, trustless, anonymous, and decentralized crypto payments without fees. As of December 24, 2025, TET has a market capitalization of approximately $4.25 million with a circulating supply of roughly 9.93 million tokens, currently trading around $0.4252 per token.
This emerging digital asset, recognized for its "ultimate Bitcoin/Crypto Layer 2 solution," is increasingly playing a critical role in addressing the limitations of existing blockchain infrastructure and payment networks.
This article will comprehensively analyze TET's price movements from 2025 to 2030, incorporating historical trends, market supply and demand dynamics, ecosystem development, and macroeconomic factors to provide investors with professional price forecasts and practical investment strategies.
Tectum (TET) Market Analysis Report
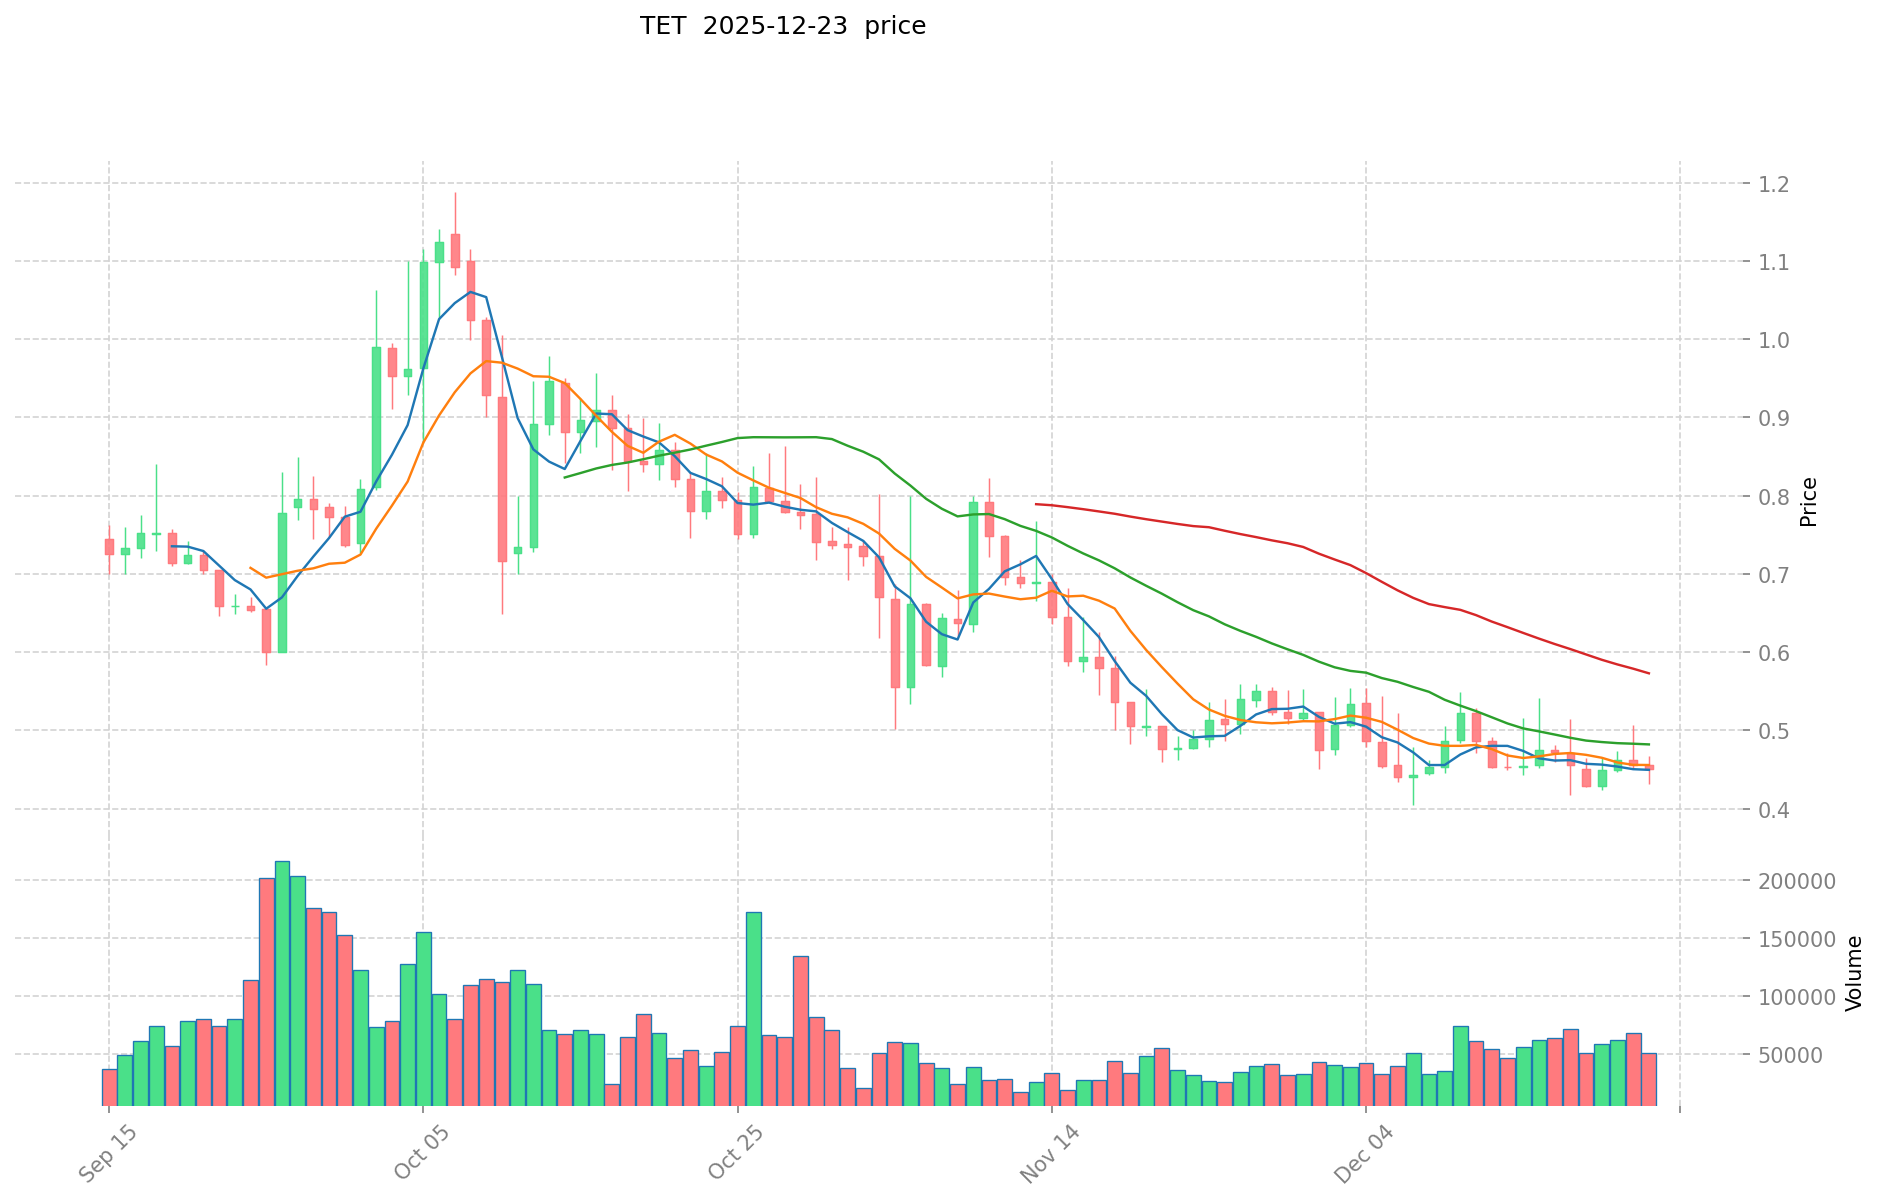
I. TET Price History Review and Current Market Status
TET Historical Price Evolution
- June 2023: Tectum (TET) was published at an initial price of $7.178, marking the beginning of its market presence.
- March 2024: TET reached its all-time high (ATH) of $39.79 on March 14, 2024, representing a significant peak in the token's valuation during its early market phase.
- 2025: The token experienced a severe downturn throughout the year. By July 4, 2025, TET hit its all-time low (ATL) of $0.3434, representing a decline of approximately 99.14% from its historical peak, reflecting significant market pressure and investor sentiment shifts.
TET Current Market Status
As of December 24, 2025, Tectum (TET) is trading at $0.4252, showing a modest recovery from its all-time low but still maintaining a position well below historical highs. The token displays the following characteristics:
Price Performance: TET has experienced a downward trajectory across multiple timeframes:
- 1-hour change: -1.05%
- 24-hour change: -5.68%
- 7-day change: -8.87%
- 30-day change: -12.21%
- 1-year change: -92.58%
Market Capitalization and Supply: With a total market capitalization of approximately $4.25 million USD and a fully diluted valuation (FDV) of $4.252 million, TET maintains a market cap-to-FDV ratio of 99.35%. The circulating supply stands at 9,934,576.14 TET tokens out of a maximum supply of 10,000,000 tokens, with a circulation ratio of 99.35%.
Trading Volume and Liquidity: The 24-hour trading volume is $25,785.73 USD, indicating relatively modest trading activity. TET is available on 6 exchanges with 14,047 token holders.
Market Position: TET ranks #1,631 in market capitalization among cryptocurrencies, with a market dominance of 0.00013%, reflecting its minor role in the broader cryptocurrency ecosystem.
Recent Trading Range: Over the past 24 hours, TET has traded between $0.4192 (low) and $0.4662 (high), maintaining a relatively tight trading range.
Click to view current TET market price
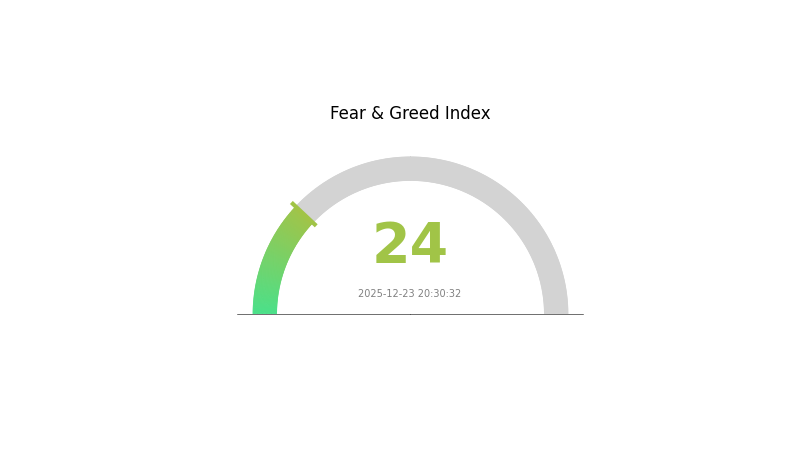
TET Market Sentiment Indicator
2025-12-23 Fear and Greed Index: 24 (Extreme Fear)
Click to view current Fear & Greed Index
The cryptocurrency market is currently experiencing extreme fear, with the Fear and Greed Index hitting 24. This indicates strong market pessimism and heightened investor anxiety. During periods of extreme fear, markets often present contrarian opportunities for long-term investors. Historical data suggests that extreme fear levels frequently precede market reversals. However, traders should exercise caution and conduct thorough due diligence before making investment decisions. Risk management remains crucial in volatile market conditions. Monitor market developments closely on Gate.com for real-time updates and analysis.
TET Holdings Distribution
The address holdings distribution represents the concentration of TET tokens across blockchain addresses, measured by the quantity and percentage of total supply held by each address. This metric serves as a critical indicator for assessing token decentralization, market structure stability, and potential manipulation risks within the TET ecosystem.
Current analysis of TET's top holders reveals a moderately concentrated distribution pattern. The top five addresses collectively control approximately 44.62% of the circulating supply, with the leading address holding 15.84% and the second-largest holder possessing 9.94%. While this concentration level is not extreme, it does warrant attention from a governance and market stability perspective. The remaining 55.38% of tokens distributed among other addresses suggests a reasonably dispersed secondary holder base, which provides some counterbalance to the concentration risk posed by major stakeholders.
The distribution structure presents both opportunities and considerations for market dynamics. The presence of significant individual holders could potentially introduce volatility if large-scale liquidation or accumulation events occur, though the existence of a substantial "Others" category (55.38%) provides market resilience. This configuration indicates that TET maintains a degree of decentralization while still containing concentration risks typical of mid-stage cryptocurrency projects. The current holder structure suggests moderate on-chain governance risk, with dominant addresses having proportional influence on protocol decisions if governance mechanisms are implemented.
For current TET holdings distribution data, visit Gate.com Crypto Market Data
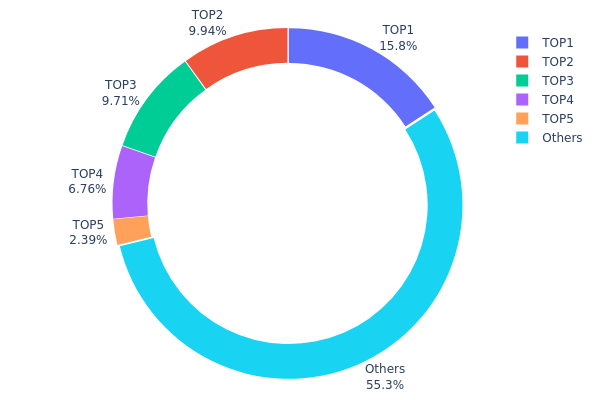
| Top | Address | Holding Qty | Holding (%) |
|---|---|---|---|
| 1 | 0x8f6b...2a672d | 1584.92K | 15.84% |
| 2 | 0x3cc9...aecf18 | 994.15K | 9.94% |
| 3 | 0x9642...2f5d4e | 971.23K | 9.71% |
| 4 | 0xefdf...b18b24 | 675.94K | 6.75% |
| 5 | 0x968f...dbb86a | 238.94K | 2.38% |
| - | Others | 5534.83K | 55.38% |
II. Core Factors Influencing TET's Future Price
Macroeconomic Environment
-
Monetary Policy Impact: Interest rate fluctuations and US Dollar Index movements significantly affect price trends. Central bank policy expectations determine market direction and investor sentiment in the cryptocurrency space.
-
Inflation Hedge Characteristics: Utility tokens like TET serve as potential value stores within inflationary environments, though their effectiveness depends on broader market adoption and regulatory acceptance.
Three、2025-2030 TET Price Forecast
2025 Outlook
- Conservative Forecast: $0.2216 - $0.4262
- Neutral Forecast: $0.4262
- Optimistic Forecast: $0.6052 (requires sustained market momentum and positive ecosystem developments)
2026-2027 Medium-term Outlook
- Market Stage Expectation: Consolidation phase with gradual recovery, characterized by increased adoption and infrastructure maturation
- Price Range Forecast:
- 2026: $0.3094 - $0.5982 (21% potential upside)
- 2027: $0.4957 - $0.6739 (30% potential upside)
- Key Catalysts: Protocol upgrades, institutional adoption acceleration, market sentiment recovery, and increased trading volume on platforms like Gate.com
2028-2030 Long-term Outlook
- Base Case: $0.5970 - $0.8185 (assumes steady growth with moderate regulatory clarity and ecosystem expansion)
- Optimistic Case: $0.6740 - $1.0564 (assumes strong institutional inflow, successful protocol implementations, and broader market recovery)
- Transformational Case: $0.8030+ (requires breakthrough technological innovations, mainstream adoption acceleration, and significant macroeconomic tailwinds)
- 2030-12-24: TET reaches $1.0564 level (78% cumulative appreciation from 2025 base, representing maturation phase completion)
| 年份 | 预测最高价 | 预测平均价格 | 预测最低价 | 涨跌幅 |
|---|---|---|---|---|
| 2025 | 0.6052 | 0.4262 | 0.22162 | 0 |
| 2026 | 0.59821 | 0.5157 | 0.30942 | 21 |
| 2027 | 0.67392 | 0.55696 | 0.49569 | 30 |
| 2028 | 0.81853 | 0.61544 | 0.59698 | 44 |
| 2029 | 0.80302 | 0.71699 | 0.67397 | 68 |
| 2030 | 1.05641 | 0.76001 | 0.6688 | 78 |
Tectum (TET) Professional Investment Strategy and Risk Management Report
IV. TET Professional Investment Strategy and Risk Management
TET Investment Methodology
(1) Long-Term Holding Strategy
- Target Investors: Crypto enthusiasts seeking Layer 2 scaling solutions and Bitcoin payment infrastructure believers
- Operational Recommendations:
- Accumulate TET during market downturns, leveraging the current -92.58% year-over-year decline as a potential entry point for long-term conviction holders
- Hold through technology development cycles and SoftNote™ adoption phases, focusing on fundamental blockchain improvements rather than short-term price volatility
- Implement dollar-cost averaging (DCA) to reduce timing risk, particularly given the asset's price sensitivity and market volatility
(2) Active Trading Strategy
- Technical Analysis Tools:
- Support and Resistance Levels: Monitor the historical low of $0.3434 (July 2025) as a critical support level and previous peaks around $39.79 (March 2024) to identify potential resistance zones
- Volume Analysis: Track the 24-hour trading volume of $25,785.73 as a baseline; significant deviations may signal market sentiment shifts or institutional activity
- Wave Trading Key Points:
- Capitalize on the current 24-hour decline of -5.68% by identifying potential bounce opportunities when momentum indicators show oversold conditions
- Execute position exits during recovery phases, particularly around consolidation levels between $0.42-$0.47 based on recent price action
TET Risk Management Framework
(1) Asset Allocation Principles
- Conservative Investors: 1-2% of total crypto portfolio allocation
- Active Investors: 3-5% of total crypto portfolio allocation
- Professional Investors: 5-8% of total crypto portfolio allocation, with structured position sizing based on risk parameters
(2) Risk Hedging Solutions
- Portfolio Diversification: Balance TET exposure with established Layer 1 cryptocurrencies and stablecoins to mitigate concentration risk
- Stop-Loss Implementation: Establish predetermined exit levels at 15-20% below entry prices to limit downside exposure in volatile market conditions
(3) Secure Storage Solutions
- Hot Wallet Solution: Gate.com Web3 Wallet provides custodial flexibility for active traders requiring frequent access and transaction capability
- Cold Storage Approach: For long-term holders, transfer TET tokens to hardware-secured wallets for enhanced security against digital threats
- Security Considerations: Enable two-factor authentication on all exchange accounts, never share private keys, verify smart contract addresses before token transfers, and maintain regular backups of wallet recovery phrases
V. TET Potential Risks and Challenges
TET Market Risk
- Extreme Price Volatility: TET has experienced a devastating -92.58% decline over the past year, indicating severe price instability and potential continued downside pressure despite recent modest recovery attempts
- Low Trading Liquidity: With only 24-hour trading volume of $25,785.73 against a market cap of $4.25 million, the token exhibits limited liquidity that could amplify slippage during larger trades
- Market Capitalization Concentration: The $4.25 million market cap represents less than 0.001% of total crypto market dominance, classifying TET as a micro-cap asset with elevated speculative risk
TET Regulatory Risk
- Evolving Cryptocurrency Frameworks: Changes in global regulatory approaches to Layer 2 solutions, Bitcoin scaling, and decentralized payment systems could impact TET's utility and adoption trajectory
- Compliance Requirements: Different jurisdictions may impose varying regulatory requirements on decentralized payment solutions like SoftNote™, affecting operational flexibility
TET Technology Risk
- Layer 2 Solution Competition: Rapid development of alternative Bitcoin and crypto Layer 2 scaling solutions presents competitive pressure to TET's market positioning and technological relevance
- Blockchain Speed Claims: The claimed transaction throughput of 1.3 million TPS requires independent technical verification and real-world stress testing to validate production viability
- Smart Contract Vulnerability: As an ERC-20 token deployed on Ethereum, TET faces inherent smart contract risks common to all Layer 1 deployed protocols
VI. Conclusion and Action Recommendations
TET Investment Value Assessment
Tectum presents a highly speculative investment opportunity targeting the Layer 2 Bitcoin scaling and decentralized payment infrastructure sector. While the project's core value proposition—offering instant, trustless, and anonymous cryptocurrency payments through SoftNote™—addresses genuine market needs, the token's fundamental challenge lies in achieving mainstream adoption and demonstrating technological superiority over competing solutions. The catastrophic -92.58% annual decline warrants extreme caution, suggesting either severe market skepticism regarding the technology or inadequate adoption metrics. Potential investors should approach TET as a venture-stage crypto asset requiring substantial risk tolerance and a multi-year investment horizon.
TET Investment Recommendations
✅ Beginners: Avoid direct TET exposure until demonstrating proficiency with established cryptocurrencies; if interested, allocate only 0.5-1% of total crypto portfolio through dollar-cost averaging over extended periods via Gate.com
✅ Experienced Investors: Consider TET as a speculative satellite position (3-5% allocation) only if you possess deep understanding of Layer 2 technology and can withstand potential 50%+ drawdowns; implement strict stop-loss discipline and regular fundamental reassessment
✅ Institutional Investors: Conduct comprehensive due diligence on SoftNote™ adoption metrics, CrispMind's development team credentials, and competitive positioning before considering allocations; monitor technology milestones and real-world transaction volumes as key performance indicators
TET Trading Participation Methods
- Gate.com Spot Trading: Execute buy/sell orders directly through Gate.com's spot market interface for immediate position establishment with standard trading fees
- Dollar-Cost Averaging Programs: Utilize automated purchasing schedules through Gate.com to systematically accumulate TET at regular intervals, reducing timing risk
- Limit Order Strategies: Deploy limit orders at predetermined price targets to capture entries during volatility spikes while maintaining disciplined execution protocols
Cryptocurrency investing carries extreme risk. This report does not constitute investment advice. All investors must conduct independent research and assess their personal risk tolerance before making investment decisions. Consult professional financial advisors before committing capital. Never invest funds you cannot afford to lose entirely.
FAQ
Is tectum crypto a good investment today?
Tectum faces current bearish trends with price predictions indicating further decline. Market conditions suggest caution, though long-term potential depends on project developments and market recovery.
What is the price prediction for TET token in 2025?
Based on current market analysis, TET is predicted to reach approximately $0.4440 by the end of 2025. This forecast reflects ongoing market trends and technical indicators for Tectum Token.
What are the main factors that could affect TET price in the future?
TET price could be affected by market demand, cryptocurrency market trends, regulatory developments, trading volume, and investor sentiment. Growth potential and ecosystem adoption are also key drivers.
How does Tectum compare to other similar blockchain projects in terms of growth potential?
Tectum demonstrates strong growth potential through its innovative Layer 2 Bitcoin solution and exceptional speed capabilities. With a market valuation of approximately US$100 million, it trades at a significant discount compared to similar blockchain projects, presenting substantial upside potential for early adopters.
Share
Content
Introduction: TET's Market Position and Investment Value
I. TET Price History Review and Current Market Status
II. Core Factors Influencing TET's Future Price
Three、2025-2030 TET Price Forecast
IV. TET Professional Investment Strategy and Risk Management
V. TET Potential Risks and Challenges
VI. Conclusion and Action Recommendations
FAQ
How to Buy Cryptocurrency


Trending Cryptocurrencies


How Can On-Chain Data Analysis Predict Crypto Market Trends in 2025?
How Do Cryptocurrency Competitors Compare: Market Cap, Performance, and User Base Analysis in 2026?

What is the Current Market Overview for Merlin Chain (MERL) in 2025?
How Do Leading Cryptocurrencies Compare in 2025: Market Share, Performance, and Key Differences
How Does Cryptocurrency Competitive Landscape Compare in 2025: Market Share, Performance, and Key Advantages

How does SUI price volatility compare to Bitcoin and Ethereum in 2026?
Satoshi Mining
Understanding Bitcoin Dominance (BTC.D): An In-Depth Analysis of the Metric and Its Influence on the Cryptocurrency Market
Crypto Heatmap

What is GCOIN: A Comprehensive Guide to Understanding the Next Generation of Digital Currency
What is ZAP: A Comprehensive Guide to Zero-Day Attack Prevention Tools and Security Testing Methodologies