2025 TRU Price Prediction: Expert Analysis and Market Forecast for the Coming Year
Introduction: Market Position and Investment Value of TRU
TrueFi (TRU) is an unsecured lending DeFi protocol launched by TrustToken, representing an innovative approach to decentralized finance since its inception in 2018. As of 2025, TRU has achieved a market capitalization of approximately $11.69 million, with circulating supply of around 1.37 billion tokens, currently trading at $0.008442. This decentralized lending solution continues to play an important role in the DeFi ecosystem.
This article will provide a comprehensive analysis of TRU's price trends from 2025 to 2030, integrating historical patterns, market supply and demand dynamics, ecosystem development, and macroeconomic factors to deliver professional price forecasts and practical investment strategies for investors.
TRU Market Analysis Report
I. TRU Price History Review and Current Market Status
TRU Historical Price Evolution Trajectory
-
2021: Project launch and early growth phase, TRU reached its all-time high (ATH) of $1.017 on August 12, 2021, marking the peak of market enthusiasm for the unsecured lending DeFi protocol.
-
2021-2025: Extended bear market phase, price experienced significant decline from the historical high of $1.017 to the current level, reflecting the broader cryptocurrency market downturn and challenges faced by DeFi lending protocols.
-
December 19, 2025: TRU touched its all-time low (ATL) of $0.00789887, representing a cumulative decline of approximately 90.75% over the past year.
TRU Current Market Situation
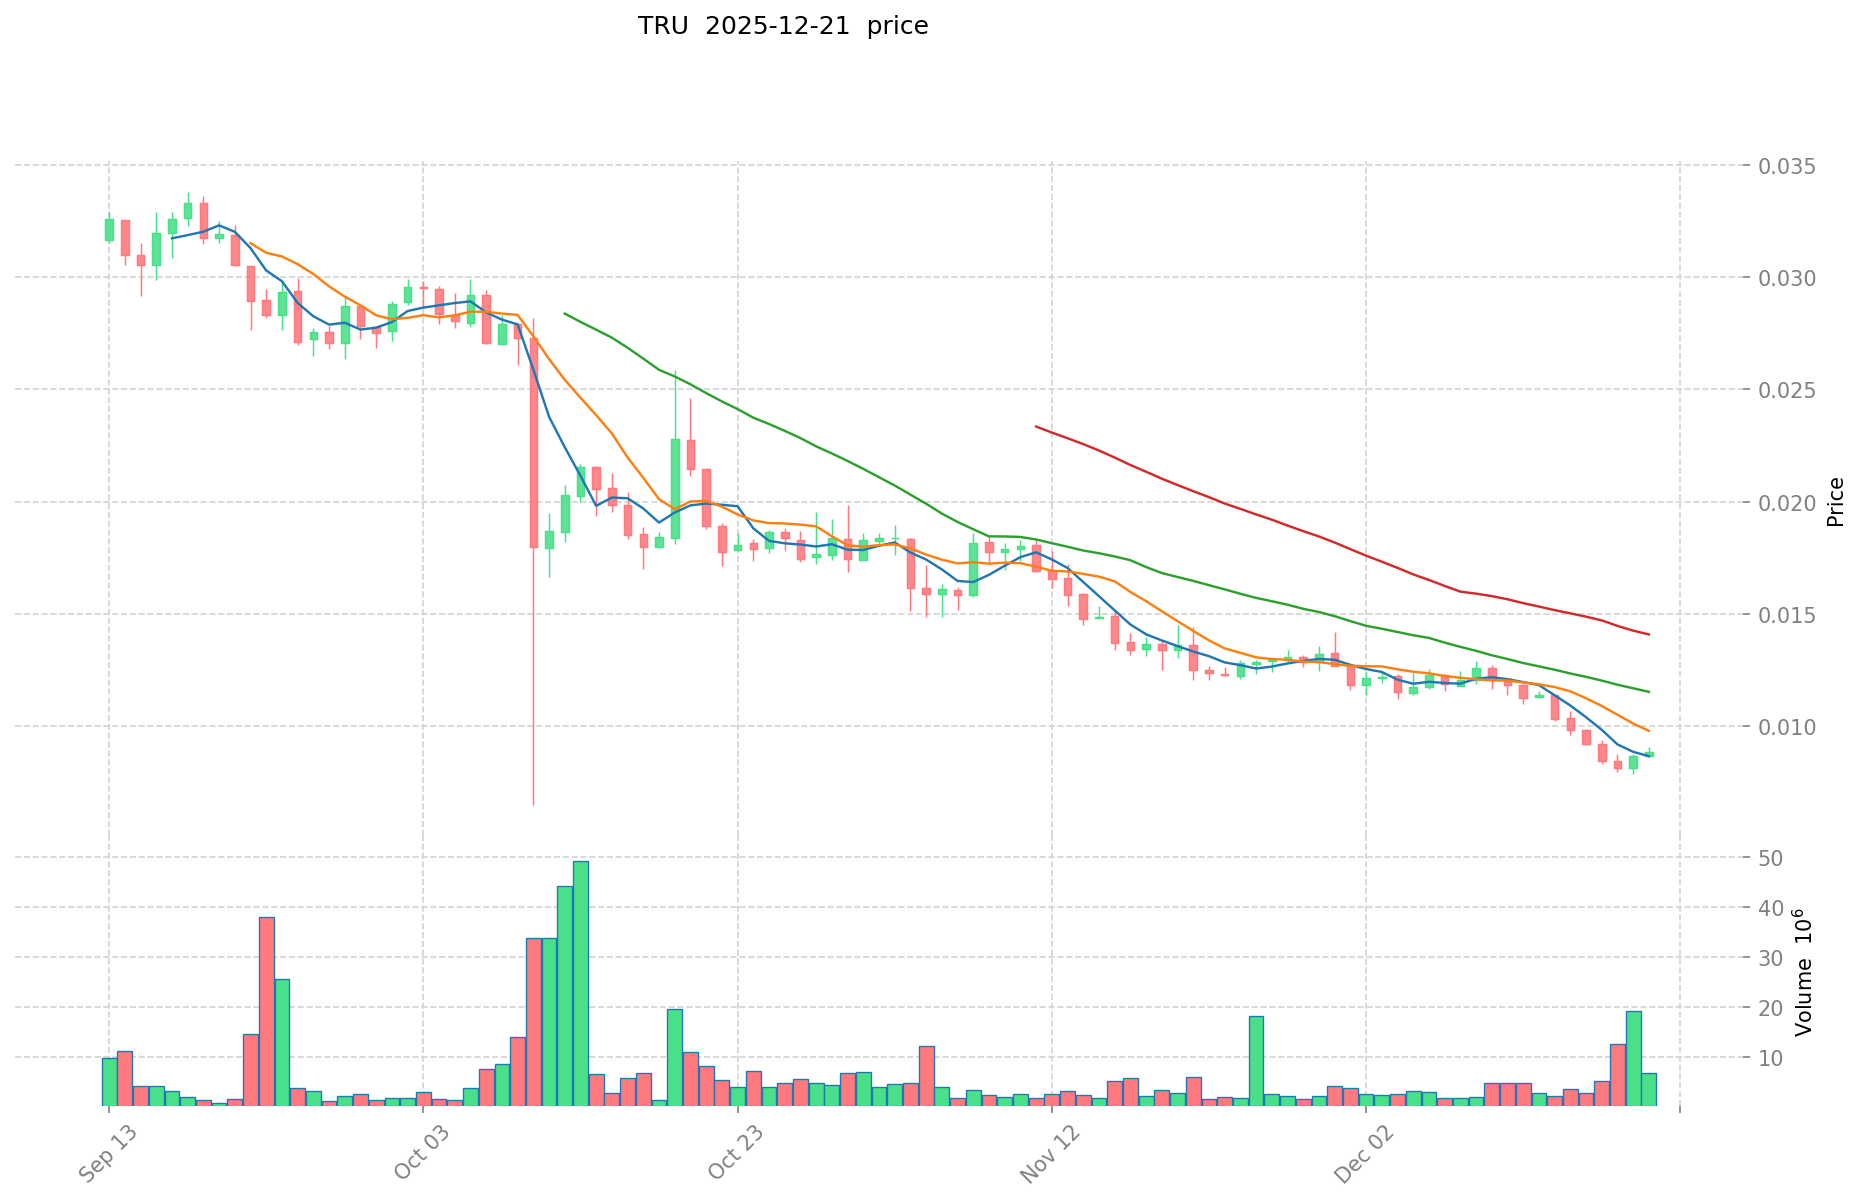
As of December 21, 2025, TRU is trading at $0.008442, with a 24-hour trading volume of $70,288.90. The token is experiencing short-term downward pressure, declining 1.04% in the past hour and 4.79% over the last 24 hours. Weekly performance shows a more pronounced decline of 22.18% over the past 7 days, while the 30-day performance indicates a 32.46% decrease.
The current market capitalization stands at $11.57 million, with a fully diluted valuation (FDV) of $11.69 million. The circulating supply comprises 1,370,406,688.35 TRU tokens out of a total supply of 1,385,068,622.20 tokens and a maximum supply cap of 1,450,000,000 tokens, representing a circulation ratio of approximately 94.51%.
TRU maintains listings across 20 exchanges globally. The token is held by 13,022 unique addresses, indicating a distributed holder base. Current market sentiment reflects "Extreme Fear" (VIX score: 20), suggesting heightened market volatility and risk aversion among investors.
The 24-hour price range shows TRU trading between a high of $0.008942 and a low of $0.008333, with the token down from its launch price of $0.12, representing a significant depreciation from its initial valuation.
Click to view current TRU market price
TRU 市场情绪指标
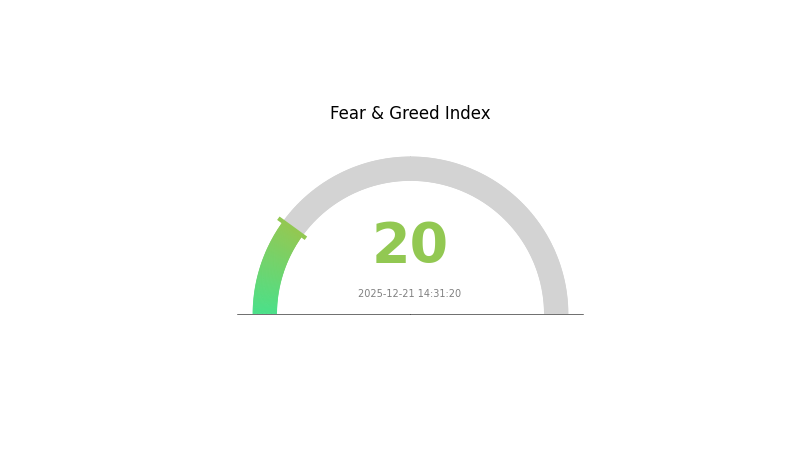
2025-12-21 恐惧与贪婪指数:20(Extreme Fear)
Click to view the current Fear & Greed Index
The cryptocurrency market is experiencing extreme fear, with the Fear and Greed Index at 20, indicating significant investor anxiety. This reading suggests heightened market uncertainty and risk aversion among traders. Such extreme fear often presents contrarian opportunities for long-term investors, as panic selling may have pushed prices below intrinsic values. However, caution remains warranted until market sentiment stabilizes. Monitor key support levels and maintain disciplined risk management strategies during this volatile period on Gate.com.
TRU Holdings Distribution
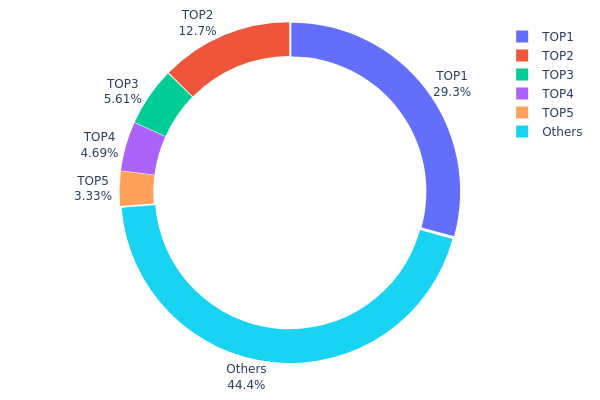
The address holdings distribution map illustrates how TRU tokens are allocated across different wallet addresses on the blockchain. This metric serves as a critical indicator for assessing token concentration, market structure stability, and the degree of decentralization within the TRU ecosystem. By analyzing the distribution patterns, investors and analysts can identify potential risks associated with wealth concentration and evaluate the token's vulnerability to large-scale sell-offs or coordinated market manipulation.
Current data reveals a moderate concentration risk in TRU's holder landscape. The top five addresses collectively hold 55.54% of all circulating tokens, with the leading address (0xf977...41acec) commanding 29.28% of the total supply. This concentration level suggests that a significant portion of TRU's liquidity remains concentrated in a relatively small number of entities, though the presence of substantial "Others" category holdings at 44.46% indicates that token ownership is not entirely centralized among a handful of whales. The second-largest holder controls 12.65%, followed by progressively smaller positions, creating a gradual distribution curve rather than an extreme concentration pattern.
This distribution structure presents notable implications for market dynamics. While the top holder's 29.28% stake represents a substantial influence over potential price movements and governance decisions, the relatively distributed nature of the remaining holdings provides some resilience against sudden market shocks. However, coordinated action among the top five addresses could theoretically facilitate significant market moves, warranting continued monitoring of these key holders' on-chain activities and transaction patterns.
View current TRU holdings distribution
| Top | Address | Holding Qty | Holding (%) |
|---|---|---|---|
| 1 | 0xf977...41acec | 405578.50K | 29.28% |
| 2 | 0xa269...d7e7ff | 175340.40K | 12.65% |
| 3 | 0xa1a7...7badcc | 77757.21K | 5.61% |
| 4 | 0x5a52...70efcb | 64940.65K | 4.68% |
| 5 | 0x2369...8ee424 | 46072.56K | 3.32% |
| - | Others | 615379.30K | 44.46% |
Core Factors Influencing TRU's Future Price
Supply Mechanism
-
Maximum Supply Limit: TRU has a maximum issuance cap set through code, establishing a fixed upper bound on total token supply.
-
Circulating Supply: The number of TRU tokens in circulation is influenced by both development team decisions and market dynamics, affecting price pressure and availability in the market.
Macroeconomic Environment
-
Market Sentiment and Investor Behavior: TRU's price is significantly impacted by overall market dynamics and investor sentiment, which fluctuate based on broader cryptocurrency market conditions.
-
Policy and Regulatory Changes: Investors need to monitor regulatory developments and policy changes that could affect the cryptocurrency market and DeFi sector adoption.
Technology Development and Ecosystem
-
DeFi Market Adoption: As the decentralized finance sector continues to grow and gain mainstream acceptance, TRU's demand will be directly influenced by overall DeFi market trends and the expanding user base engaging with decentralized financial services.
-
Early Ecosystem Development: TRU demonstrates significant price volatility due to its early-stage ecosystem development, which presents both growth opportunities and inherent risks as the project matures.
III. TRU Price Forecast 2025-2030
2025 Outlook
- Conservative Forecast: $0.00682 - $0.00842
- Base Case Forecast: $0.00842
- Optimistic Forecast: $0.0112 (requires sustained market recovery and positive regulatory developments)
2026-2028 Medium-term Outlook
- Market Stage Expectation: Gradual recovery phase with consolidation patterns, characterized by incremental growth and increasing market participation as confidence rebuilds across the sector.
- Price Range Predictions:
- 2026: $0.00873 - $0.0104 (16% upside potential)
- 2027: $0.00617 - $0.01233 (19% upside potential)
- 2028: $0.00886 - $0.01447 (32% upside potential)
- Key Catalysts: Institutional adoption acceleration, protocol upgrades and technological improvements, expanding ecosystem partnerships, favorable macroeconomic conditions, and increasing DeFi protocol utility recognition.
2029-2030 Long-term Outlook
- Base Case Scenario: $0.01272 - $0.01587 (assumes steady adoption, consistent tokenomics management, and moderate market expansion)
- Optimistic Scenario: $0.01452 - $0.01587 (assumes accelerated enterprise adoption, significant protocol innovation milestones, and broader cryptocurrency market maturation)
- Transformational Scenario: $0.01587+ (requires breakthrough use case adoption, major institutional inflows, regulatory clarity leading to mainstream integration, and substantial improvements in transaction efficiency)
- 2030-12-31: TRU reaches $0.01587 (62% cumulative gain from current baseline, reflecting steady multi-year institutional adoption trajectory)
| 年份 | 预测最高价 | 预测平均价格 | 预测最低价 | 涨跌幅 |
|---|---|---|---|---|
| 2025 | 0.0112 | 0.00842 | 0.00682 | 0 |
| 2026 | 0.0104 | 0.00981 | 0.00873 | 16 |
| 2027 | 0.01233 | 0.01011 | 0.00617 | 19 |
| 2028 | 0.01447 | 0.01122 | 0.00886 | 32 |
| 2029 | 0.01452 | 0.01285 | 0.00848 | 52 |
| 2030 | 0.01587 | 0.01368 | 0.01272 | 62 |
TRU Investment Strategy and Risk Management Report
IV. TRU Professional Investment Strategy and Risk Management
TRU Investment Methodology
(1) Long-term Holding Strategy
- Suitable for: DeFi protocol believers and risk-tolerant investors seeking exposure to unsecured lending mechanisms
- Operational suggestions:
- Accumulate TRU during market downturns, given the token's current 90.75% decline over one year
- Dollar-cost averaging to mitigate volatility risks across different market cycles
- Regular portfolio rebalancing based on your risk tolerance and market conditions
(2) Active Trading Strategy
- Technical analysis considerations:
- Price momentum indicators: Monitor the 24-hour change of -4.79% and 7-day decline of -22.18% to identify potential reversal points
- Volume analysis: Current 24-hour trading volume of $70,288.90 reflects relatively low liquidity; trade accordingly with caution
- Wave trading key points:
- Entry considerations: Establish positions near the all-time low of $0.00789887 (reached December 19, 2025)
- Exit strategy: Set profit targets at resistance levels near the 24-hour high of $0.008942
TRU Risk Management Framework
(1) Asset Allocation Principles
- Conservative investors: 0-2% of total portfolio
- Active investors: 2-5% of total portfolio
- Professional investors: 5-10% of total portfolio
(2) Risk Hedging Solutions
- Portfolio diversification: Balance TRU holdings with stablecoins and established cryptocurrencies to reduce concentration risk
- Position sizing: Limit individual trades to 1-2% of total capital given the extreme 90.75% annual depreciation
(3) Secure Storage Solutions
- Hot wallet option: Gate.com Web3 Wallet for frequent trading and easy access
- Cold storage approach: For long-term holdings exceeding 6 months, utilize hardware-based storage solutions with multi-signature capabilities
- Security considerations: Never share private keys, enable two-factor authentication, use reputable wallet providers, and maintain regular backups
V. TRU Potential Risks and Challenges
TRU Market Risks
- Extreme price volatility: TRU has declined 90.75% over the past year with only 13,022 token holders, indicating concentrated ownership and liquidity concerns
- Low trading liquidity: Daily trading volume of approximately $70,288 is relatively thin for a token with $11.69 million market capitalization
- Market sentiment deterioration: The token reached its all-time low of $0.00789887 on December 19, 2025, suggesting continued downward pressure
TRU Regulatory Risks
- DeFi regulatory uncertainty: Unsecured lending protocols face increasing scrutiny from financial regulators worldwide regarding investor protections
- Compliance challenges: TrustToken may encounter regulatory requirements for lending protocols that could impact TRU token utility
- Jurisdiction-specific restrictions: Certain countries may impose limitations on trading or using DeFi protocols like TrueFi
TRU Technical Risks
- Smart contract vulnerabilities: Unsecured lending mechanisms depend on robust code audits; any discovered vulnerabilities could impact token value
- Protocol adoption risk: Limited adoption of TrueFi protocol relative to competing DeFi lending platforms affects long-term sustainability
- Technological obsolescence: DeFi landscape evolves rapidly; TrueFi may face competition from newer, more efficient lending solutions
VI. Conclusion and Action Recommendations
TRU Investment Value Assessment
TRU represents a high-risk, speculative investment in the DeFi lending sector. The token's 90.75% annual decline, limited liquidity, and small holder base suggest significant market skepticism regarding the TrueFi protocol's long-term viability. Current price levels near all-time lows may indicate either a value opportunity for contrarian investors or continued weakness ahead. The $11.69 million market capitalization and thin trading volume create substantial liquidity constraints for meaningful positions.
TRU Investment Recommendations
✅ Beginners: Avoid or limit exposure to no more than 0.5% of portfolio; focus on learning the risks of DeFi lending protocols before participating
✅ Experienced investors: Consider small exploratory positions (1-3% of crypto allocation) only if you thoroughly understand unsecured lending risks and can afford total loss
✅ Institutional investors: Conduct extensive due diligence on TrustToken's governance, smart contract audits, and competitive positioning before any allocation decision
TRU Trading Participation Methods
- Spot trading on Gate.com: Purchase and hold TRU directly for long-term exposure
- Technical analysis trading: Utilize Gate.com's trading tools for short-term price movements around identified support and resistance levels
- Dollar-cost averaging: Gradually accumulate positions over time to reduce timing risk and average entry prices
Cryptocurrency investment carries extreme risk. This report does not constitute investment advice. Investors should make decisions based on personal risk tolerance and consult professional financial advisors. Never invest funds you cannot afford to lose entirely. The DeFi sector involves additional smart contract and protocol-specific risks beyond typical cryptocurrency exposure.
FAQ
Is TRU a good investment?
TRU shows strong growth potential with attractive valuation metrics for growth investors. Its B Momentum Score indicates appeal to momentum investors. Overall, TRU presents a solid investment opportunity for those seeking growth exposure.
What factors influence TRU token price movements?
TRU token price is primarily influenced by market liquidity, trading volume, investor sentiment, and news developments. Low liquidity can amplify volatility, while increased demand and positive market conditions typically drive price appreciation.
What is the price history and market cap of TRU?
TRU's market cap is $16.78 billion as of 2025-12-21. The token has shown fluctuating price movements since 2015, with periodic variations reflecting market dynamics and investor sentiment shifts throughout the years.
What is TRU token used for and what is its utility?
TRU is the utility token of TrueFi, enabling staking with attractive rewards, governance voting on protocol decisions, and protecting lenders against loan defaults in decentralized finance.
Share
Content
Introduction: Market Position and Investment Value of TRU
I. TRU Price History Review and Current Market Status
Core Factors Influencing TRU's Future Price
III. TRU Price Forecast 2025-2030
IV. TRU Professional Investment Strategy and Risk Management
V. TRU Potential Risks and Challenges
VI. Conclusion and Action Recommendations
FAQ
How to Buy Cryptocurrency


Trending Cryptocurrencies


Avalanche (AVAX) 2025 Price Analysis and Market Trends

SEI Staking Analysis: 60-70% Supply Locked and Its Price Impact

Latest Analysis and Investment Outlook for Chainlink Price in June 2025

FTT Explained

next crypto to hit $1 in 2025
2025 PUMP Price Prediction: Analyzing Market Trends and Growth Potential for Cryptocurrency Investors
Satoshi Mining
Understanding Bitcoin Dominance (BTC.D): An In-Depth Analysis of the Metric and Its Influence on the Cryptocurrency Market
Crypto Heatmap

What is GCOIN: A Comprehensive Guide to Understanding the Next Generation of Digital Currency

What is ZAP: A Comprehensive Guide to Zero-Day Attack Prevention Tools and Security Testing Methodologies