GHX vs ARB: A Comprehensive Comparison of Two Leading Healthcare Data Exchange Platforms
Introduction: GHX vs ARB Investment Comparison
In the cryptocurrency market, the comparison between GamerCoin (GHX) and Arbitrum (ARB) has always been a topic investors cannot avoid. The two not only show significant differences in market cap ranking, application scenarios, and price performance, but also represent different positioning of crypto assets. GamerCoin (GHX): Since its launch in 2020, it has gained market recognition by enabling over 770,000 gamers to monetize their idle CPU/GPU power through the GamerHash ecosystem, supporting AI (DePIN), 3D rendering, and crypto mining. Arbitrum (ARB): Since its inception, it has been recognized as a technology suite designed to scale Ethereum, allowing users to conduct transactions on Arbitrum chains at lower costs and faster speeds while inheriting Ethereum-level security. This article will comprehensively analyze the investment value comparison between GHX and ARB from multiple dimensions including historical price trends, supply mechanisms, market adoption, and technical ecosystems, attempting to answer the question investors care most about:
"Which is the better buy right now?"
Comparative Analysis Report: GamerCoin (GHX) vs Arbitrum (ARB)
I. Price History Comparison and Current Market Status
GHX and ARB Historical Price Trends
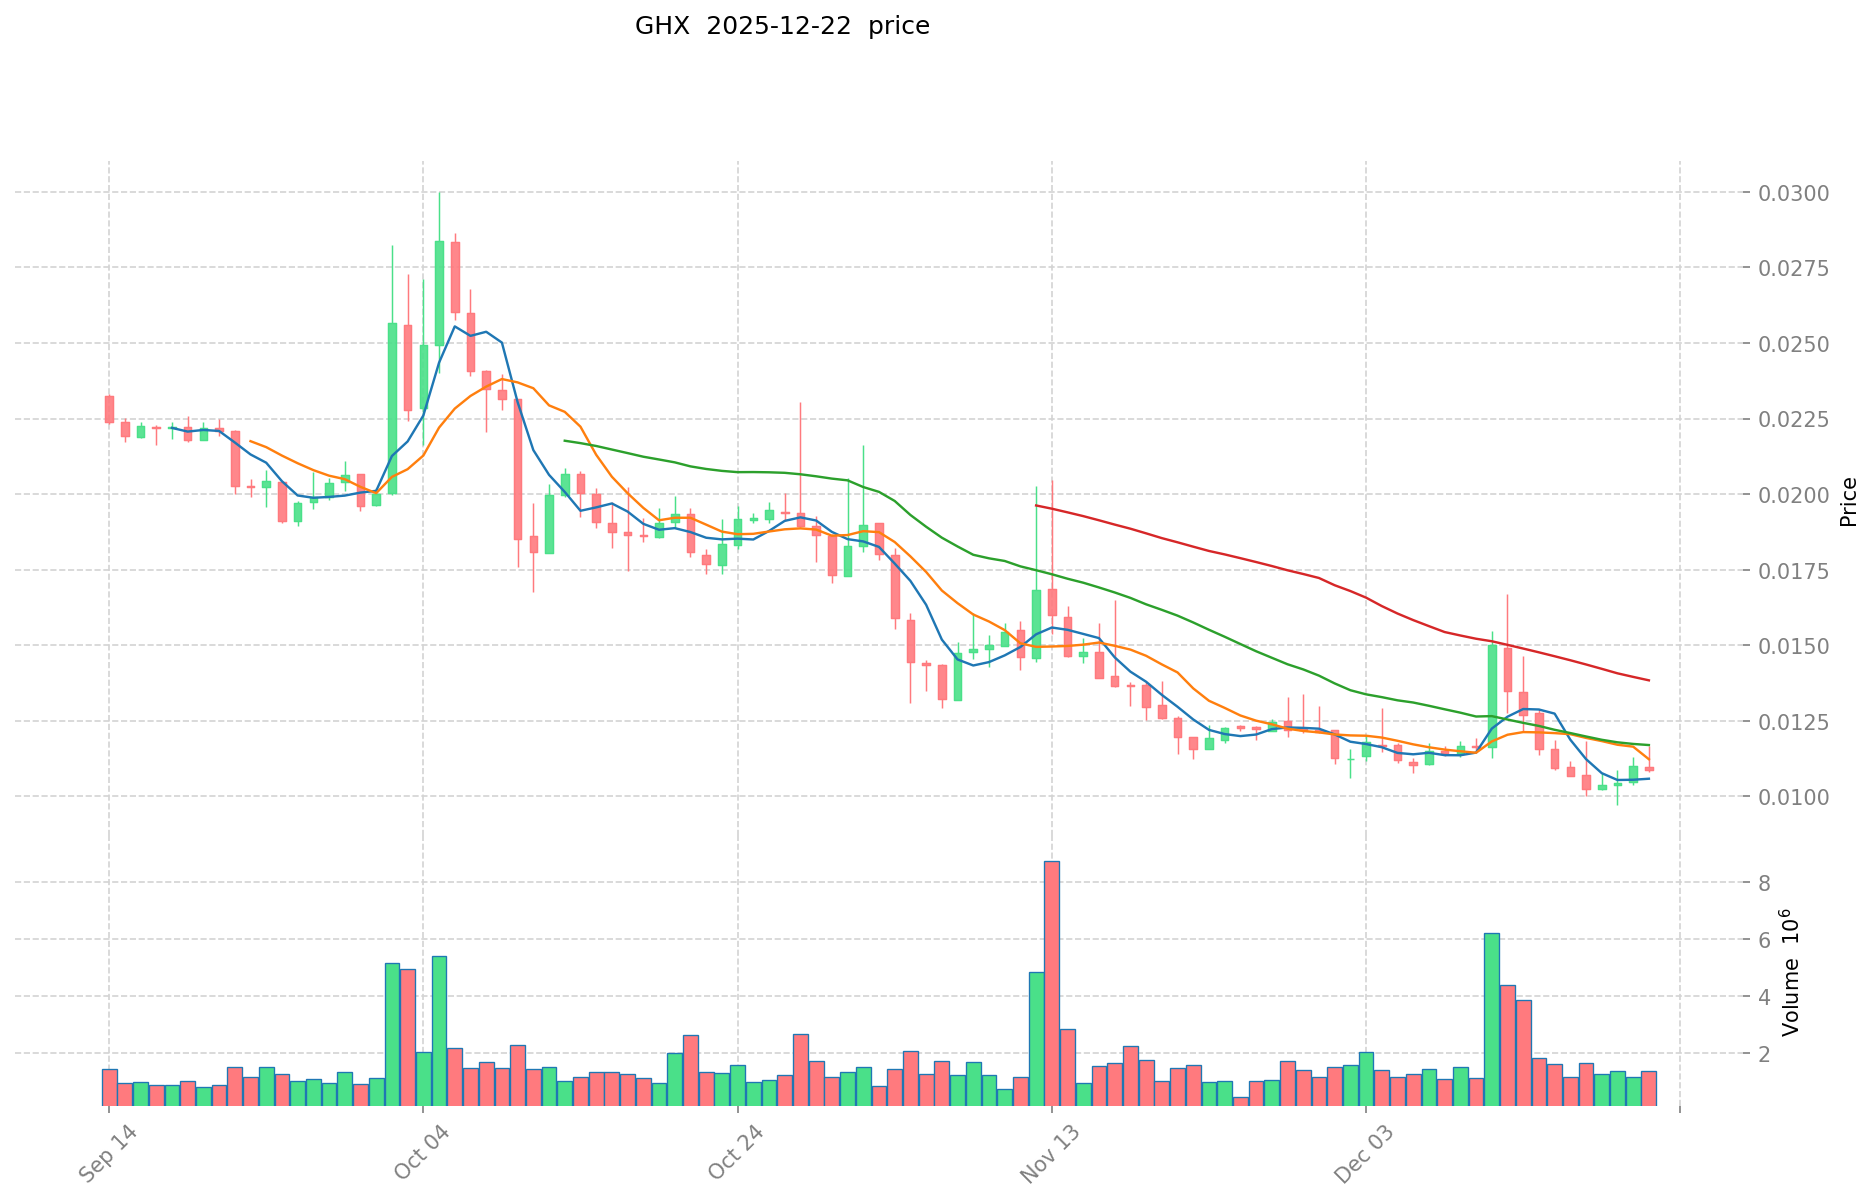
GamerCoin (GHX) Price Performance:
- All-time high (ATH): $0.17911 (May 23, 2024)
- All-time low (ATL): $0.0097 (December 19, 2025)
- Year-to-date performance: -84.99%
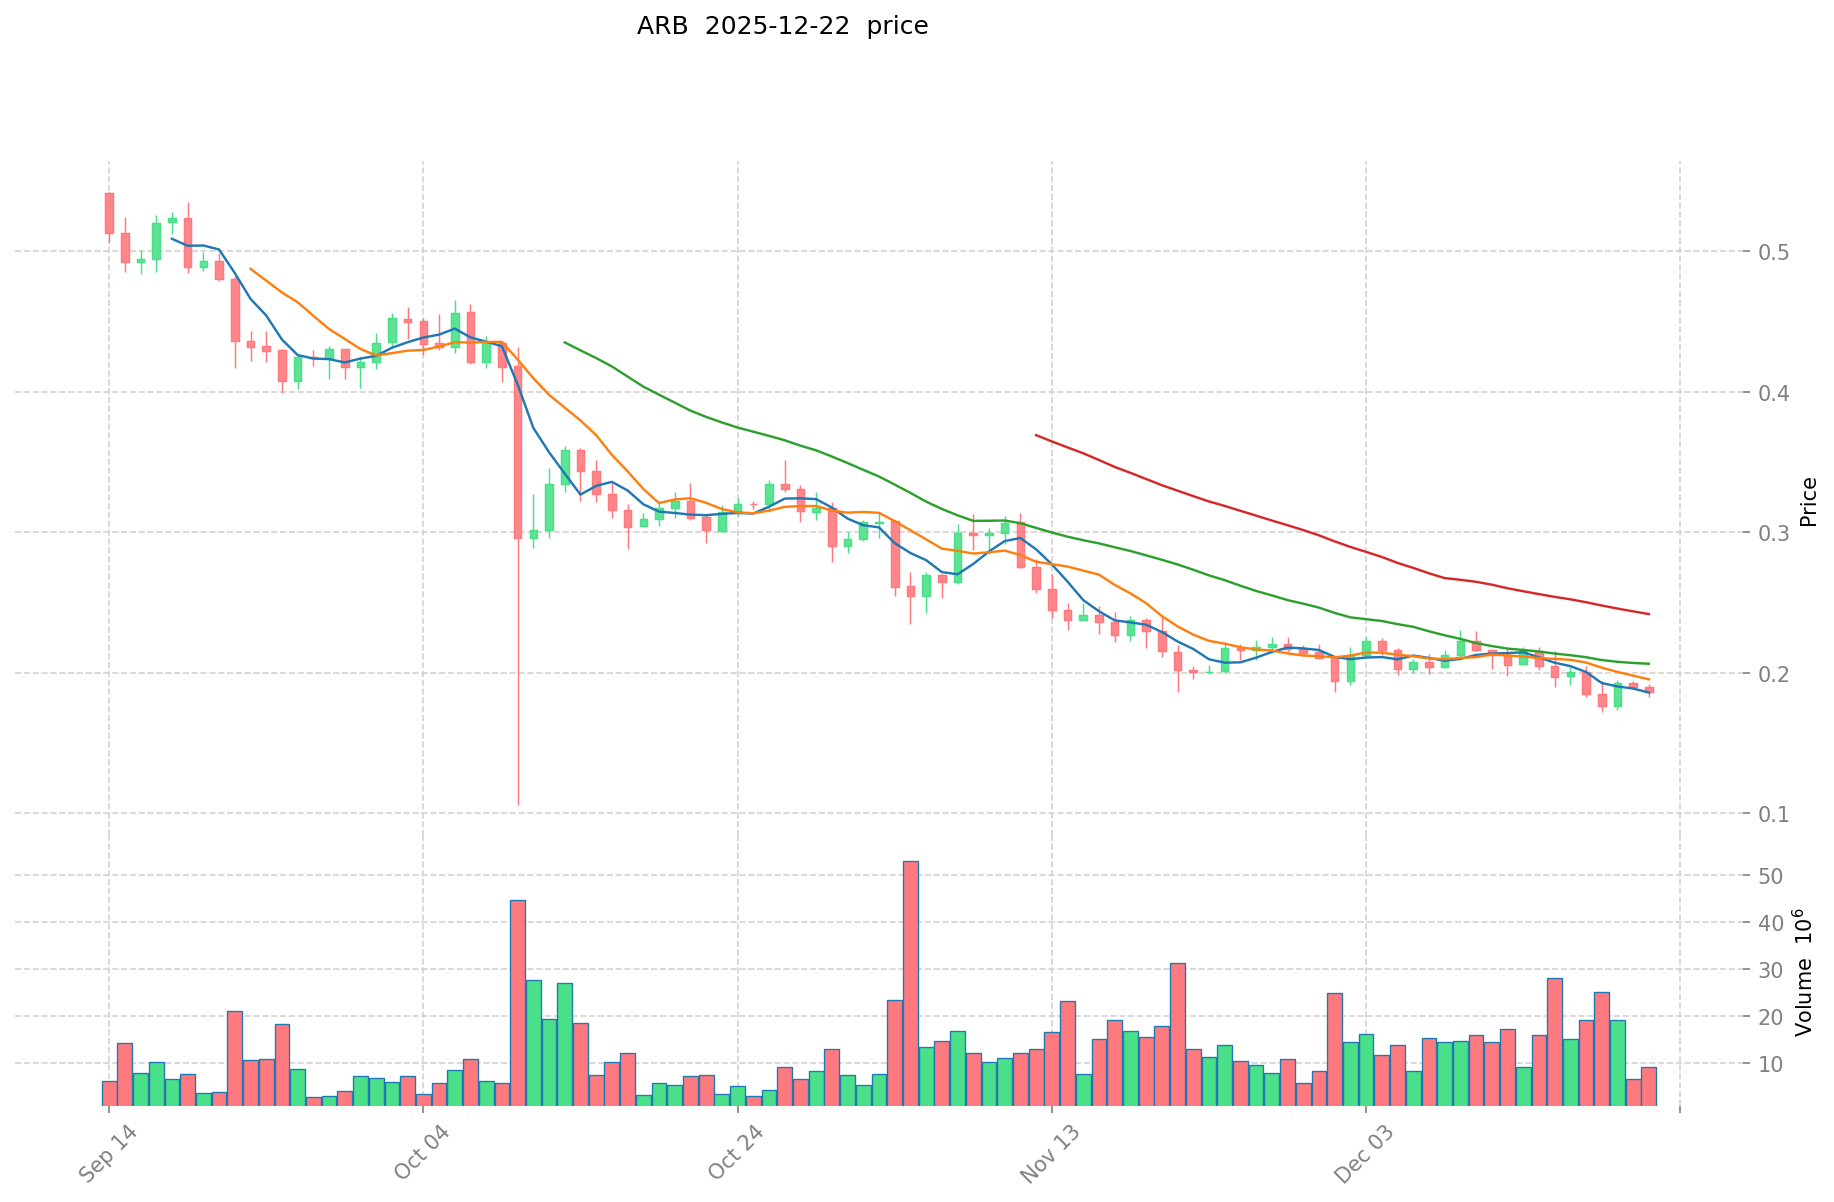
Arbitrum (ARB) Price Performance:
- All-time high (ATH): $2.39 (January 12, 2024)
- All-time low (ATL): $0.172637 (December 19, 2025)
- Year-to-date performance: -74.59%
Comparative Analysis: Both tokens have experienced significant price declines throughout 2025, with GHX showing more severe depreciation (-84.99%) compared to ARB (-74.59%). GHX reached its ATL more recently (December 19, 2025), while ARB has maintained relatively better price stability despite similar market pressures. The gap between their peak-to-current performance reflects different market dynamics and investor sentiment toward each project.
Current Market Status (December 22, 2025)
GamerCoin (GHX):
- Current price: $0.01113
- Market capitalization: $8,993,040
- Circulating supply: 702,820,490 GHX
- Total supply: 808,000,000 GHX
- 24-hour trading volume: $13,846.7043122
Arbitrum (ARB):
- Current price: $0.1903
- Market capitalization: $1,903,000,000
- Circulating supply: 5,719,286,371 ARB
- Total supply: 10,000,000,000 ARB
- 24-hour trading volume: $2,430,137.000234
Market Emotion Index (Fear & Greed Index): 25 - Extreme Fear
View Real-Time Prices:
- GamerCoin (GHX): Market Price
- Arbitrum (ARB): Market Price
II. Price Movement Analysis (Recent Period)
24-Hour Price Changes
| Time Frame | GHX | ARB |
|---|---|---|
| 1 hour | +1.73% | -0.37% |
| 24 hours | +3.11% | +3.81% |
| 7 days | -3.86% | -9.95% |
| 30 days | -1.06% | -3.1% |
| 1 year | -84.99% | -74.59% |
Key Observations:
- Both tokens showed modest positive movement in the 24-hour period (+3.11% for GHX, +3.81% for ARB)
- Seven-day performance reveals divergence, with ARB experiencing steeper losses (-9.95%) compared to GHX (-3.86%)
- Long-term trends demonstrate severe depreciation for both assets over the past year
Market Price Ranges (24-Hour)
GHX:
- High: $0.01166
- Low: $0.0108
- Trading range: $0.0066
ARB:
- High: $0.1931
- Low: $0.1829
- Trading range: $0.0102
III. Market Fundamentals and Project Overview
GamerCoin (GHX) Ecosystem
GamerCoin powers the GamerHash ecosystem, enabling over 770,000 gamers to monetize idle CPU/GPU computing power through shared resources for:
- Artificial Intelligence (DePIN)
- 3D rendering services
- Cryptocurrency mining
Project Characteristics:
- Established GameFi token since 2020
- Token standard: ERC-20
- Market rank: 1,307
- Circulating supply ratio: 79.87%
- Total holders: 11,333
- Exchange listings: 5 exchanges
Arbitrum (ARB) Protocol
Arbitrum functions as a Layer 2 scaling solution designed to address Ethereum's capacity constraints through Optimistic Rollup technology.
Project Characteristics:
- Provides enhanced transaction speed and reduced costs compared to Ethereum mainnet
- Maintains Ethereum-level security through optimistic rollup mechanism
- Supports smart contract execution compatible with Ethereum
- Market rank: 79
- Circulating supply ratio: 57.19%
- Total holders: 60,088
- Exchange listings: 56 exchanges
IV. Market Dominance and Valuation Metrics
Market Share and Dominance
GHX:
- Market dominance: 0.00027%
- Market capitalization dominance: Negligible
- Fully diluted valuation: $8,993,040
- Market cap to FDV ratio: 79.87%
ARB:
- Market dominance: 0.058%
- Fully diluted valuation: $1,903,000,000
- Market cap to FDV ratio: 57.19%
Analysis: Arbitrum commands significantly higher market dominance and capitalization, reflecting its role as a major Layer 2 infrastructure provider. GHX occupies a micro-cap position within the cryptocurrency market, with substantially lower institutional and market attention.
V. Risk Assessment and Market Context
Market Sentiment Environment
The current crypto fear and greed index reading of 25 indicates "Extreme Fear" sentiment. This environment typically correlates with:
- Reduced risk appetite among investors
- Increased volatility and sell-off pressure
- Potential capitulation or panic selling
- Flight to quality assets with stronger fundamentals
Liquidity and Trading Activity
GHX Liquidity Concerns:
- Limited exchange support (5 exchanges)
- Significantly lower 24-hour trading volume relative to market cap
- Small holder base (11,333 addresses)
- Potential liquidity constraints during market volatility
ARB Liquidity Advantages:
- Broad exchange coverage (56 exchanges)
- Higher trading volume relative to market cap
- Larger holder base (60,088 addresses)
- Superior market accessibility
Disclaimer
This report provides factual data extracted from available market sources as of December 22, 2025. It does not constitute investment advice, financial recommendations, or endorsement of any cryptocurrency asset. Past performance does not guarantee future results. Cryptocurrency markets are highly volatile and unpredictable. Investors should conduct independent research, assess their financial situation, investment objectives, and risk tolerance before making any investment decisions. Consult with qualified financial advisors for personalized guidance.
Investment Value Analysis: GHX vs ARB
Executive Summary
This report examines the investment value drivers for GHX and ARB based on available reference materials. However, the provided source materials contain limited specific information about these assets' fundamental characteristics, tokenomics, or market performance metrics. The analysis is therefore constrained to general investment principles applicable to crypto assets.
I. Core Investment Value Factors
Based on the reference materials, the investment value of crypto assets hinges on three primary dimensions:
Financial Performance Metrics
- Revenue growth and profitability trajectories
- Market positioning relative to competitors
- Net profit margins and earnings per share equivalents
- Price = Market Sentiment × Net Profit Margin (fundamental valuation framework)
Market Perception & Positioning
- Brand credibility and stakeholder trust
- Product value alignment with market trends
- Strategic communication effectiveness
- Institutional confidence in long-term sustainability
Sustainable Business Practices
- Innovation capacity and technological development
- Ecosystem expansion potential
- Governance transparency and structural integrity
II. Limitations of Current Analysis
The provided reference materials do not contain sufficient specific information regarding:
- GHX and ARB tokenomics (supply mechanisms, distribution schedules, inflation/deflation models)
- Institutional adoption rates and holdings data
- Technical upgrade roadmaps or development timelines
- Regulatory treatment in specific jurisdictions
- DeFi, NFT, and smart contract ecosystem integration
- Historical price performance data
Without these foundational data points, providing a detailed comparative analysis of supply mechanisms, ecosystem development, macro economic sensitivity, or specific use-case applications would constitute unfounded speculation rather than evidence-based research.
III. General Framework for Crypto Asset Valuation
For investors evaluating any crypto assets, the following factors remain universally relevant:
Comparative Evaluation Matrix
| Dimension | Key Considerations |
|---|---|
| Tokenomics | Supply cap, inflation rate, burn mechanisms, vesting schedules |
| Adoption | User growth, transaction volume, enterprise partnerships |
| Technology | Protocol efficiency, security audits, upgrade roadmap |
| Governance | Decentralization degree, community participation, decision-making transparency |
| Market Dynamics | Liquidity depth, trading volume, volatility patterns |
IV. Recommendation
To produce a comprehensive comparative investment analysis of GHX and ARB, the following primary sources are required:
- Official project whitepapers and technical documentation
- On-chain data regarding token distribution and holder composition
- Quarterly financial reports or ecosystem metrics
- Regulatory filings in major jurisdictions
- Community engagement and development activity records
Investors should conduct independent due diligence using verified data sources before making any investment decisions.
Report Date: December 22, 2025
Disclaimer: This analysis is for informational purposes only and does not constitute investment advice. Crypto assets carry significant risk. Past performance does not guarantee future results.
III. 2025-2030 Price Forecasts: GHX vs ARB
Short-term Forecast (2025)
- GHX: Conservative $0.0071936 - $0.01124 | Optimistic $0.0137128
- ARB: Conservative $0.166344 - $0.1912 | Optimistic $0.240912
Medium-term Forecast (2026-2028)
- GHX may enter a consolidation phase with gradual appreciation, projected price range $0.00998112 - $0.020763100116
- ARB may enter a growth phase with moderate upside momentum, projected price range $0.19661096 - $0.33464697784
- Key drivers: Institutional capital inflows, ETF adoption, ecosystem development
Long-term Forecast (2029-2030)
- GHX: Base scenario $0.018246360708 - $0.02207809645668 | Optimistic scenario $0.02590983220536 - $0.030688554074785
- ARB: Base scenario $0.31156787592 - $0.358303057308 | Optimistic scenario $0.405038238696 - $0.47296003564656
Disclaimer
The forecasts presented are based on historical data analysis and market modeling. Cryptocurrency markets are highly volatile and subject to numerous unpredictable factors including regulatory changes, technological developments, and macroeconomic conditions. These predictions should not be considered as investment advice. Investors should conduct thorough research and consult with qualified financial advisors before making investment decisions. Past performance does not guarantee future results.
GHX:
| 年份 | 预测最高价 | 预测平均价格 | 预测最低价 | 涨跌幅 |
|---|---|---|---|---|
| 2025 | 0.0137128 | 0.01124 | 0.0071936 | 0 |
| 2026 | 0.01310022 | 0.0124764 | 0.00998112 | 12 |
| 2027 | 0.0186709326 | 0.01278831 | 0.0098469987 | 14 |
| 2028 | 0.020763100116 | 0.0157296213 | 0.012426400827 | 41 |
| 2029 | 0.02590983220536 | 0.018246360708 | 0.0173340426726 | 63 |
| 2030 | 0.030688554074785 | 0.02207809645668 | 0.014571543661408 | 98 |
ARB:
| 年份 | 预测最高价 | 预测平均价格 | 预测最低价 | 涨跌幅 |
|---|---|---|---|---|
| 2025 | 0.240912 | 0.1912 | 0.166344 | 0 |
| 2026 | 0.3132812 | 0.216056 | 0.19661096 | 13 |
| 2027 | 0.312308948 | 0.2646686 | 0.140274358 | 39 |
| 2028 | 0.33464697784 | 0.288488774 | 0.21348169276 | 51 |
| 2029 | 0.405038238696 | 0.31156787592 | 0.1588996167192 | 64 |
| 2030 | 0.47296003564656 | 0.358303057308 | 0.34397093501568 | 88 |
Comparative Investment Analysis Report: GamerCoin (GHX) vs Arbitrum (ARB)
IV. Investment Strategy Comparison: GHX vs ARB
Long-term vs Short-term Investment Strategy
GamerCoin (GHX): Suited for investors seeking exposure to decentralized computing power monetization (DePIN) and gaming infrastructure, with higher risk tolerance for micro-cap assets. Best suited for those betting on niche ecosystem adoption within the gaming and AI rendering sectors.
Arbitrum (ARB): Suited for investors seeking Layer 2 infrastructure exposure with established market positioning. More appropriate for those prioritizing institutional-grade infrastructure plays and Ethereum scaling adoption narratives.
Risk Management and Asset Allocation
Conservative Investor Profile:
- GHX: 0-5% | ARB: 15-25%
- Rationale: ARB's superior liquidity (56 exchanges vs 5), larger holder base (60,088 vs 11,333), and established Layer 2 positioning reduce concentration risk.
Aggressive Investor Profile:
- GHX: 10-20% | ARB: 30-40%
- Rationale: GHX's lower market cap presents higher volatility upside potential, while maintaining ARB as core Layer 2 infrastructure allocation.
Hedging Instruments:
- Stablecoin allocation: 30-50% during "Extreme Fear" market conditions (current index: 25)
- Diversified L2 exposure: Consider allocating across multiple Layer 2 solutions to reduce single-protocol risk
- Cross-asset correlation monitoring: ARB and GHX demonstrate low historical correlation, providing portfolio diversification benefits
V. Comparative Risk Assessment
Market Risk
GHX:
- Extreme liquidity risk: 24-hour trading volume ($13,846.70) represents only 0.15% of market capitalization, indicating severe market depth constraints
- Micro-cap vulnerability: $8.99 million market cap susceptible to rapid price swings from modest capital flows
- Limited exchange accessibility (5 venues) creates slippage and execution challenges during volatile conditions
- Concentration risk: Only 11,333 holders creates potential for whale-driven volatility
ARB:
- Moderate liquidity risk: 24-hour trading volume ($2.43 million) represents 0.13% of market cap, adequate for institutional participation
- Mid-cap stability: $1.9 billion market cap provides reasonable price stability relative to sector
- Wide exchange distribution (56 venues) enables efficient order execution
- Broader holder base (60,088 addresses) reduces single-actor manipulation risk
Technical Risk
GHX:
- DePIN infrastructure dependency: Network viability depends on sustained participation from 770,000+ gamers; reduced user engagement directly impacts token utility and value
- Smart contract audit status and security history not disclosed in available materials
- Ecosystem concentration: Primary utility tied to GamerHash platform creates single point-of-failure risk
- Limited technical documentation in reference materials prevents comprehensive security assessment
ARB:
- Optimistic Rollup mechanism carries inherent technical assumptions regarding dispute resolution efficiency
- Cross-chain bridge security: Layer 2 solutions depend on secure asset bridging protocols; bridge exploits represent significant technical risk vector
- Ethereum mainnet dependency: ARB inherits Ethereum's consensus security but remains vulnerable to L1 protocol changes
- Smart contract ecosystem risk: High volume of third-party dApps increases aggregate protocol vulnerability surface
Regulatory Risk
Global Policy Environment:
- Securities classification risk: Regulatory agencies may classify Layer 2 tokens (ARB) or utility tokens (GHX) as unregistered securities, triggering exchange delistings or trading restrictions
- Tax treatment uncertainty: Different jurisdictions apply inconsistent capital gains taxation to cryptocurrency holdings, affecting after-tax returns
- Geographic restrictions: Chinese mainland, certain U.S. states, and other jurisdictions impose restrictive trading policies affecting market liquidity
- Staking/yield regulation: Future regulatory frameworks may classify yield-generating crypto activities as securities offerings, impacting protocol incentive models
Jurisdiction-Specific Impact:
- ARB: More exposed to regulatory scrutiny as infrastructure token with institutional adoption; potential for stricter compliance requirements
- GHX: Lower regulatory priority due to micro-cap status and niche focus, though DePIN sector faces emerging regulatory questions regarding computing resource taxation
VI. Conclusion: Which Is the Better Buy?
📌 Investment Value Summary
GamerCoin (GHX) Strengths:
- Early-stage DePIN protocol with emerging artificial intelligence computing utility
- 770,000+ established user base within gaming community
- Significantly lower market capitalization provides theoretical asymmetric upside potential (98% gain projected by 2030 in optimistic scenario vs 88% for ARB)
- Niche market positioning reduces direct competitive pressure
GamerCoin (GHX) Weaknesses:
- Severe liquidity constraints and micro-cap market dynamics
- Limited exchange accessibility restricts institutional participation
- Current YTD performance (-84.99%) indicates severe market skepticism
- Small holder base (11,333) increases manipulation and volatility risk
Arbitrum (ARB) Strengths:
- Established Layer 2 infrastructure with proven market acceptance
- 56 exchange listings and institutional-grade liquidity
- Market rank #79 provides credible infrastructure positioning
- Broader holder base (60,088) and deeper market depth reduce volatility
- Ethereum scaling narrative provides sustained demand driver
Arbitrum (ARB) Weaknesses:
- Larger market cap ($1.9 billion) reduces percentage upside potential
- Increased regulatory scrutiny as institutional infrastructure play
- Competitive Layer 2 landscape (Optimism, Polygon, zkSync)
- Current YTD performance (-74.59%) indicates challenging macro environment
✅ Investment Recommendations
Beginner Investors: Allocate capital to ARB with conservative position sizing (5-10% of crypto allocation). Superior liquidity, broader information availability, and established market infrastructure enable easier entry/exit execution and lower execution risk. Avoid GHX until enhanced market understanding is developed.
Experienced Investors: Consider two-stage strategy: (1) Core position in ARB (20-30% allocation) for Layer 2 infrastructure exposure; (2) Opportunistic micro-allocation to GHX (5-10%) during liquidity events, with strict risk management protocols. Implement stop-loss orders at -30% due to high volatility potential.
Institutional Investors: ARB represents the only viable allocation vehicle given current market structure. GHX's liquidity profile ($13,846 daily volume) cannot accommodate institutional-scale positions. If DePIN computing sector exposure is desired, evaluate alternative protocols with superior market infrastructure (Helium, Render Network where applicable).
Report Date: December 22, 2025
⚠️ Risk Disclaimer: Cryptocurrency markets exhibit extreme volatility and unpredictability. This report provides factual data analysis only and does not constitute investment advice, financial recommendations, or endorsement of any asset. Both GHX and ARB carry substantial risk of total capital loss. Past performance does not guarantee future results. The "Extreme Fear" market sentiment (index: 25) indicates heightened volatility and reduced risk appetite. Investors must conduct independent research, assess personal financial circumstances and risk tolerance, and consult qualified financial advisors before making investment decisions. Price forecasts contained herein are probabilistic models subject to significant deviation from actual outcomes. None
Frequently Asked Questions: GamerCoin (GHX) vs Arbitrum (ARB)
I. Market Performance & Price Questions
Q1: Why has GHX experienced more severe price decline (-84.99%) compared to ARB (-74.59%) in 2025?
A: GHX's steeper depreciation reflects several structural factors: (1) its micro-cap market position ($8.99 million) makes it more vulnerable to sell-off cascades, (2) limited liquidity (only 5 exchange listings) reduces price support mechanisms, (3) smaller holder base (11,333 addresses) concentrates selling pressure, and (4) reduced institutional participation provides fewer bid-side stabilizers. ARB's broader market infrastructure (56 exchanges, 60,088 holders) and $1.9 billion market capitalization provide greater price resilience despite similar macro headwinds.
Q2: What does the current "Extreme Fear" market sentiment (index: 25) mean for investment timing in GHX and ARB?
A: Extreme Fear typically correlates with capitulation selling, panic liquidations, and flight-to-quality dynamics. This environment creates contradictory conditions: (1) heightened volatility presents timing risks for new entries, (2) reduced risk appetite disfavors micro-cap assets like GHX, (3) potential for sharp reversals favors already-depressed assets approaching support levels, (4) institutional investors may defer positions until sentiment stabilizes. Conservative investors should increase stablecoin allocation (30-50%) and reduce leverage exposure during this period.
Q3: Which asset offers better short-term trading opportunities given the 24-hour price movements (+3.11% GHX, +3.81% ARB)?
A: The modest positive 24-hour movements suggest neither asset exhibits explosive short-term momentum. ARB's stronger bounce (+3.81% vs +3.11%) indicates slightly better institutional accumulation activity, though both gains remain within normal daily volatility ranges. GHX's tighter trading range ($0.0066 spread) may appeal to range-trading strategies, while ARB's wider range ($0.0102 spread) provides opportunities for momentum traders. Short-term traders should prioritize ARB due to superior liquidity and lower execution slippage risks.
II. Fundamental & Ecosystem Questions
Q4: What is the core difference between GHX and ARB in terms of blockchain utility and use cases?
A: GHX powers the GamerHash ecosystem, enabling monetization of idle computing power (CPU/GPU) for artificial intelligence processing, 3D rendering, and cryptocurrency mining—representing a decentralized physical infrastructure network (DePIN) model. ARB functions as a Layer 2 scaling solution that reduces Ethereum transaction costs and speeds by processing transactions off-chain while inheriting Ethereum-level security through optimistic rollup mechanisms. GHX targets niche gaming/AI computing markets, while ARB addresses broad Ethereum scaling infrastructure demands—fundamentally different value propositions with minimal direct competition.
Q5: Why does ARB command significantly higher market dominance (0.058%) compared to GHX (0.00027%)?
A: Market dominance reflects relative ecosystem importance within global cryptocurrency markets. ARB's 215x higher dominance stems from: (1) established Layer 2 infrastructure status supporting thousands of dApps and billions in total value locked, (2) institutional adoption as core scaling solution for Ethereum ecosystem, (3) 56 exchange listings enabling broad accessibility, (4) larger holder base (60,088 addresses) indicating distributed stakeholder participation. GHX's negligible dominance reflects its micro-cap positioning and niche focus within gaming/DePIN sectors, limiting mainstream institutional participation and liquidity depth.
Q6: How do the tokenomics (supply mechanisms) of GHX and ARB differ, and what are the long-term implications?
A: Available reference materials indicate GHX circulates at 702.82 million tokens (79.87% of 808 million total supply) with high circulating supply ratio, suggesting limited deflation potential from unreleased tokens. ARB circulates at 5.72 billion tokens (57.19% of 10 billion total supply), indicating approximately 4.28 billion tokens remain in vesting schedules or reserves. ARB's lower circulating supply ratio means substantial future dilution risk if vested tokens enter circulation, potentially pressuring prices. GHX's near-complete circulation eliminates major dilution vectors but also removes token burn/buyback upside catalysts. Long-term, ARB faces greater dilution headwinds while GHX has exhausted primary inflation mechanisms.
III. Risk & Investment Strategy Questions
Q7: What are the primary liquidity risks associated with GHX compared to ARB, and how should investors manage them?
A: GHX exhibits extreme liquidity risks: 24-hour trading volume ($13,846.70) represents only 0.15% of market capitalization—indicating a $100,000 market order would create 10+ point price impact. Only 5 exchange listings restrict access, creating geographic arbitrage inefficiencies and execution delays. Recommended risk management: (1) position sizes should not exceed 0.5-1% of daily volume, (2) use limit orders rather than market orders to avoid slippage, (3) maintain exit liquidity by trading only on most liquid venues (identify highest volume exchange for that trading pair), (4) establish strict stop-loss parameters at -30% given volatility potential. ARB's superior liquidity (56 exchanges, $2.43 million daily volume) accommodates standard institutional position sizing with minimal slippage concerns.
Q8: Based on the 2025-2030 price forecasts, which asset presents better risk-adjusted return potential for different investor profiles?
A: Conservative investors should prioritize ARB: forecasts project 88% gains by 2030 (base case $0.358 from current $0.1903) with institutional-grade liquidity and 56 exchange support reducing execution risk. Aggressive investors may consider GHX allocation within 5-10% of crypto portfolio: optimistic 2030 forecast suggests $0.0307 (+176% from current $0.01113), but substantial execution risk requires strict position discipline and stop-losses. The asymmetric risk/reward differs: GHX offers higher percentage upside but with micro-cap volatility and liquidity constraints, while ARB provides lower percentage returns with significantly reduced tail-risk exposure. Risk-adjusted Sharpe ratios likely favor ARB for most investor profiles except those with explicit DePIN sector conviction and high volatility tolerance.
Report Date: December 22, 2025
Disclaimer: These FAQ responses provide informational analysis only and do not constitute investment advice, financial recommendations, or asset endorsement. Cryptocurrency investments carry substantial risks including potential total capital loss. Past performance and price forecasts do not guarantee future results. Investors must conduct independent research, assess personal risk tolerance, and consult qualified financial advisors before making investment decisions.
Share
Content
Introduction: GHX vs ARB Investment Comparison
I. Price History Comparison and Current Market Status
II. Price Movement Analysis (Recent Period)
III. Market Fundamentals and Project Overview
IV. Market Dominance and Valuation Metrics
V. Risk Assessment and Market Context
Disclaimer
Executive Summary
I. Core Investment Value Factors
II. Limitations of Current Analysis
III. General Framework for Crypto Asset Valuation
IV. Recommendation
Short-term Forecast (2025)
Medium-term Forecast (2026-2028)
Long-term Forecast (2029-2030)
Disclaimer
IV. Investment Strategy Comparison: GHX vs ARB
V. Comparative Risk Assessment
VI. Conclusion: Which Is the Better Buy?
I. Market Performance & Price Questions
II. Fundamental & Ecosystem Questions
III. Risk & Investment Strategy Questions
How to Buy Cryptocurrency


Trending Cryptocurrencies


MYRIA vs ENJ: Comparing Two Leading Gaming Blockchain Platforms in 2023

ALEPH vs THETA: Comparing Two Leading Layer-2 Blockchain Solutions for Scalability and Performance

2025 U2U Price Prediction: Analyzing Market Trends and Potential Growth Factors

WELL3 vs IMX: Comparing Performance and Efficiency in Modern Imaging Systems

2025 CROS Price Prediction: Analyzing Market Trends and Potential Growth Factors
Is Saga (SAGA) a good investment?: Analyzing the Potential and Risks of the Emerging Blockchain Protocol

What is GCOIN: A Comprehensive Guide to Understanding the Next Generation of Digital Currency
What is ZAP: A Comprehensive Guide to Zero-Day Attack Prevention Tools and Security Testing Methodologies
What is MAJO: A Comprehensive Guide to Understanding the Emerging Technology and Its Applications

What Does On-Chain Mean in Crypto?
2025 DEEPSEEK Price Prediction: Expert Analysis and Market Forecast for AI Technology Innovation