An Empirical Analysis of Stablecoin Payment Usage on Ethereum
This report empirically examines how stablecoins are used for payments, analyzing person-to-person (P2P), business-to-business (B2B), and person-to-business (P2B/B2P) transactions.
This report empirically examines how stablecoins are used for payments, analyzing person-to-person (P2P), business-to-business (B2B), and person-to-business (P2B/B2P) transactions. Leveraging Artemis datasets that provide wallet address metadata—including geographical estimates, institutional ownership labels, and smart contract identification—we classify transactions based on sender and receiver wallet characteristics. We focus our analysis on Ethereum, which hosts approximately 52% of global stablecoin supply, examining the two dominant stablecoins: USDT and USDC, which together represent 88% of the market. Despite significant adoption and regulatory momentum over the past year, a critical question remains unanswered: what is the actual usage of stablecoins for payments versus other activities? This analysis sheds light on the main drivers of stablecoin payment adoption and provides insights for predicting future trends.
1.Background
In the last few years, the adoption of stablecoins has increased significantly, with supply reaching $200 billion dollars and the current raw monthly transfer volume exceeding $4 trillion. While blockchain networks offer full transparency with every transaction documented and available for analysis, conducting transaction and user analysis is difficult due to the pseudonymous nature of these networks and the lack of information regarding the transaction’s goal (e.g., domestic payment, cross-border payment, trading). Furthermore, the use of smart contracts and automated transactions on networks like Ethereum can make analysis even more complex, as a single transaction may involve multiple interactions with various smart contracts and tokens. Therefore, a key, unresolved question is to evaluate the current usage of stablecoins for payments compared to other activities like trading. Many researchers are tackling this challenging question, and our report offers additional methods to evaluate stablecoin usage, specifically payments.
There are two main approaches to evaluate the usage of stablecoins in general and for payments. The first is a filtering approach, which uses raw blockchain transaction data and applies filtering methods to improve the estimation of stablecoin payment usage by removing noise. The second approach involves conducting surveys of major stablecoin payment providers and estimating stablecoin activity based on their disclosed payment data.
The Visa Onchain Analytics Dashboard, developed in collaboration with Allium Labs, uses the first approach. Their method applies filtering to provide less noisy information about general stablecoin activity. They show that after filtering the raw data, the total monthly stablecoin volume reduces from around $5 trillion (Total Transaction Volume) to $1 trillion (Adjusted Transaction Volume). When only considering Retail Transaction Volume (transactions less than $250), the volume is only $6 billion. We use a similar filtering approach to the Visa Onchain Analytics Dashboard but provide methods more focused on labeling transactions specifically as payments.
The second approach, based on company surveys, was used in the Fireblocks State of Stablecoins 2025 report and Stablecoin Payments from the Ground Up report. Both reports use disclosed information from major companies in the blockchain payments market to estimate the direct usage of stablecoins for payments. Stablecoin Payments from the Ground Up in particular provides a general estimation for the volumes of stablecoins for payments and classifies those payments into categories such as B2B, B2C, P2P, etc. In their report, the annual run rate for settlements totaled approximately $72.3 billion in February 2025, and the majority is B2B.
The main contribution of this paper is the application of a data filtering approach to estimate the usage of stablecoins for on-chain payments. Our results shed light on stablecoin usage and provide a better estimation. Additionally, we offer guidance for researchers on using data filtering methods to process raw blockchain data, reduce noise, and improve estimations.
2.Data
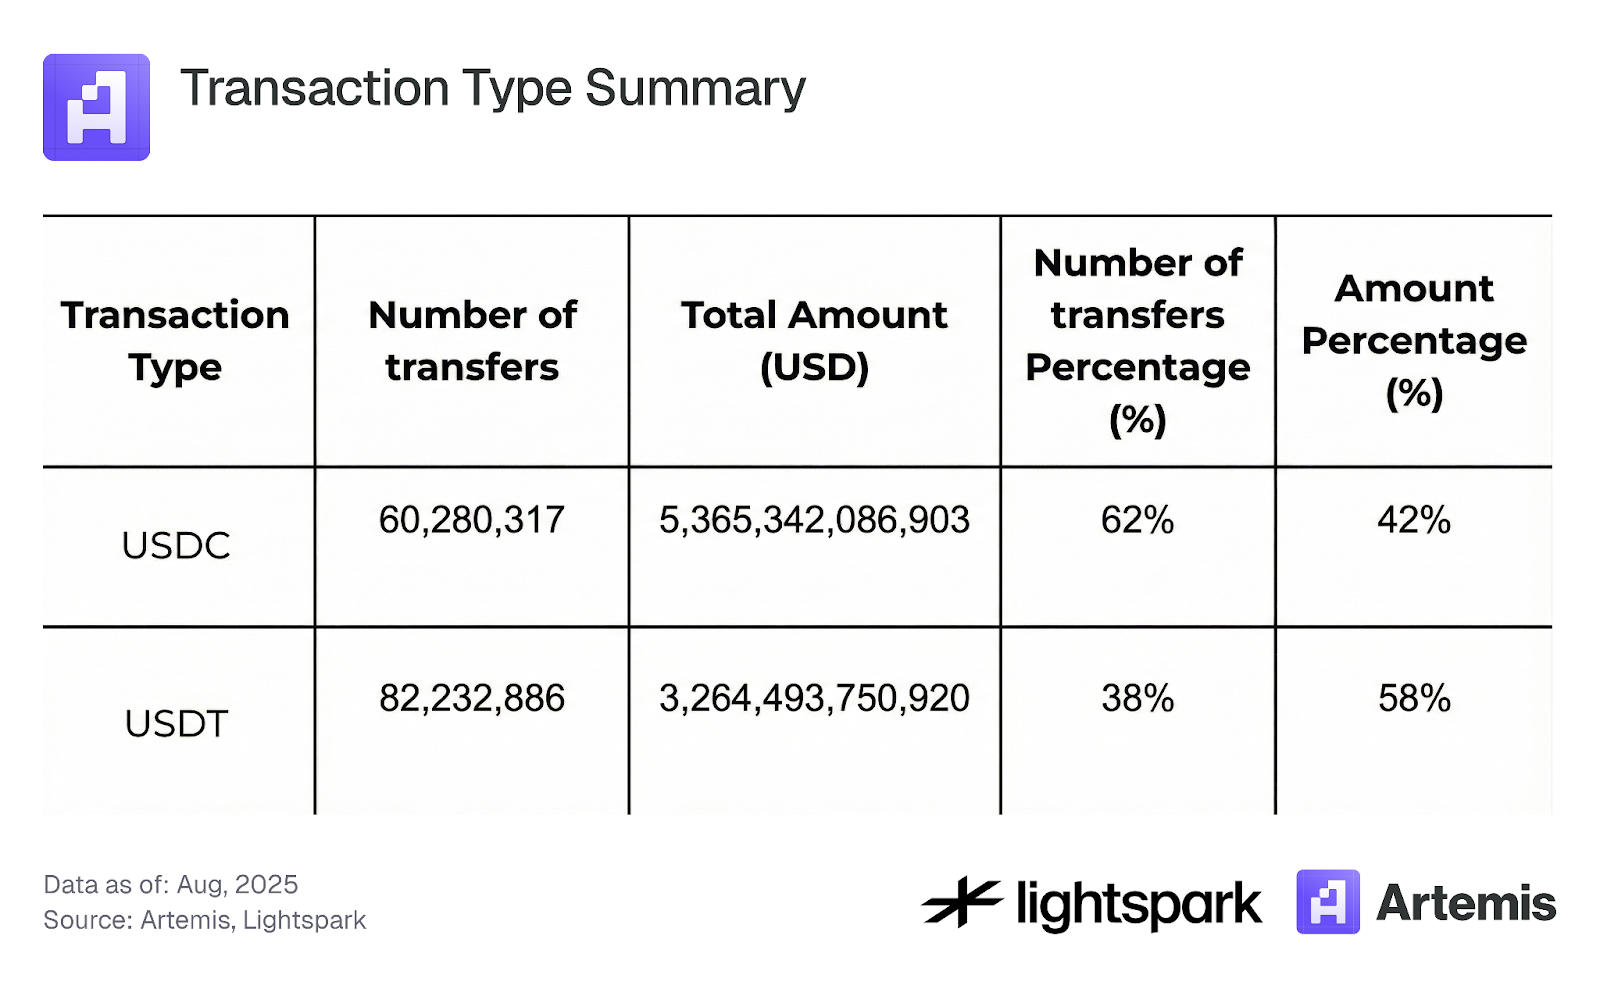
Our data includes all stablecoin transactions on the Ethereum blockchain from August 2024 until August 2025. We focus primarily on transactions involving the top stablecoins, USDC and USDT. We chose these coins due to their high market share and price stability, which reduces noise in the analysis. We also only focus on transfer transactions and exclude any mint, burn, or bridge transactions from our analysis. Table 1 summarizes the overall dataset for our analysis.
Table 1: Transaction Type Summary
3.Methodology and Results
In this section, we provide a detailed explanation of our methodology for analyzing stablecoin usage, with a primary focus on payment transactions. To accomplish this, we first filter our data by distinguishing between transactions that involve interactions with smart contracts and those that represent EOA-to-EOA transfers, which we classify as payments. This process is covered in Section 3.1. Subsequently, Section 3.2 explains how we use EOA account labeling data from Artemis to classify payments into more specific categories: P2P, B2B, B2P, P2B, and Internal B transactions. Finally, Section 3.3 examines the concentration of stablecoin transactions.
3.1 Stablecoin payments (EOA) vs Smart contract transactions:
In DeFi, many transactions interact with smart contracts and combine multiple financial operations in the same transaction, such as swapping one token for another via several liquidity pools. This complexity makes it harder to analyze and accurately estimate the usage of stablecoins for payments only.
To simplify and improve our ability to label a stablecoin blockchain transaction as a payment, we will define a stablecoin payment as any ERC-20 stablecoin transfer (excluding mint and burn transactions) from an EOA to EOA address. Any transaction not labeled as a payment will be labeled as a smart contract transaction, including any transaction that involves interaction with smart contracts (e.g., mainly DeFi transactions).
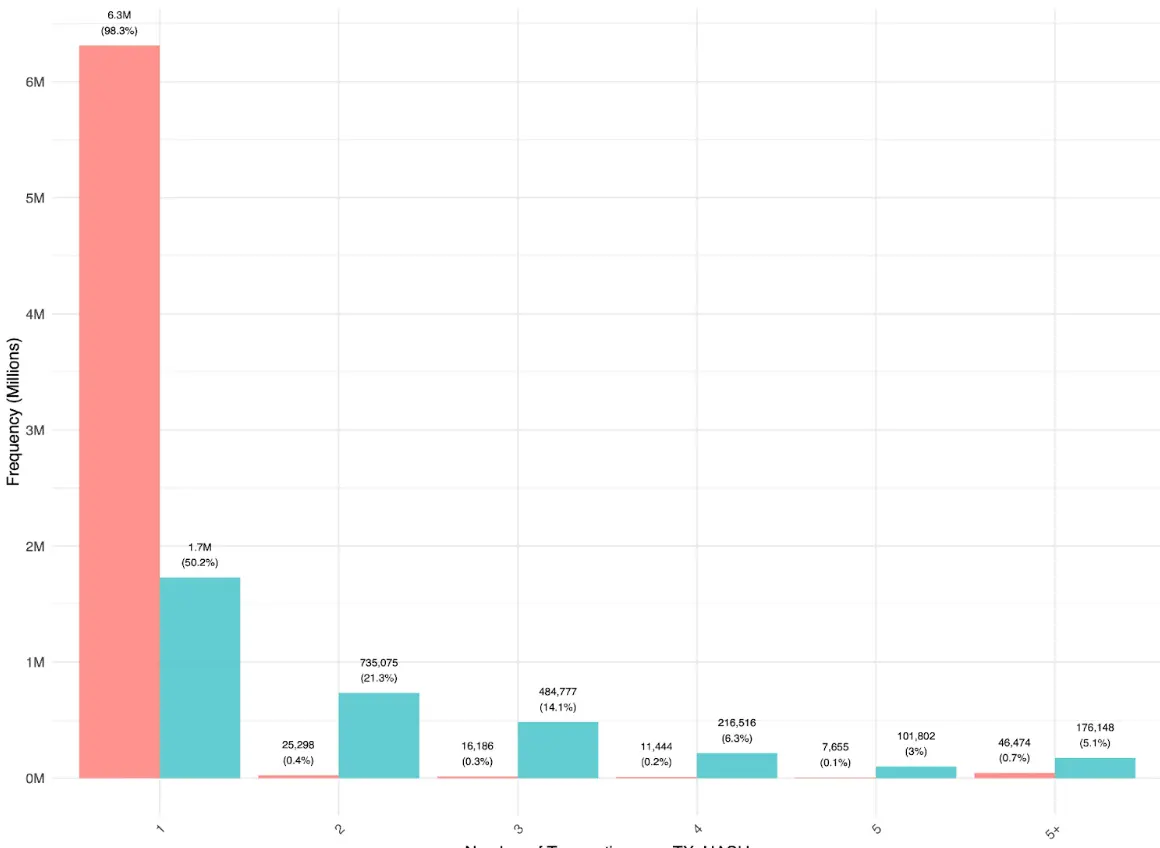
Figure 1 shows that most payments between users (EOA-EOA) are sent directly with only one transfer per transaction hash. Some multi-EOA-EOA transfers within the same transaction hash occur mainly via aggregators, indicating that aggregator usage for simple transfers remains low. In contrast, smart contract transactions show a different distribution, with many more transactions including multiple transfers. This suggests that in DeFi operations, stablecoins move between different applications and routers before returning to an EOA account.
Figure 1: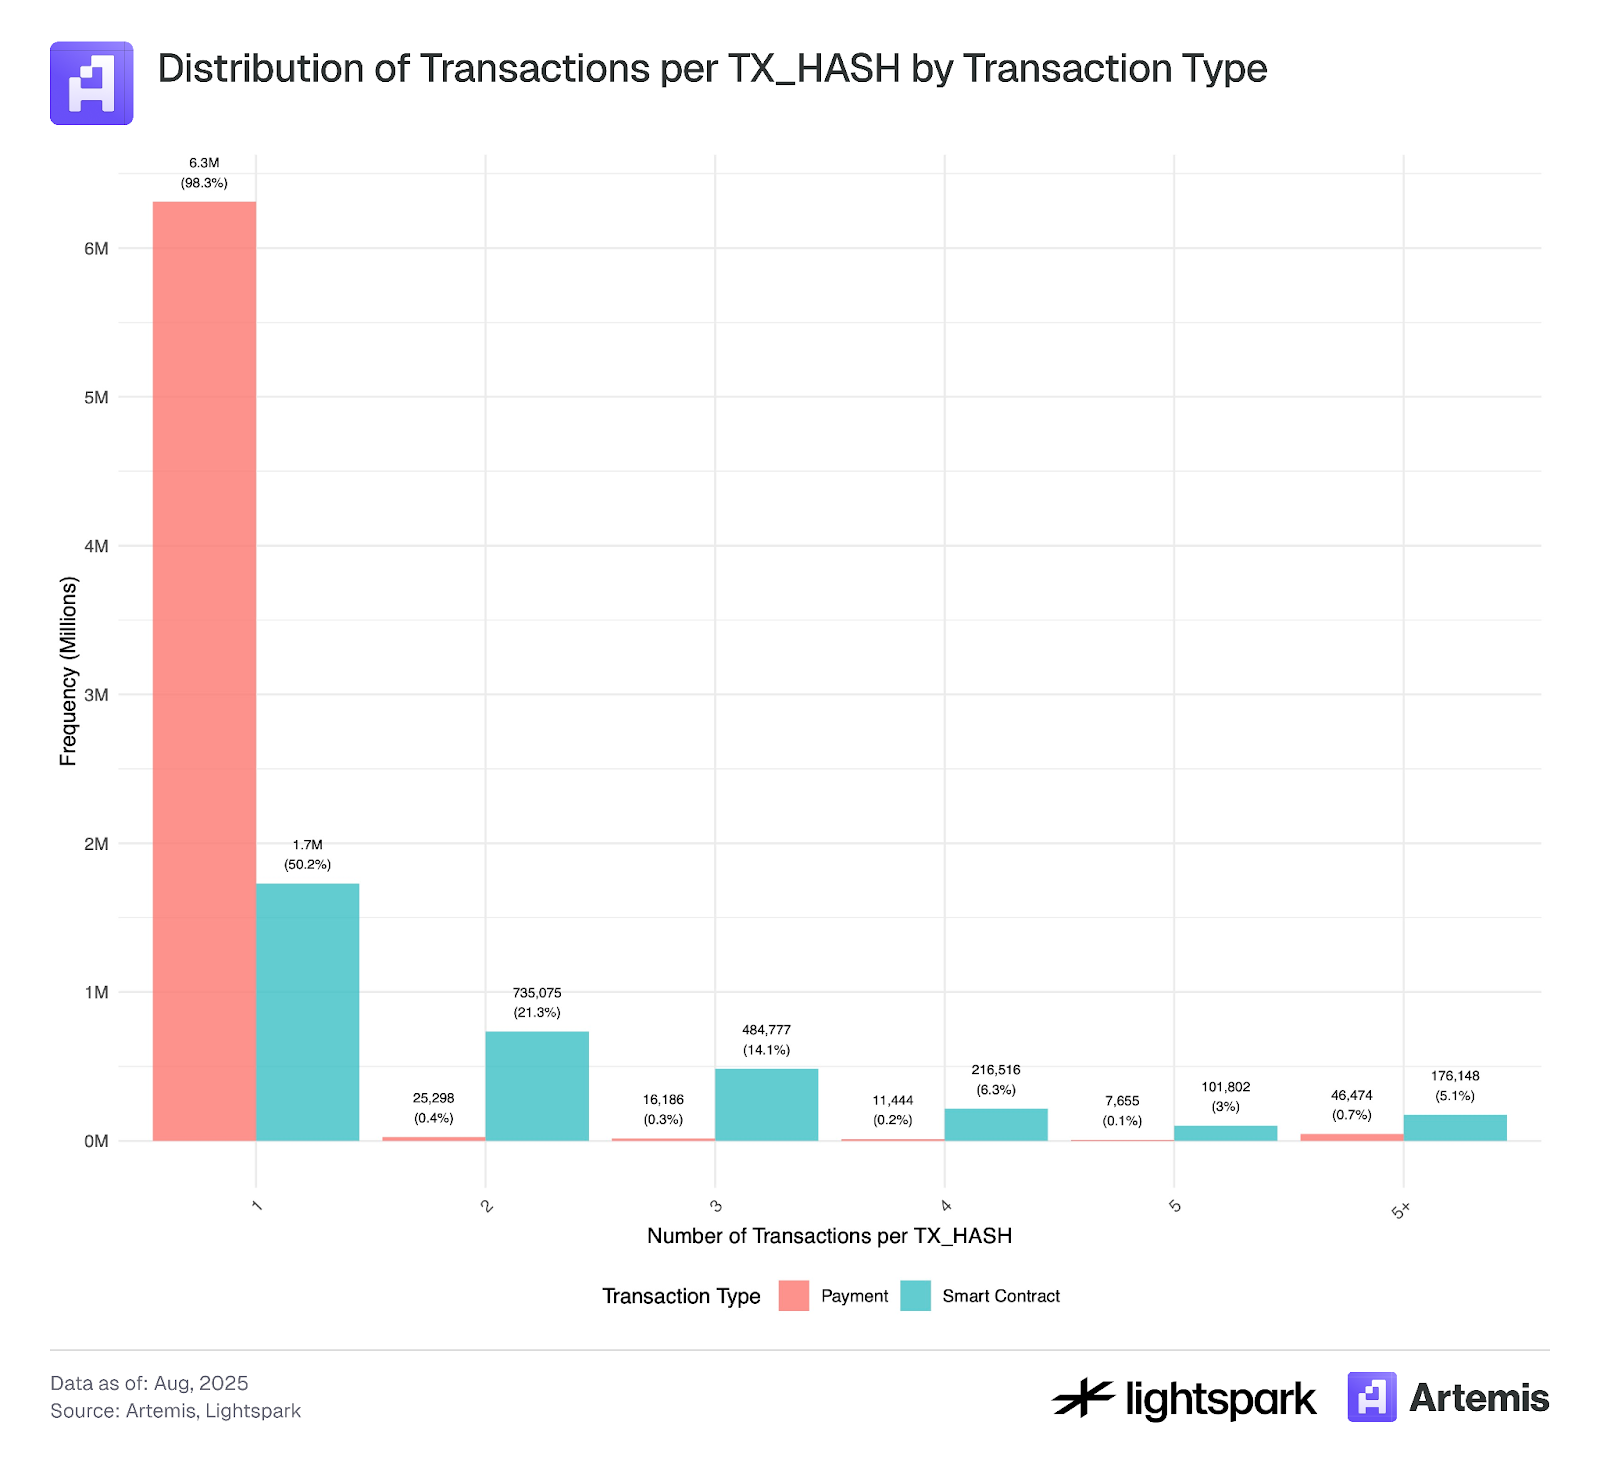
*We used for this analysis a sample of our data that covers transactions from July 4th, 2025 - July 31, 2025.
Table 2 and Figure 2 show that the split between payments (EOA-EOA) and smart contract transactions (DeFi) is roughly 50-50 by transaction count, with smart contract transactions accounting for 53.2% of volume. However, Figure 2 reveals that volume (total amount transferred) exhibits much greater fluctuation over time than transaction count, indicating that large EOA-EOA transfers—primarily from institutions—drive these fluctuations.
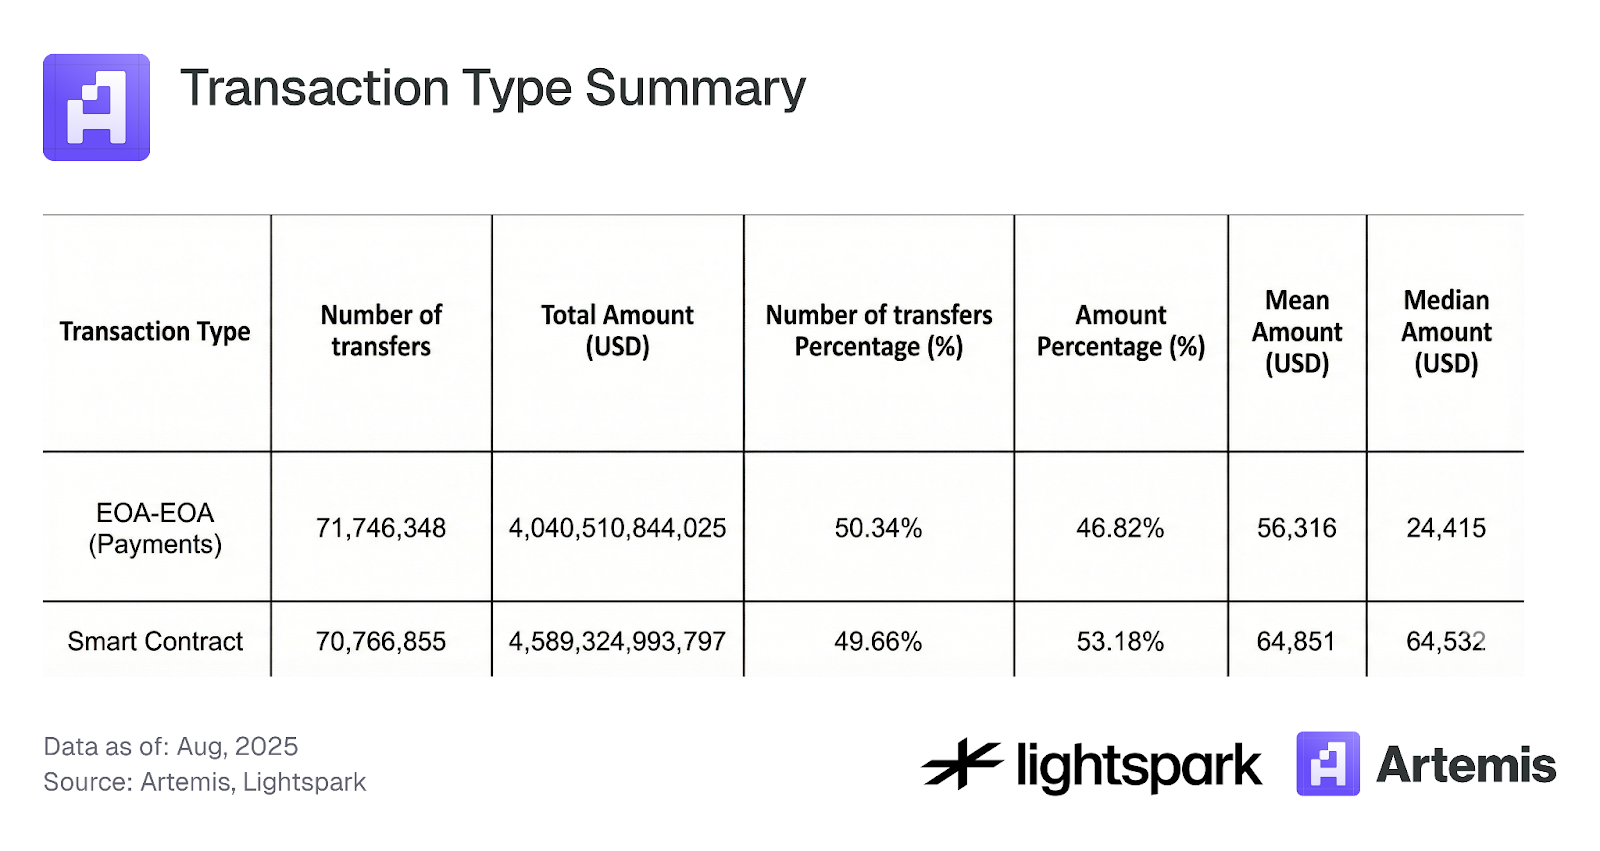
Table 2: Transaction Type Summary
Figure 2: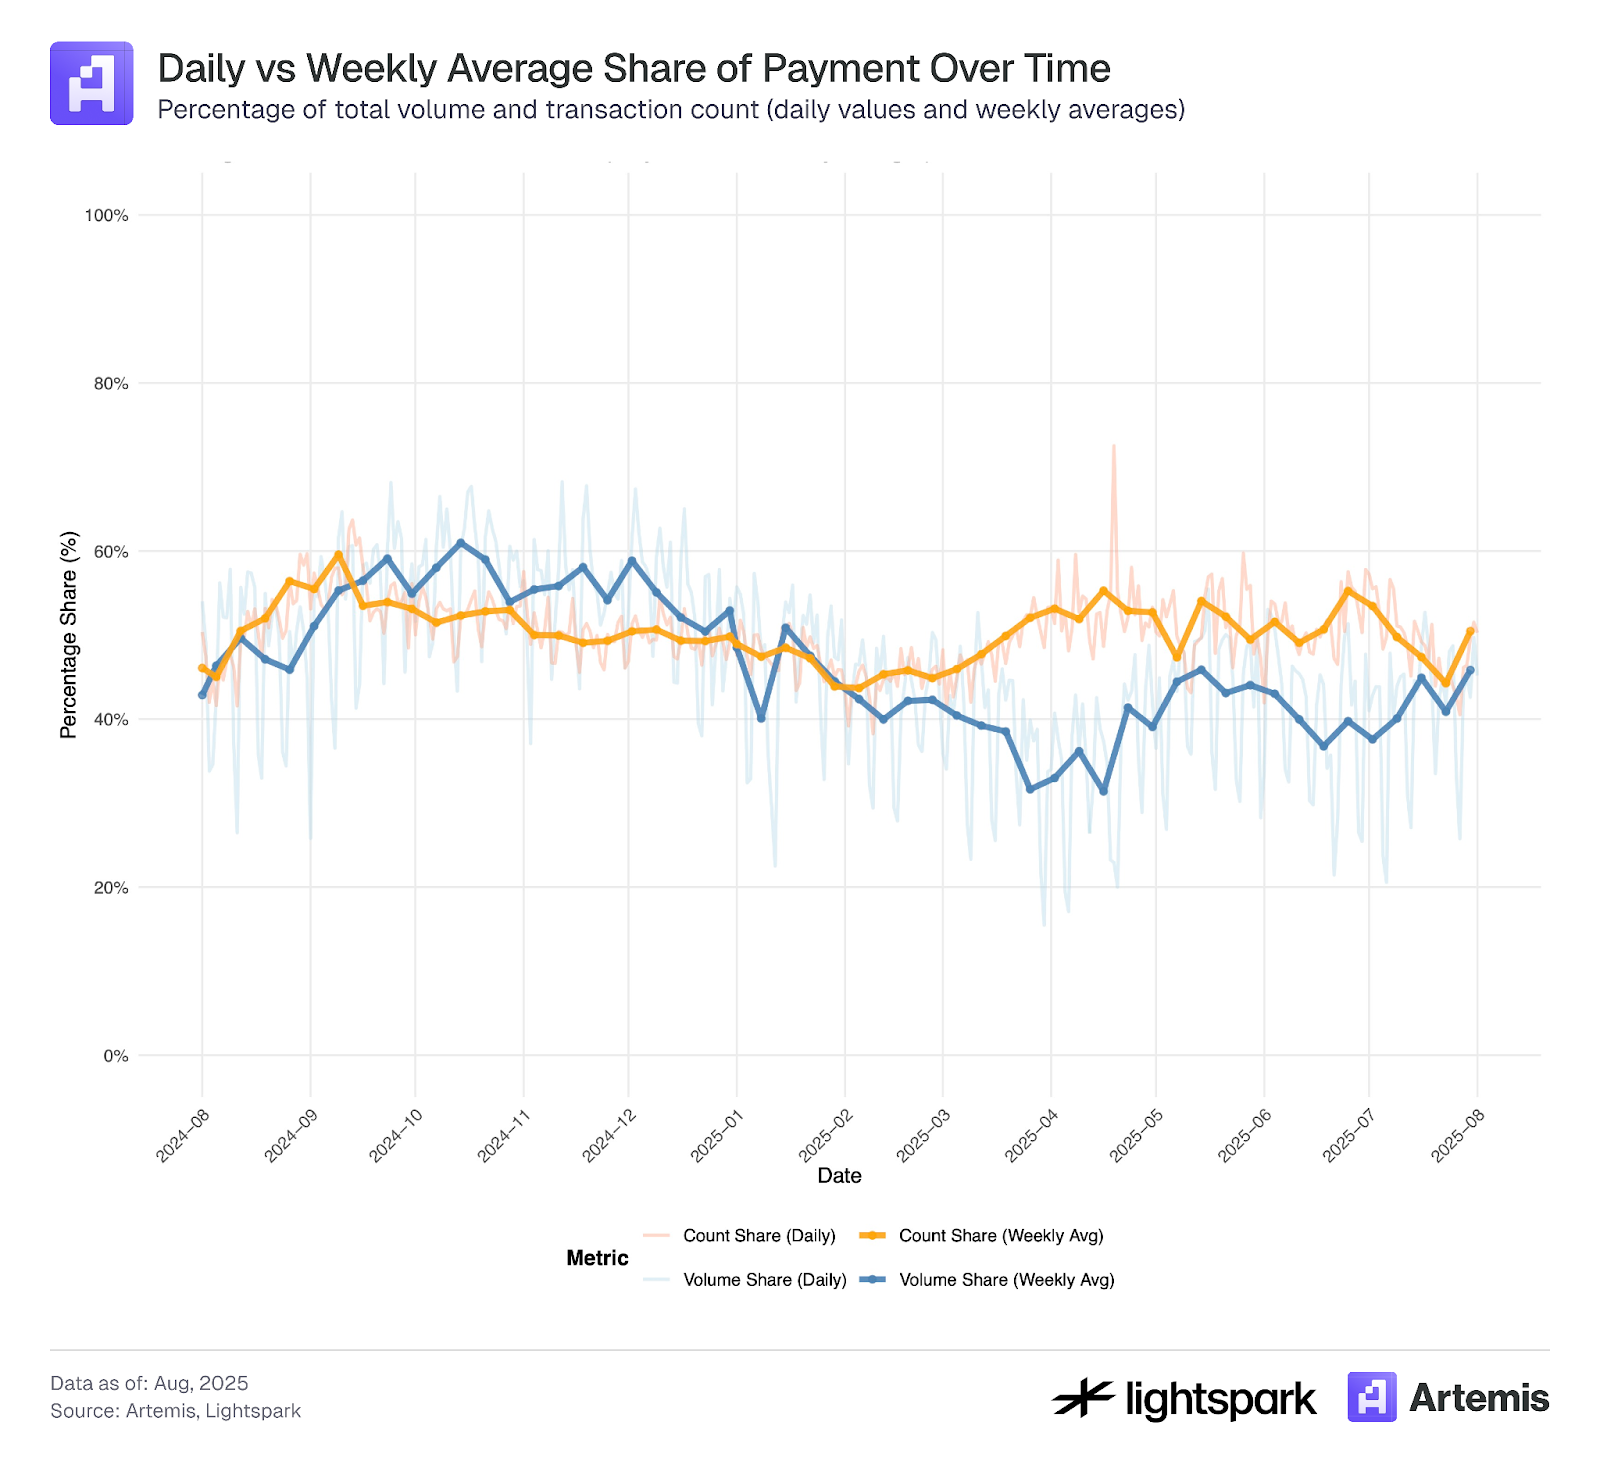
Figure 3 explores the distribution of transaction values for payments (EOA-EOA) versus smart contracts. Both payment and smart contract transactions show value distributions resembling fat-tailed normal distributions, with means around $100-$1,000. However, there’s a notable spike in transactions with values below $0.1, which may indicate bot activity or transaction manipulation consistent with fake transaction activity and wash trading, as described in Halaburda et al. (2025) and Cong et al. (2023). Since Ethereum gas fees typically exceed $0.1, transactions below this threshold warrant closer examination and potential exclusion from analysis.
Figure 3: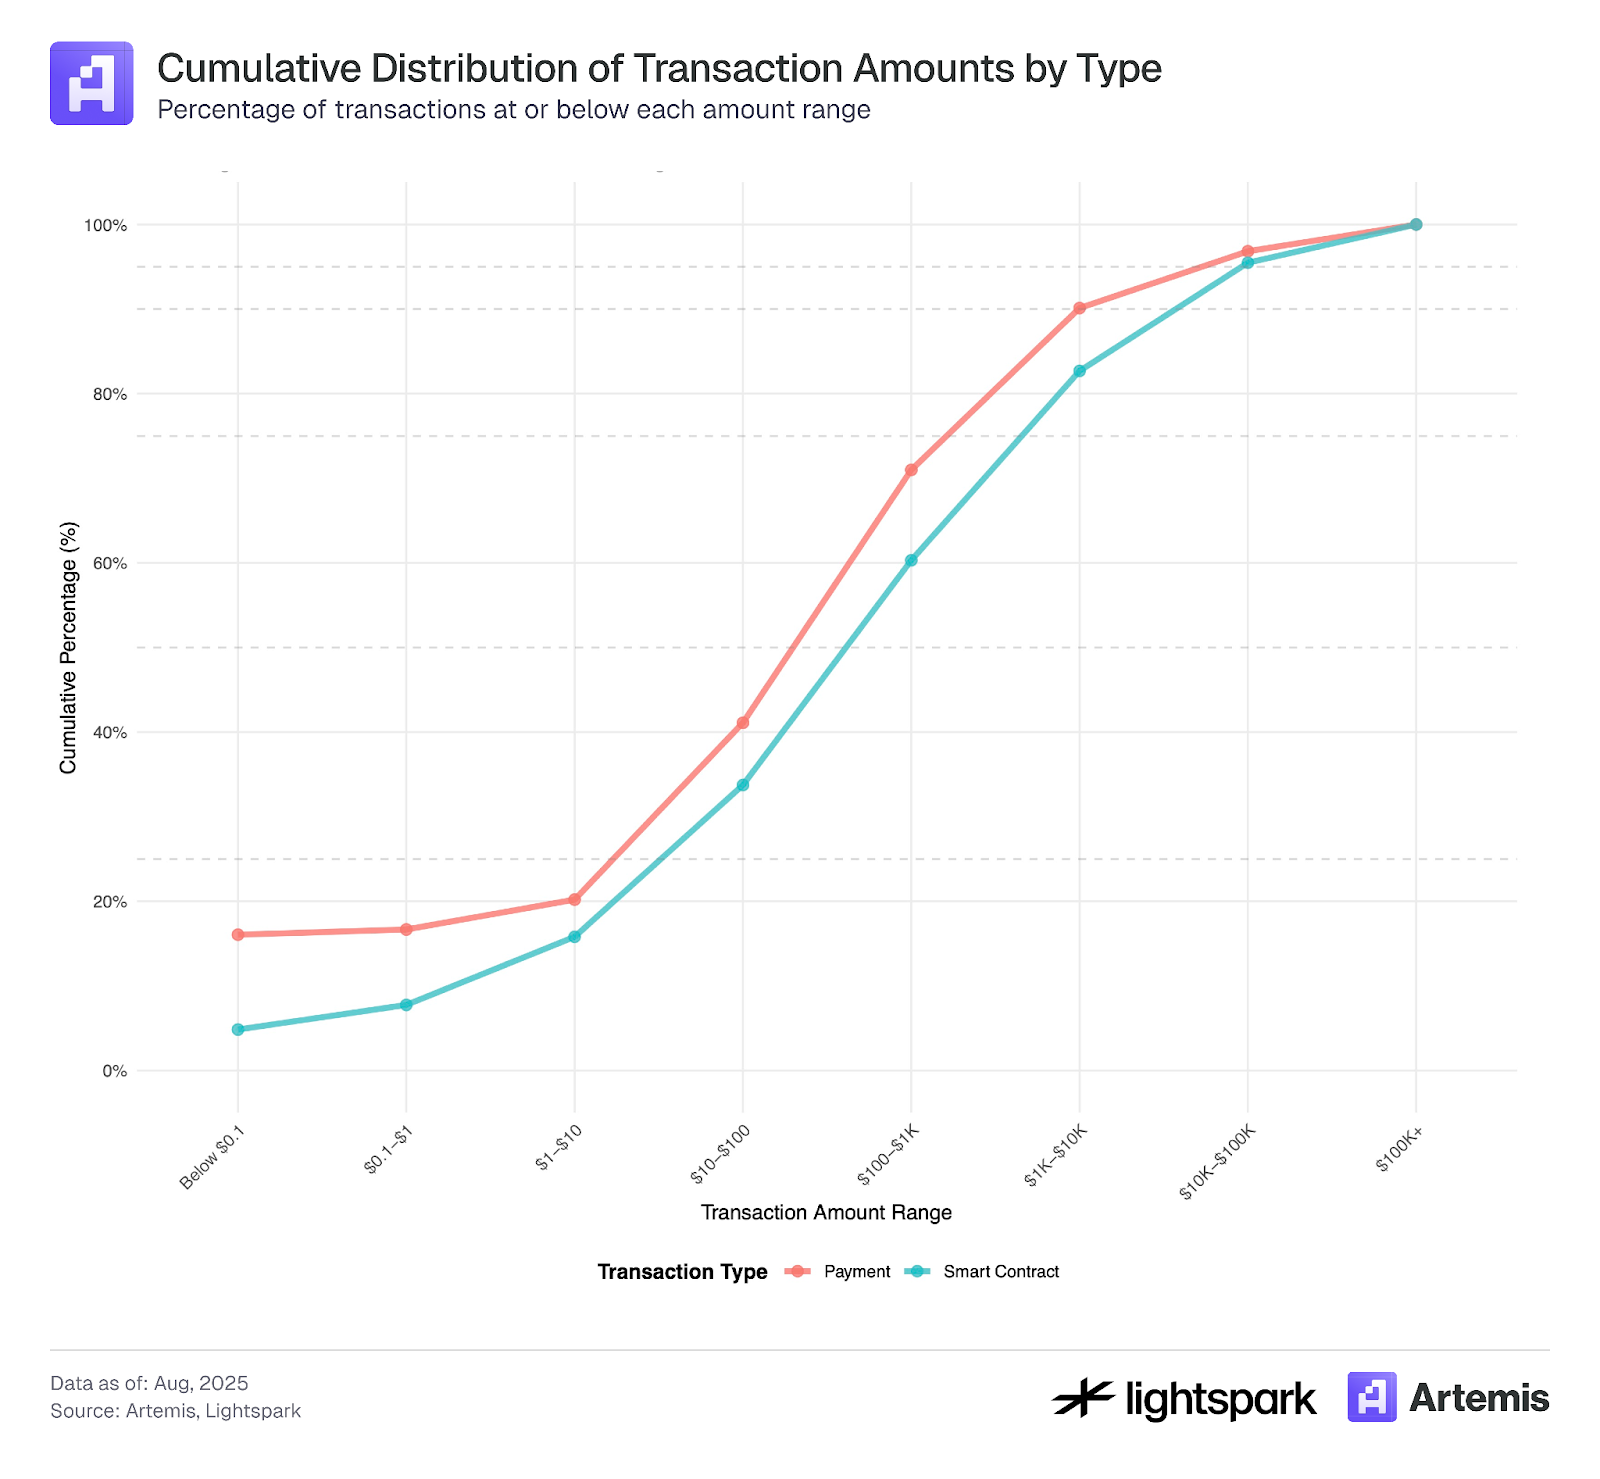
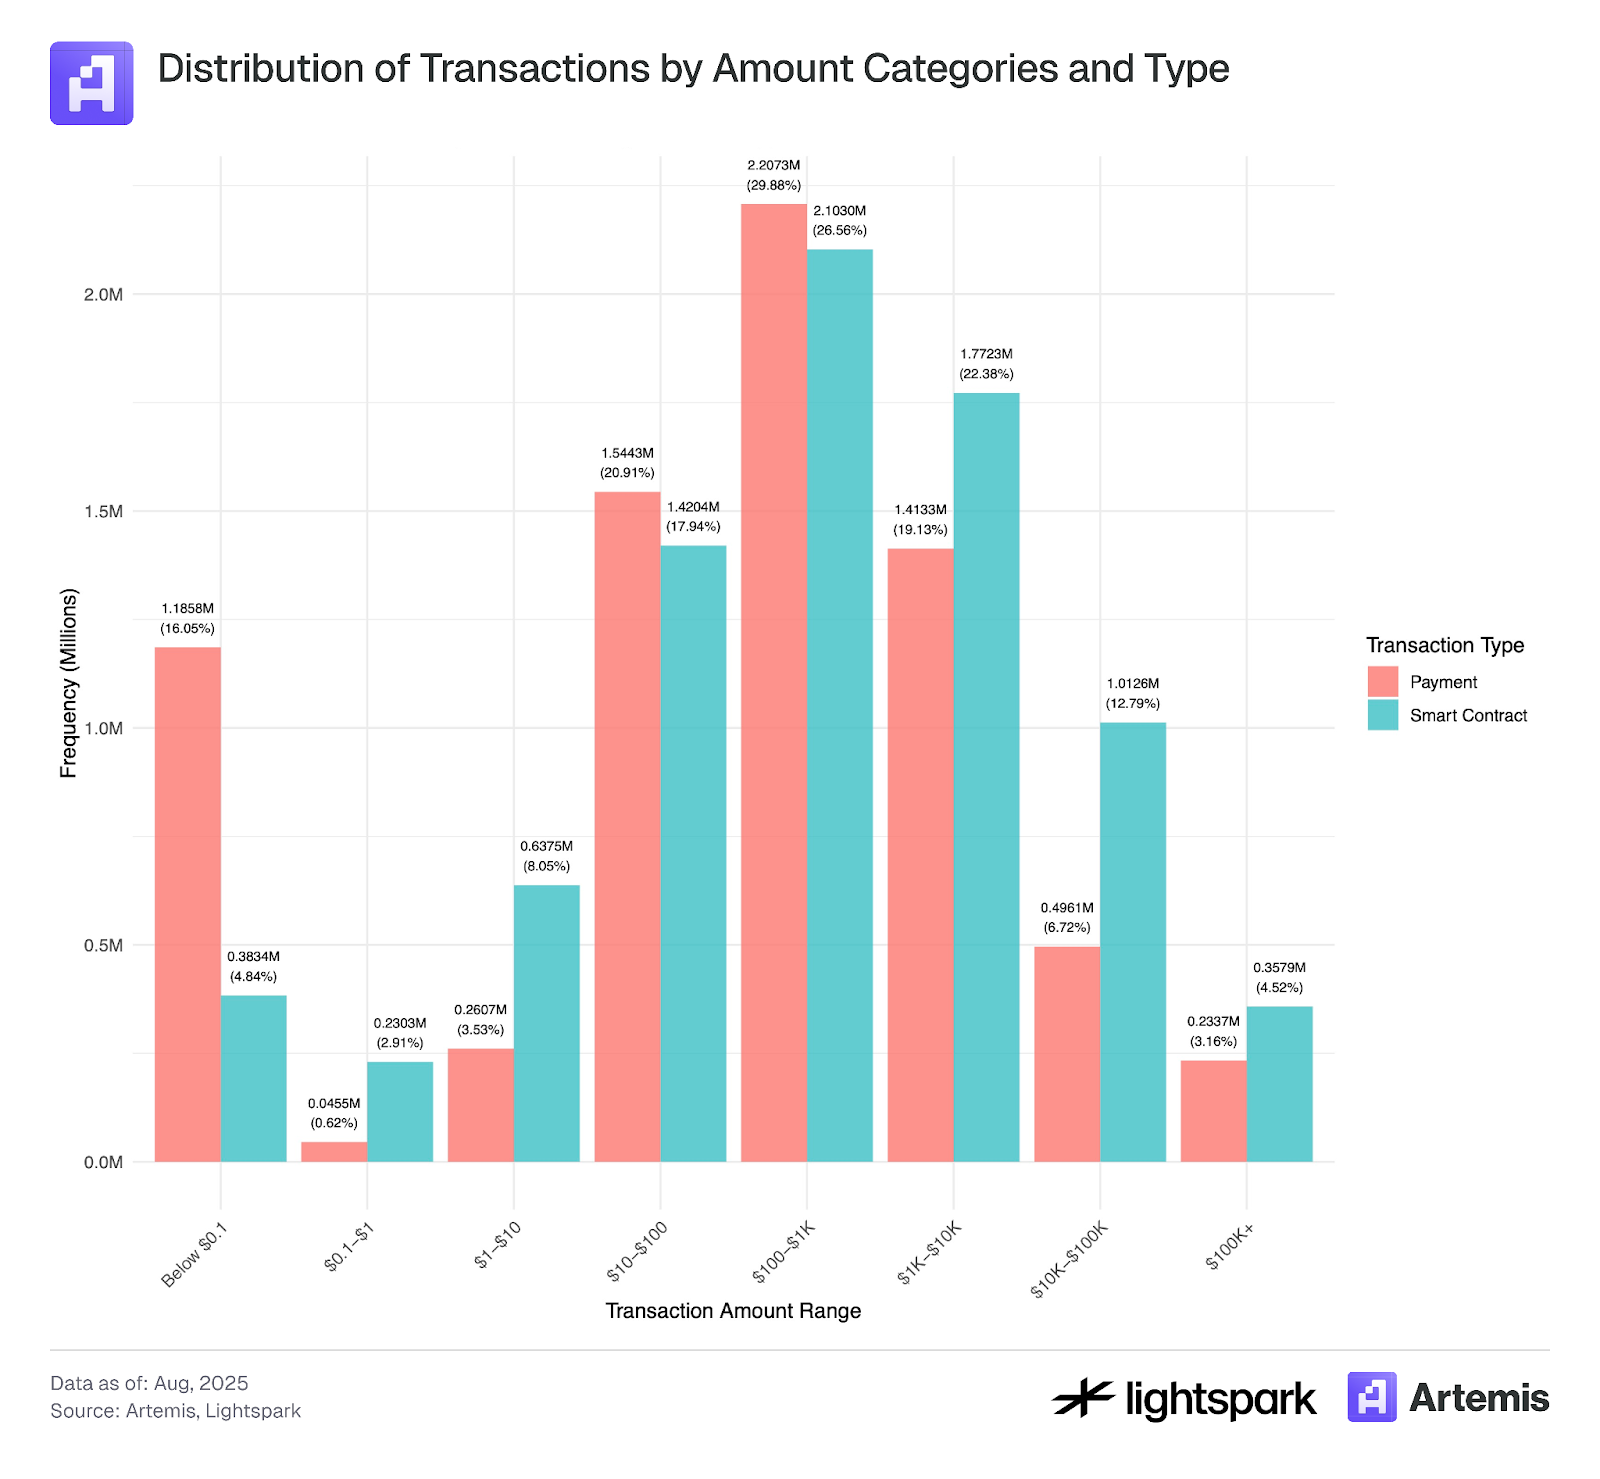
*We used for this analysis a sample of our data that covers transactions from July 4, 2025 through July 31, 2025
3.2 Payments types:
Payments between two EOA accounts can be further analyzed using labeling information from Artemis. Artemis provides labeling for many Ethereum wallet addresses, identifying wallets owned by institutions like Coinbase. We classify payments into five categories: P2P, B2B, B2P, P2B, and Internal B. Detailed descriptions of each category follow.
P2P payment: P2P blockchain payments are person-to-person transactions in which funds are transferred directly from one user to another through a blockchain network. In account-based blockchains (such as Ethereum), these P2P transactions are defined as the movement of digital assets from one user’s wallet (EOA account) to another user’s EOA wallet, recorded and validated on the blockchain without intermediaries.
The main challenge is to identify whether a transaction between two wallets in an account-based system is indeed between two agents (individuals not firms) and can be correctly classified as a P2P transaction. For example, a user sending money between their own accounts (Sybil accounts) should not be counted as a P2P transaction. However, such transfers can be misclassified as P2P if we define any transaction between two EOAs (externally owned accounts) as a P2P transaction. Another issue occurs when an EOA account is owned by a firm, for example a CEX like Coinbase, and then the EOA wallet is not owned by a real individual (person). In our dataset we are able to label many institutional and firm EOA wallets; however, the labeling is not perfect and some EOA wallets that are owned by firms and are not documented in our dataset can be mislabeled as individual wallets.
Finally this method can’t capture a Blockchain P2P payment via intermediation–also known as the “stablecoin sandwich” model–in which funds are transferred between users through intermediaries that leverage blockchain for settlement. In this model, fiat currency is first sent to an intermediary, which converts it into cryptocurrency. The funds are then transferred over the blockchain network and finally converted back into fiat currency by another intermediary (or the same one) on the receiving side. The blockchain-based transfer is the “middle layer” of the sandwich, while the fiat conversions form the outer layers. The main challenge in identifying these transactions is that they are executed by intermediaries, who may bundle multiple transactions together to reduce gas costs. As a result, some key data such as the exact transaction amounts and the number of users involved is only available on the intermediary’s platform.
B2B: A Business-to-Business (B2B) transaction refers to electronic transfers made from one business to another business through a blockchain network. Stablecoin payment is between two known institutional EOA wallets (in our data set), for example from Coinbase to Binance.
Internal B: Transactions between two EOA wallets of the same institution will be labeled as Internal B.
P2B (or B2P): A person-to-Business (P2B) or Business-to-Person (B2P) transaction refers to electronic transfers made between a person and a business, in either direction.
Using this labeling method, we analyzed our payments data (only EOA-EOA transfers), and the main results are in Table 3. We can see that 67% of the EOA-EOA transactions are P2P. However, they only account for 24% of the payments volume. This strengthens the point that P2P users are transferring low volume compared to institutions. In addition, one of the highest volumes of payments are from Internal B category, which means transfers within the same organization. It is still interesting to explore what Internal B transactions mean and how we should count them in payments activity analysis.
Table 3: Transaction Distribution by Payment Category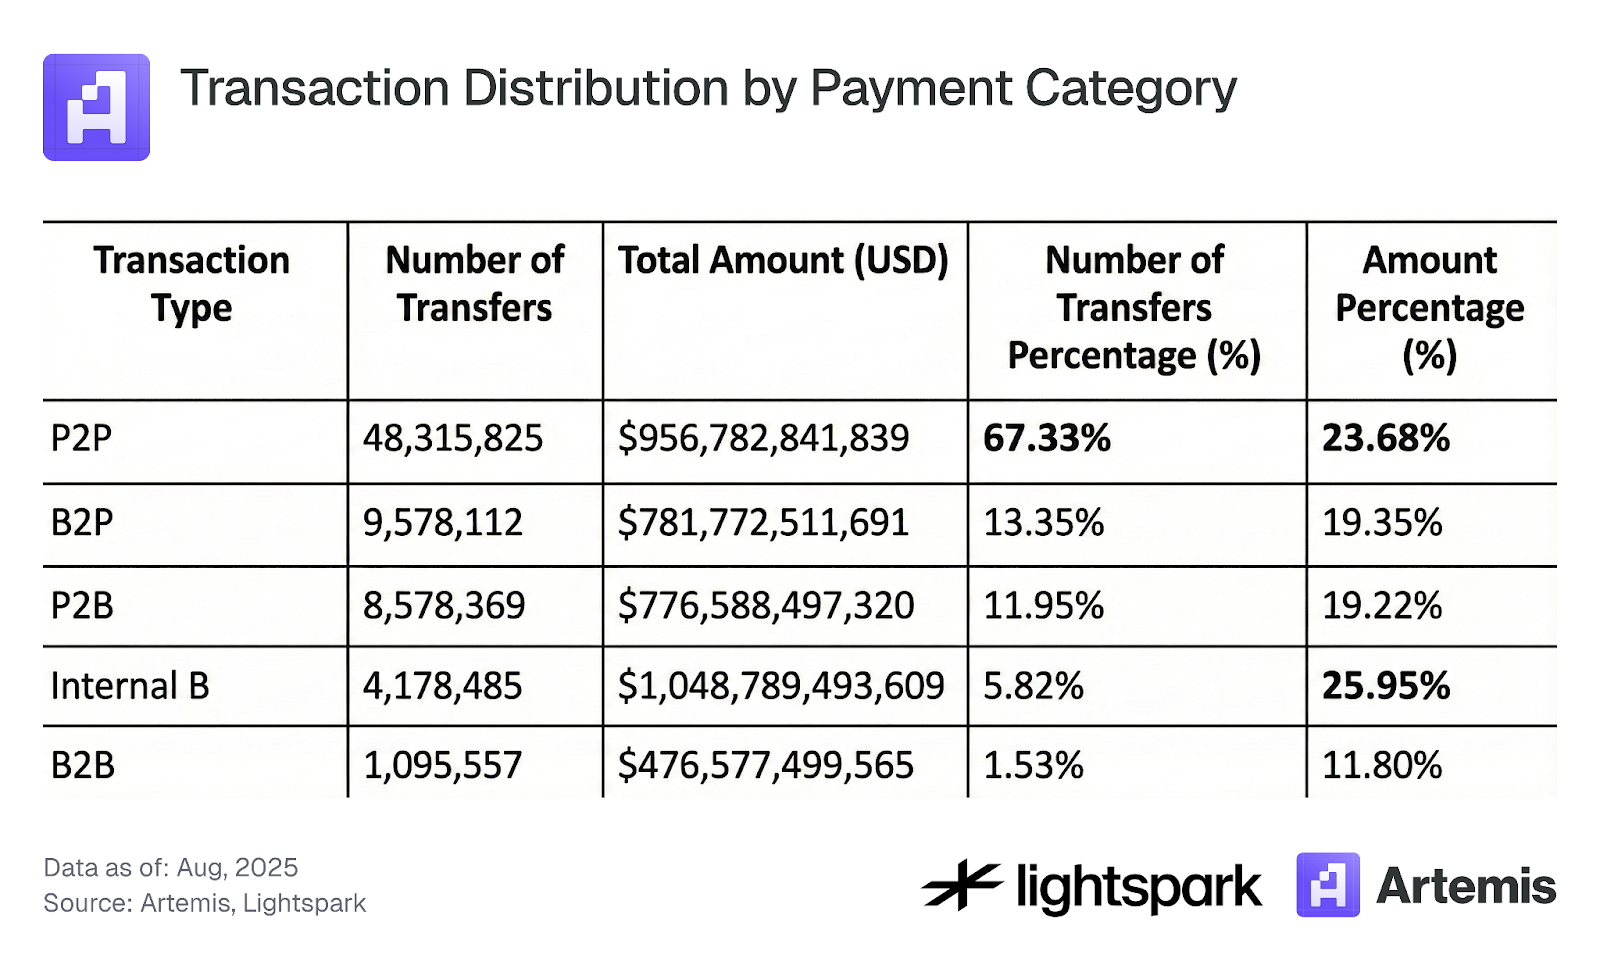
Finally, Figure 4 shows the CDF of transaction amounts by each of the categories. There are clear differences in the CDFs which point out that most transactions of EOA-EOA accounts with low values below $0.1 are P2P transactions, which strengthens the point that they may be driven by bots and manipulated wallets rather than institutions, which are labeled in our dataset. In addition, we see that indeed P2P transactions have a CDF that supports the idea that the majority of transactions are small, while transactions that are labeled as B2B and Internal B have CDFs with much higher transaction values. Finally, P2B and B2P have CDFs that fall between P2P and B2B.
Figure 4: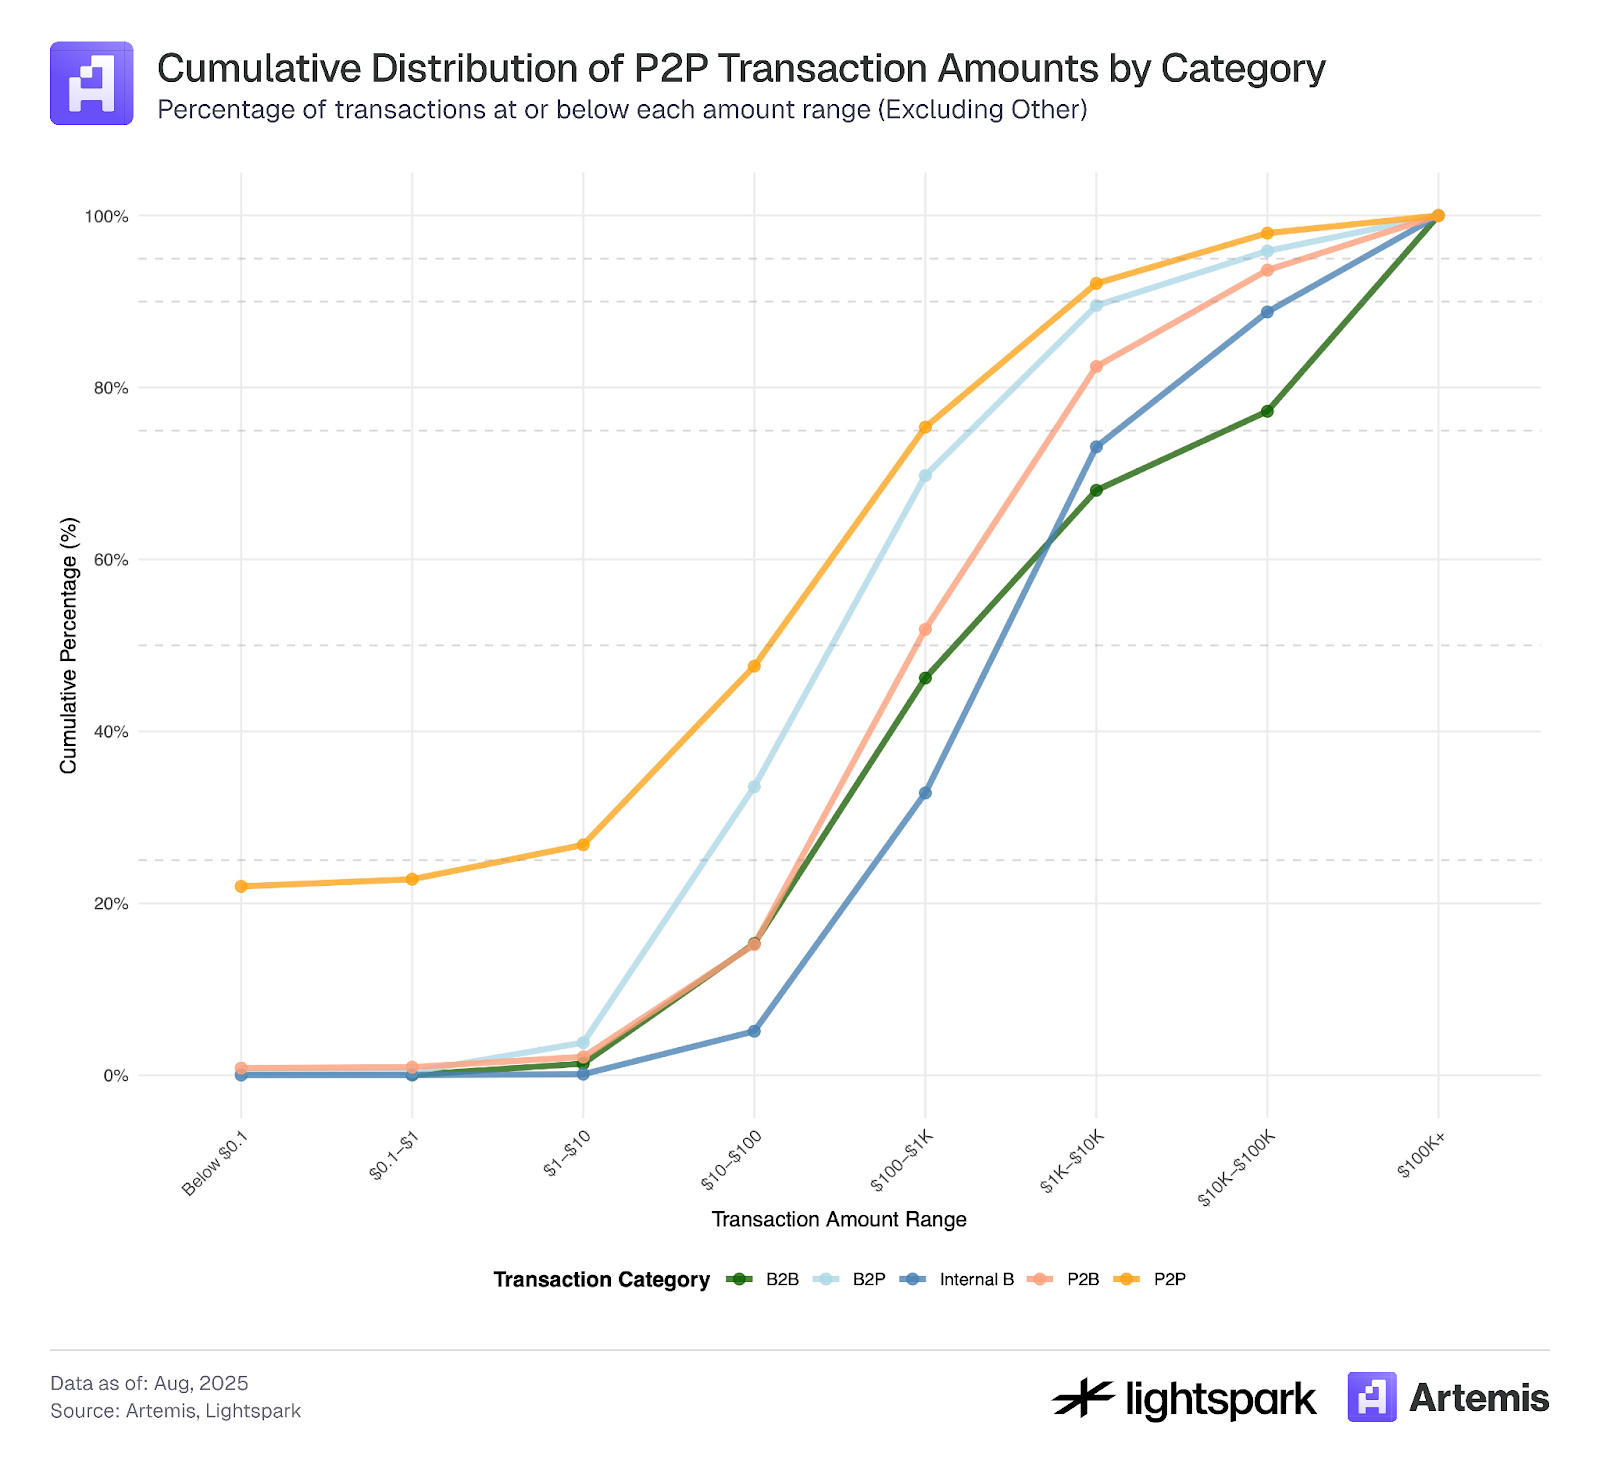
*We used for this analysis a sample of our data that covers transactions from July 4, 2025 through July 31, 2025.
Figures 5 and 6 present the changes over time for each payment category. Figure 5 focuses on weekly movements, where we can see a consistent trend of adoption and increasing weekly volume across all categories, and Table 4 highlights the total changes from August 2024 to August 2025. In addition, Figure 6 shows the differences between weekdays and weekends over time, where we can see clear patterns that payments are reduced over weekends. In general there is an increase in the usage of payments on both weekdays and weekends over time across all categories.
Figure 5: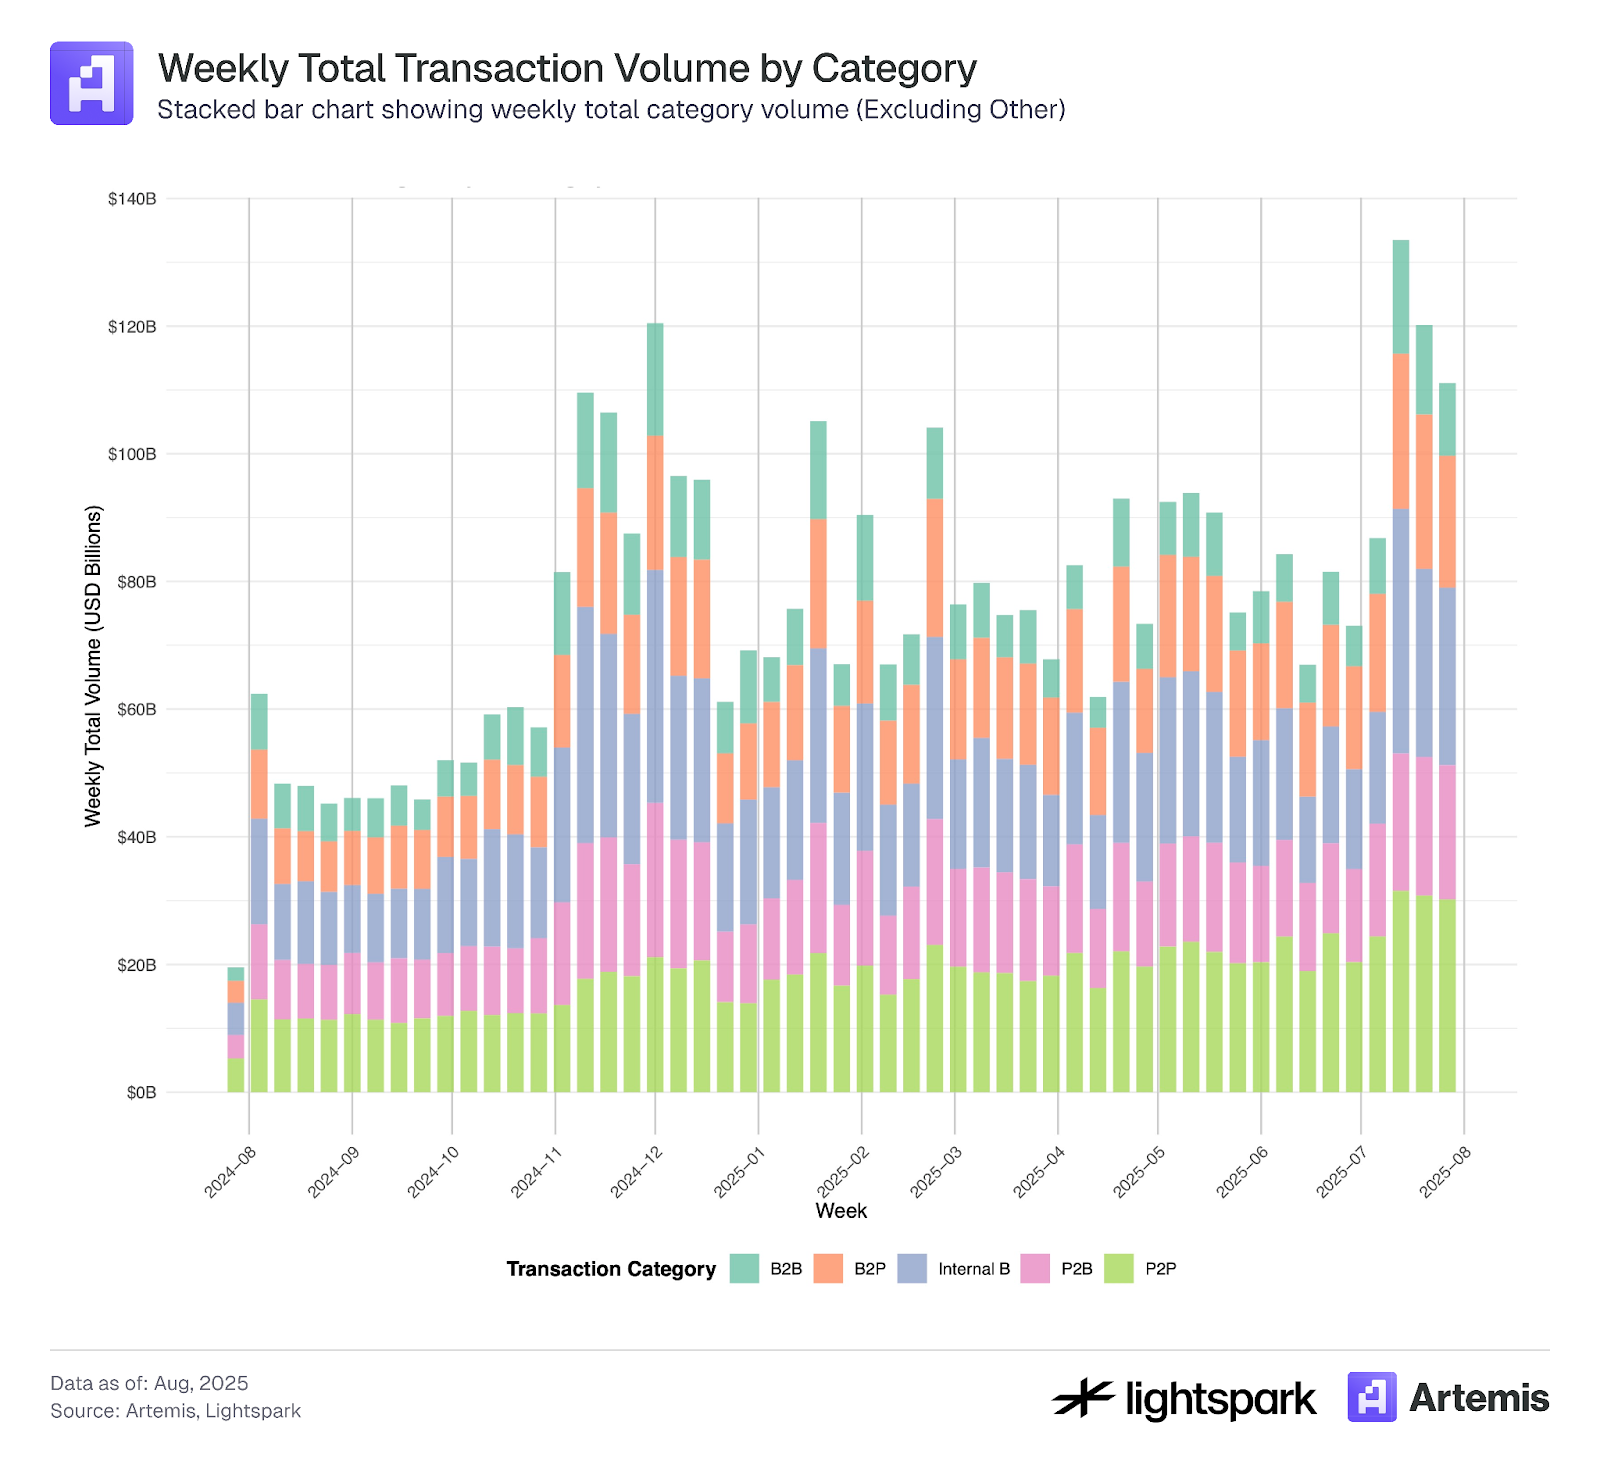
Figure 6: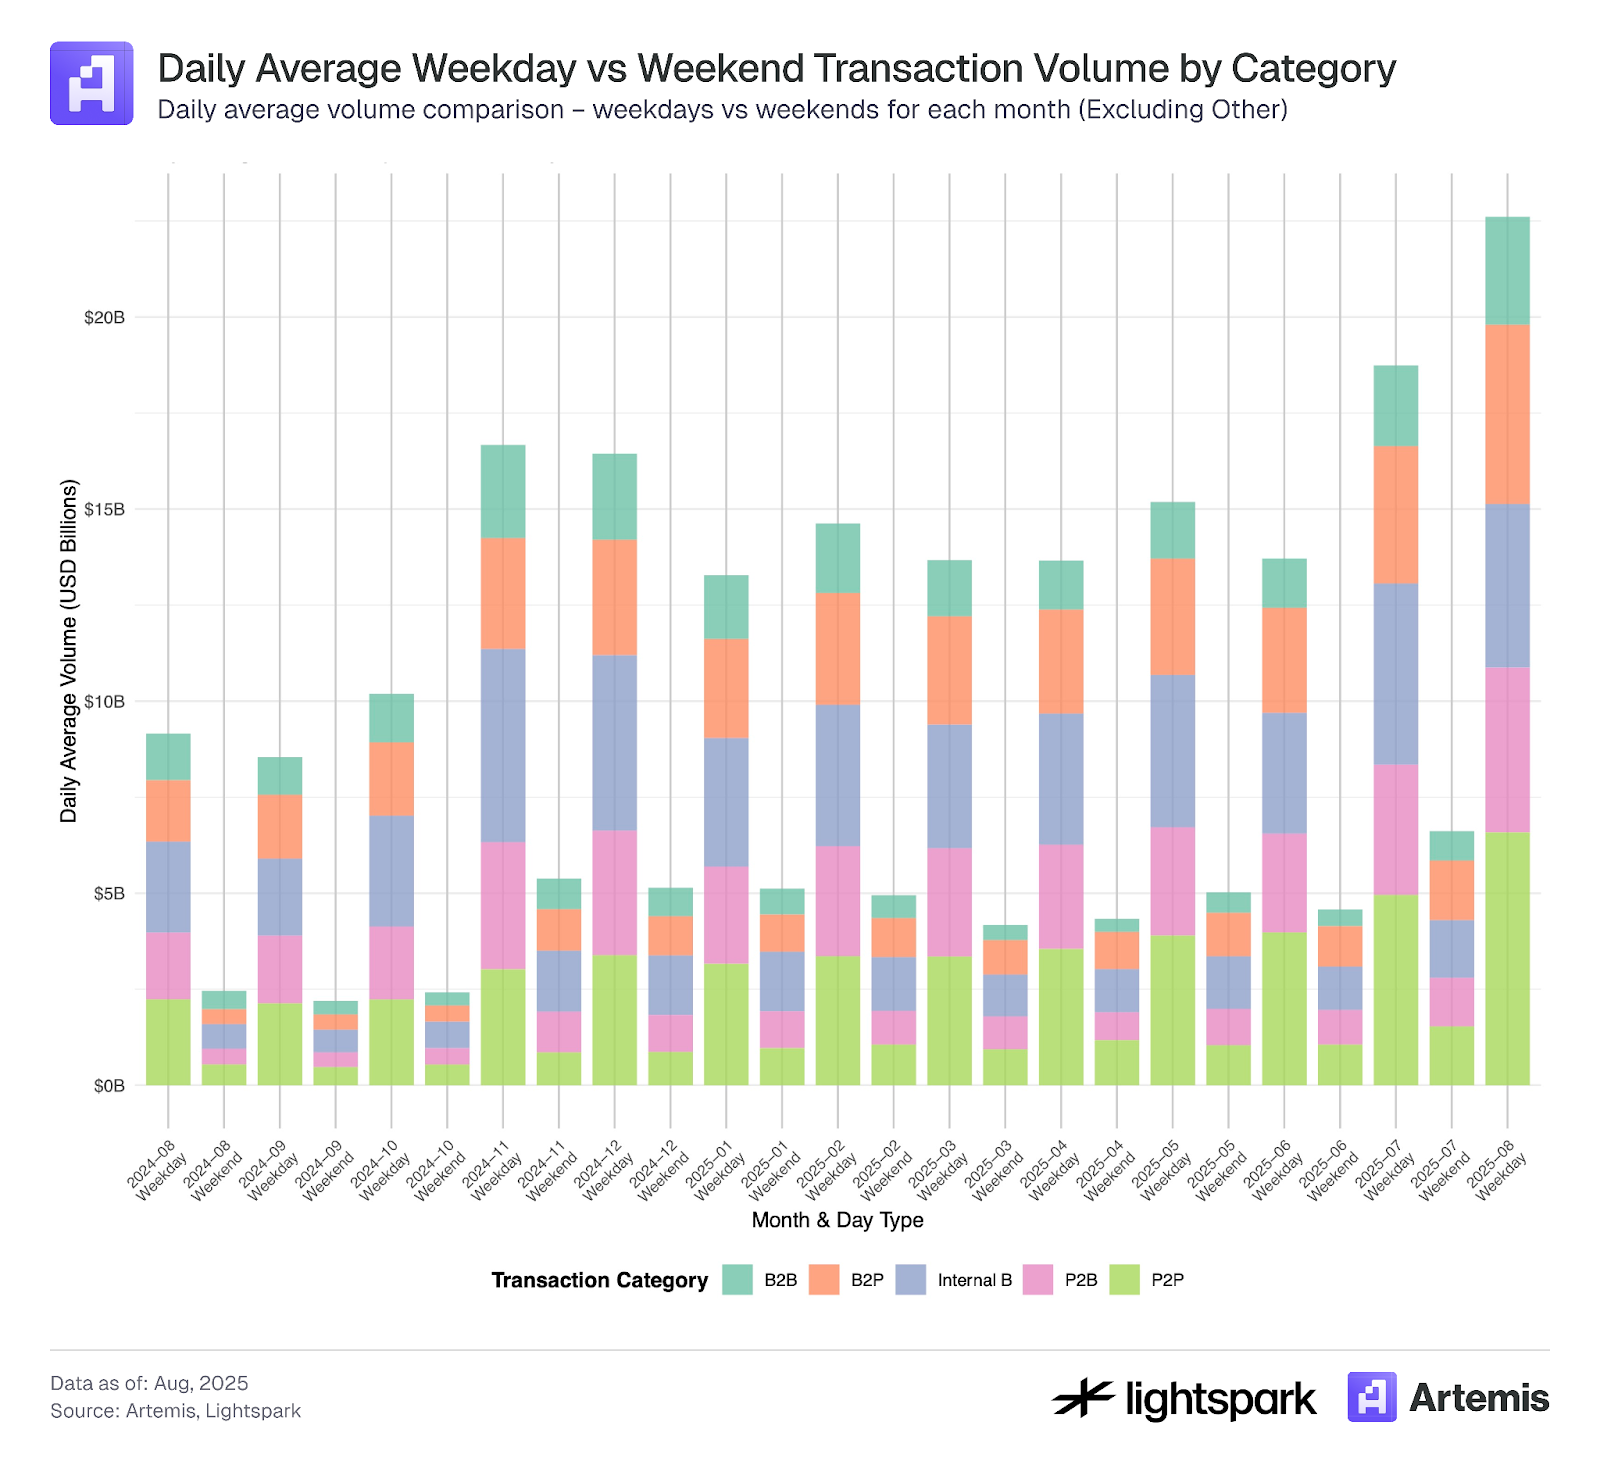
Table 4: Payment Volume, Count, and Transaction Size Changes Over Time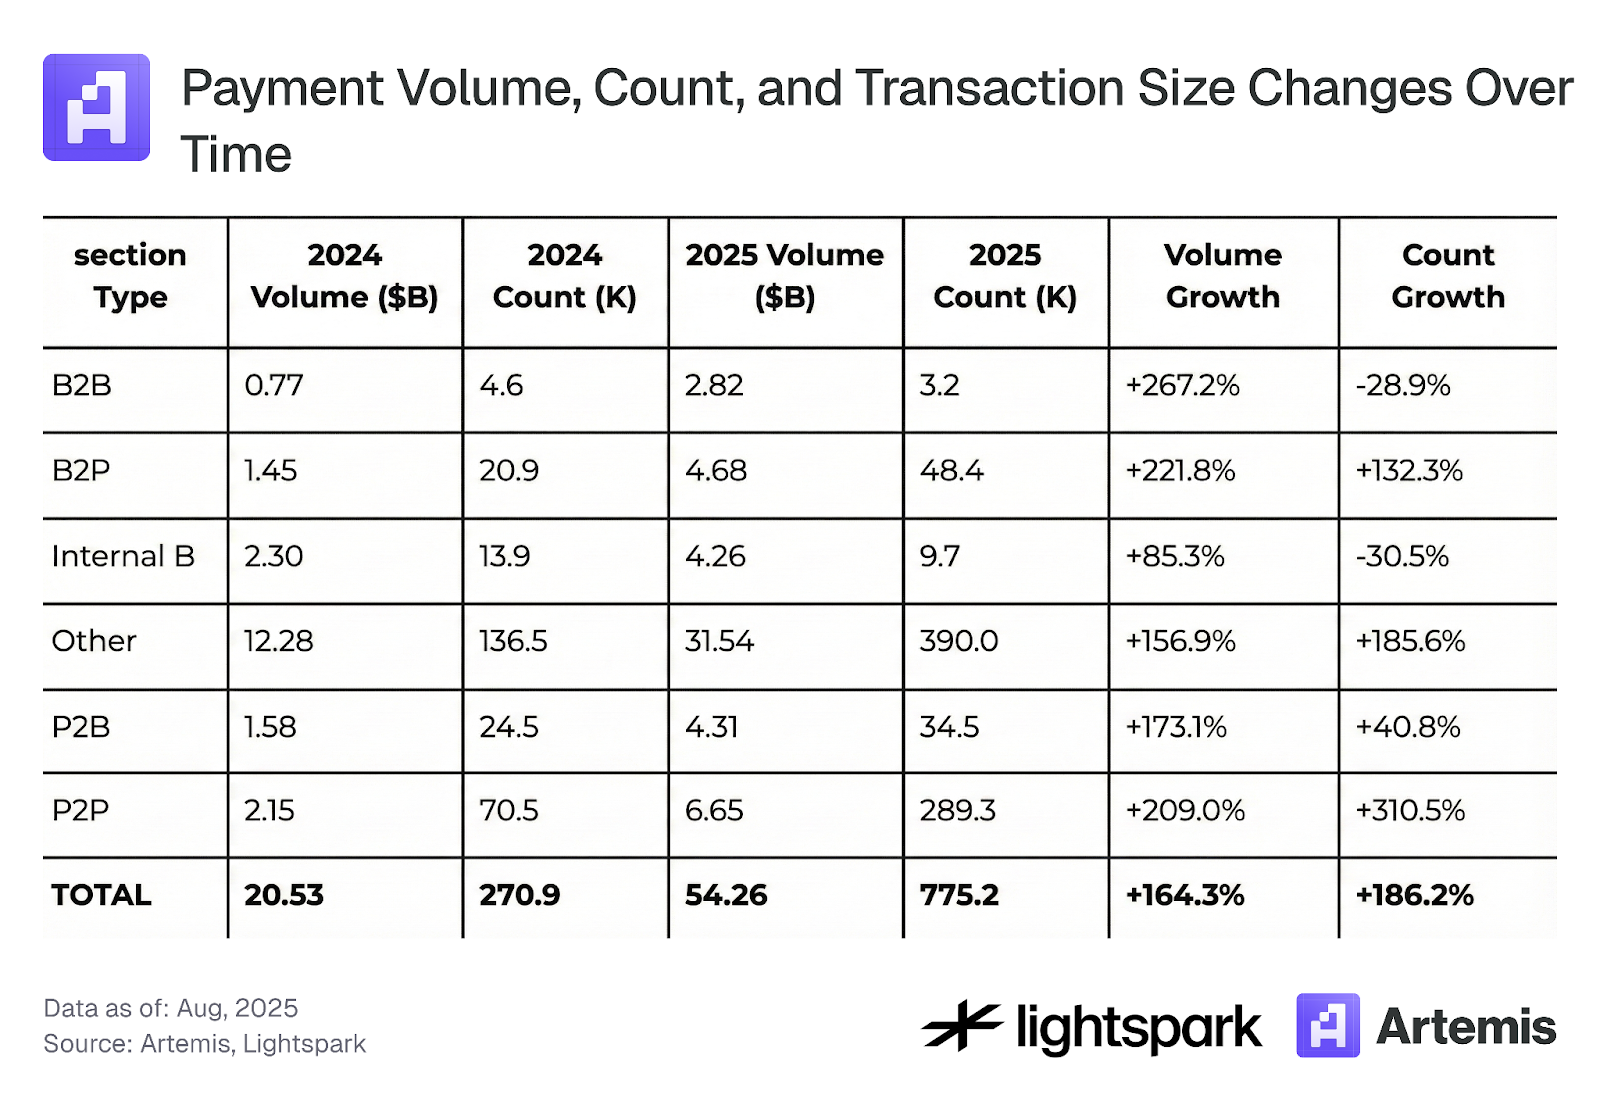
3.3 Concentration of Stablecoin Transactions
In Figure 9, we calculate the concentration rate of the top sender wallets that are sending stablecoin tokens via the Ethereum blockchain. It is clear that the majority of stablecoin transfers are concentrated among a few wallets, where the top 1,000 wallets in our sample period are contributing to the majority of the volume at around 84%. This points out that while DeFi and blockchain support and promote decentralization, they are still in some aspects very centralized.
Figure 9: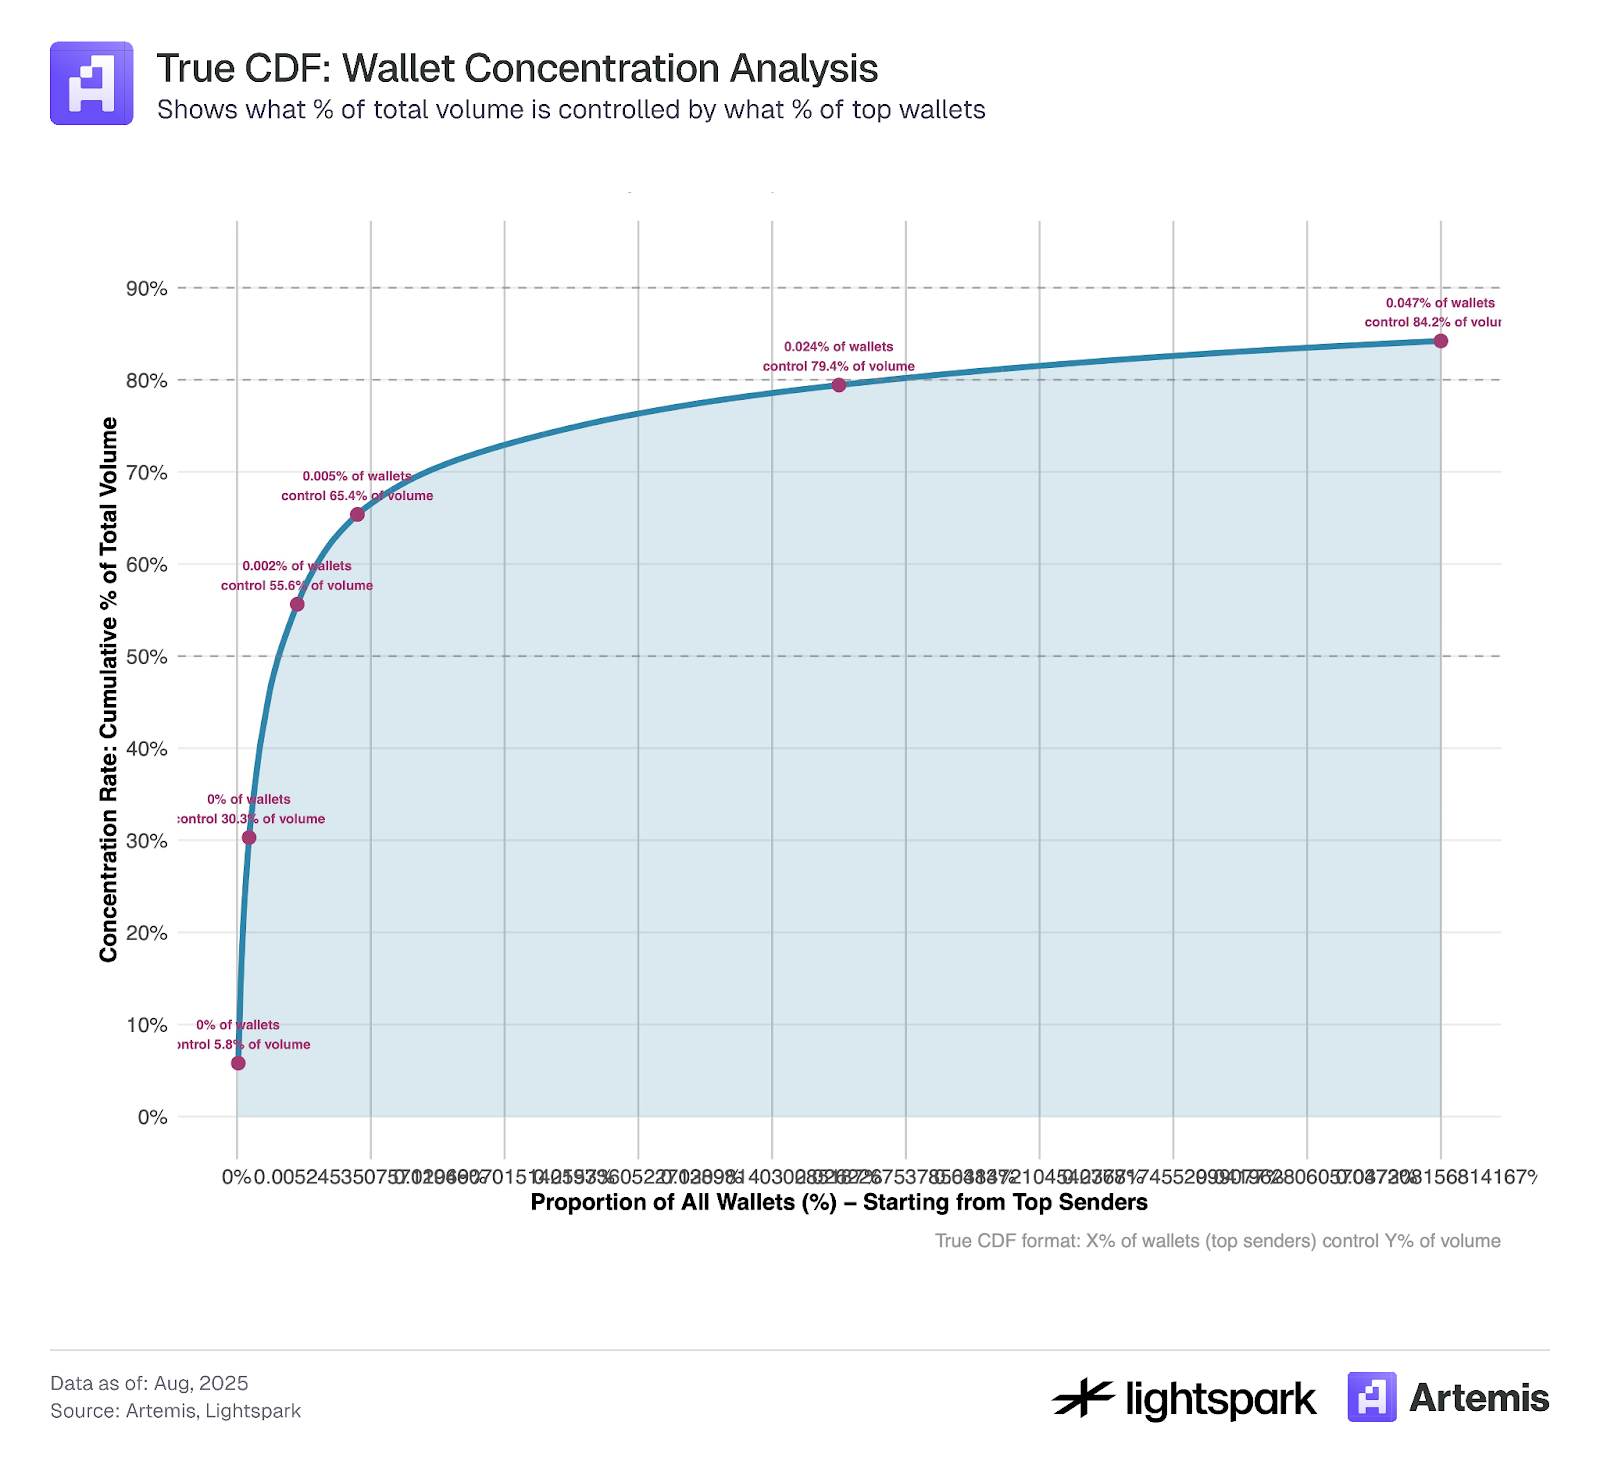
*We used for this analysis a sample of our data that covers transactions from July 4, 2025 through July 31, 2025.
4. Discussion
It is clear that stablecoins are gaining increasing adoption over time, with a significant increase in their volume and number of transactions, which more than doubled from August 2024 to August 2025. A challenging task is to estimate the usage of stablecoins for payments, and more tools are becoming available to help us improve this estimation. This work sheds some light on and provides estimates of stablecoin usage for payments documented on the blockchain (Ethereum) using Artemis labeling data. Our estimation suggests that stablecoin payments account for 47% (35% without Internal B transactions) of the total volume (all row data). Our estimation can be seen as an upper bound given that we put less restriction on the classification of payments rather than being an EOA-EOA transfer. However, researchers can apply further filtering methods such as upper and lower value thresholds for transactions based on their considerations and goals. For example, adding a $0.1 restriction can ignore low-value transaction manipulation as covered in section 3.1.
When further labeling payment transactions into P2P, B2B, P2B, B2P, and Internal B transactions using Artemis labeling data in section 3.2, we find that P2P payments represent only a 23.7% (11.3%) share of total payments (all raw data). Previous studies have pointed out that stablecoin payments contribute around 25% for P2P payments, and we obtain similar results. Finally, in section 3.3 we observed that in terms of volume, the majority of stablecoin transactions is centralized by the top 1,000 wallets. This opens an interesting question: is stablecoin usage developing as a vehicle for payments run by intermediaries and big firms, or as a P2P transaction settlement, which time will tell.
References
- Yaish, A., Chemaya, N., Cong, L. W., & Malkhi, D. (2025). Inequality in the Age of Pseudonymity. arXiv preprint arXiv:2508.04668.
- Awrey, D., Jackson, H. E., & Massad, T. G. (2025). Stable Foundations: Towards a Robust and Bipartisan Approach to Stablecoin Legislation. Available at SSRN 5197044.
- Halaburda, H., Livshits, B., & Yaish, A. (2025). Platform building with fake consumers: On double dippers and airdrop farmers. NYU Stern School of Business Research Paper Forthcoming.
- Cong, L. W., Li, X., Tang, K., & Yang, Y. (2023). Crypto wash trading. Management Science, 69(11), 6427-6454.
Link: https://www.stablecoin.fyi/#stablecoin-payments-by-type
Disclaimer:
- This article is reprinted from [Artemis]. All copyrights belong to the original author [Artemis]. If there are objections to this reprint, please contact the Gate Learn team, and they will handle it promptly.
- Liability Disclaimer: The views and opinions expressed in this article are solely those of the author and do not constitute any investment advice.
- Translations of the article into other languages are done by the Gate Learn team. Unless mentioned, copying, distributing, or plagiarizing the translated articles is prohibited.
Share


Related Articles

In-depth Explanation of Yala: Building a Modular DeFi Yield Aggregator with $YU Stablecoin as a Medium
What is Stablecoin?

Top 15 Stablecoins

A Complete Overview of Stablecoin Yield Strategies

Stripe’s $1.1 Billion Acquisition of Bridge.xyz: The Strategic Reasoning Behind the Industry’s Biggest Deal.