Trade
Basic
Futures
Futures
Hundreds of contracts settled in USDT or BTC
TradFi
Gold
Trade global traditional assets with USDT in one place
Options
Hot
Trade European-style vanilla options
Unified Account
Maximize your capital efficiency
Demo Trading
Futures Kickoff
Get prepared for your futures trading
Futures Events
Participate in events to win generous rewards
Demo Trading
Use virtual funds to experience risk-free trading
Earn
Launch
CandyDrop
Collect candies to earn airdrops
Launchpool
Quick staking, earn potential new tokens
HODLer Airdrop
Hold GT and get massive airdrops for free
Launchpad
Be early to the next big token project
Alpha Points
Trade on-chain assets and enjoy airdrop rewards!
Futures Points
Earn futures points and claim airdrop rewards
Investment
Simple Earn
Earn interests with idle tokens
Auto-Invest
Auto-invest on a regular basis
Dual Investment
Buy low and sell high to take profits from price fluctuations
Soft Staking
Earn rewards with flexible staking
Crypto Loan
0 Fees
Pledge one crypto to borrow another
Lending Center
One-stop lending hub
VIP Wealth Hub
Customized wealth management empowers your assets growth
Private Wealth Management
Customized asset management to grow your digital assets
Quant Fund
Top asset management team helps you profit without hassle
Staking
Stake cryptos to earn in PoS products
Smart Leverage
New
No forced liquidation before maturity, worry-free leveraged gains
GUSD Minting
Use USDT/USDC to mint GUSD for treasury-level yields
More
ROLI
Risk assets rebound across the board: Bitcoin hits a monthly high, while Japanese and Korean indices follow. Has the global liquidity inflection point arrived?
249
- Reward
- like
- Comment
- Repost
- Share
Live Crypto Trade Signals & Market Analysis
0
- Reward
- like
- Comment
- Repost
- Share
Shedding worldly vanity and staying true to the inner self.
Not craving vanity, not seeking shortcuts,
Treating others with sincerity, doing things with steady effort.
Prefer simplicity over cleverness, prefer honesty over deceit.
Take it slow, be steady, stay genuine,
In a world full of chaos, keep your original intention,
Steady progress leads to long-term success.
I am not crossing, only crossing with those who are in sync with me.
Currently, the price of the second pancake is around 2105.
Recommended to go short.
Take profit at 2085-2065-2025.
Stop loss at 2125, cut loss at 2140.
Personal
ETH4,31%

- Reward
- 2
- 1
- Repost
- Share
不渡非物 :
:
The empty position entered around 2105 on the second pancake. Record it in real-time, mainly focusing on real-time updates.宇将军
宇将军
Created By@RebirthOfTheAltcoinWillOnly
Listing Progress
0.00%
MC:
$0.1
More Tokens
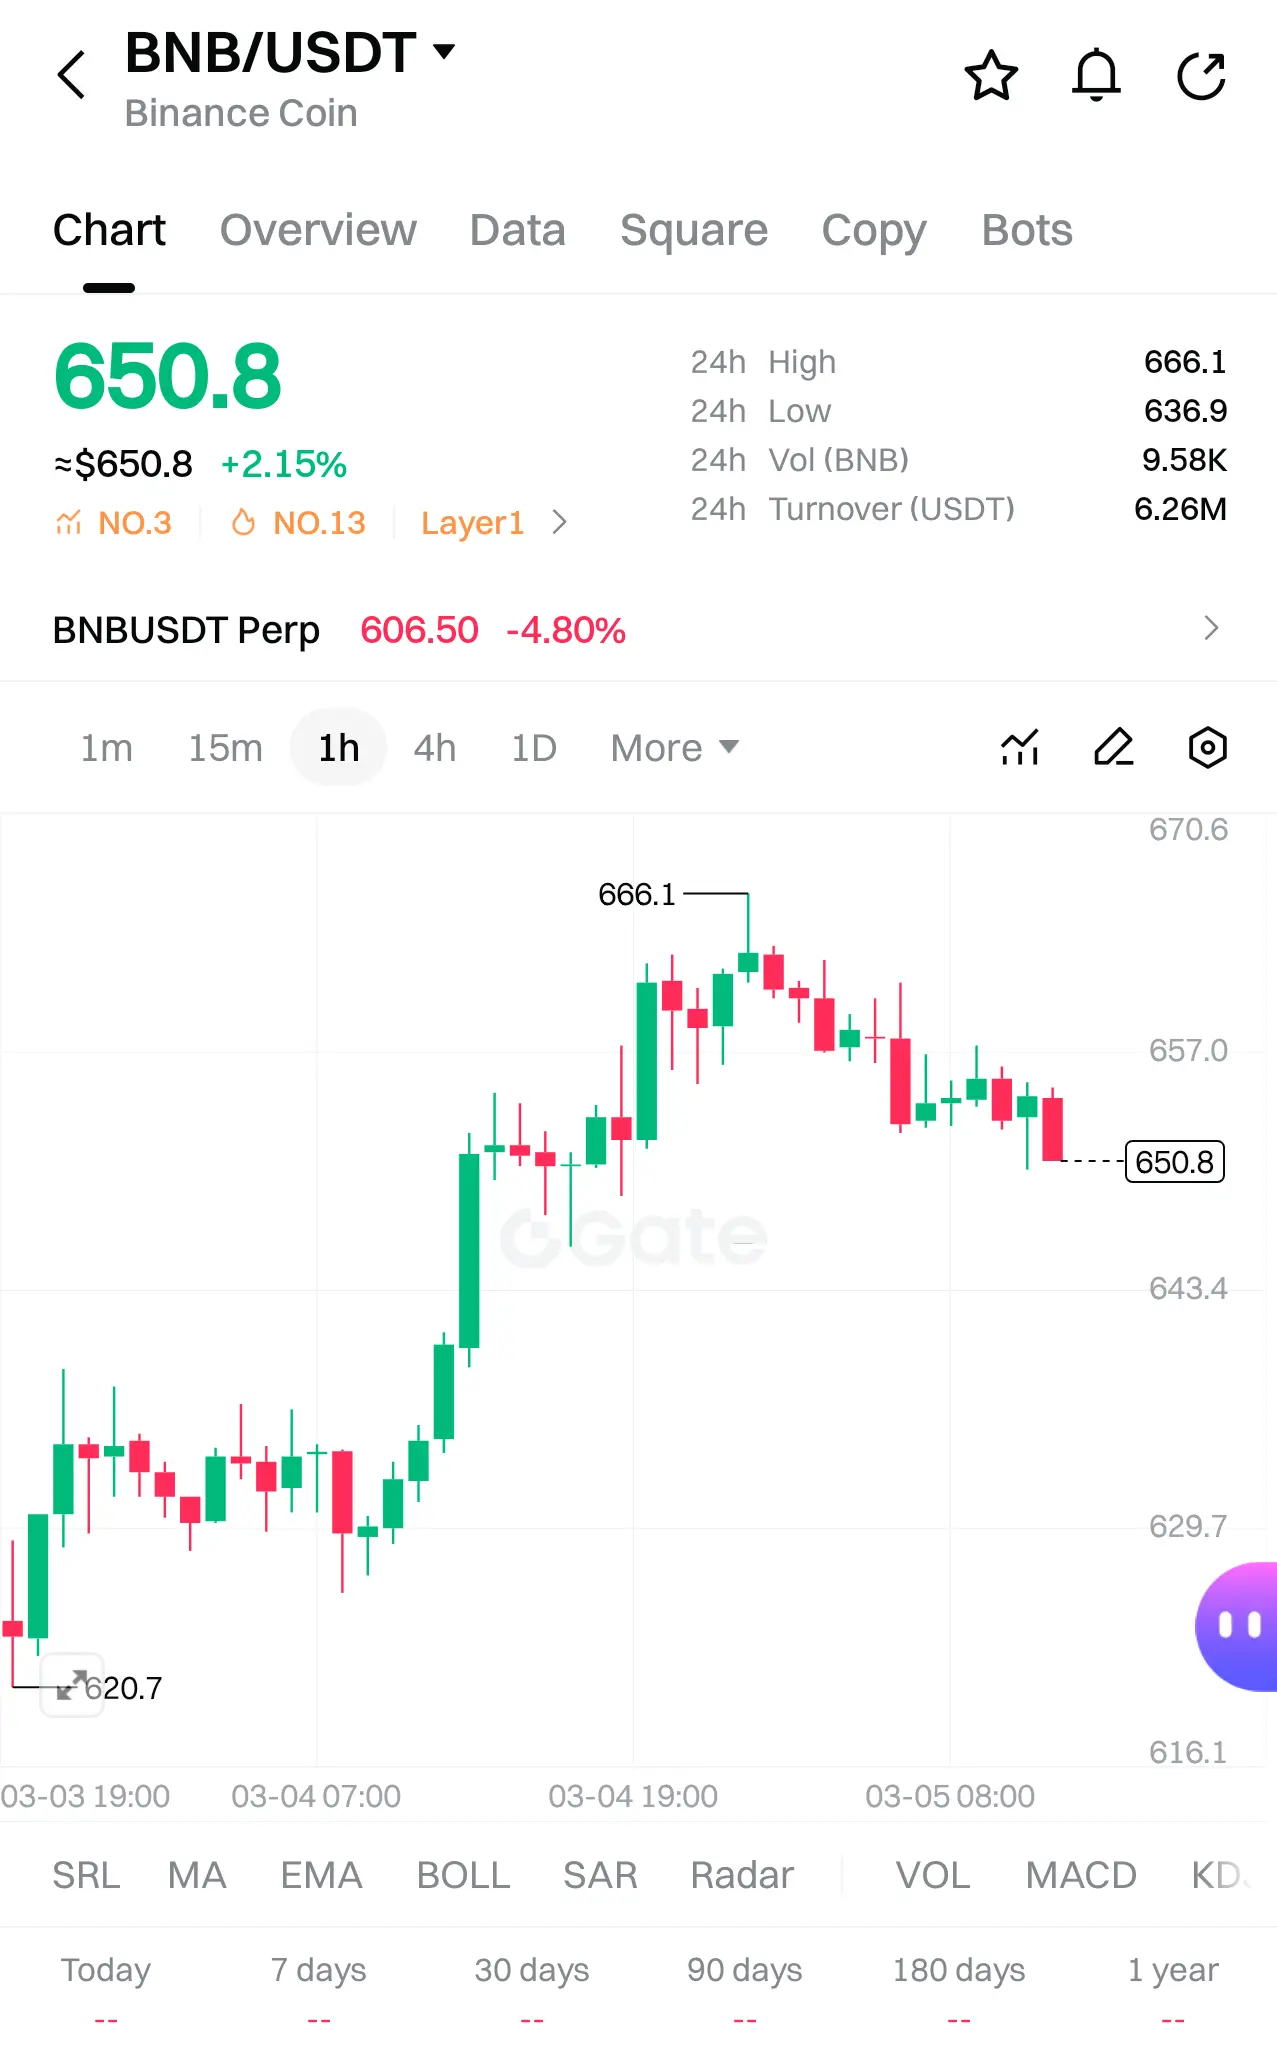
$BNB Bullish continuation building after strong impulse move
I’m seeing buyers step in after the $620 demand defense, pushing price strongly toward $666 resistance. Now price is consolidating around $650, which usually signals the market is preparing for the next move.
Market Read
I’m seeing a clear impulse followed by consolidation. Price is holding above $645 support, and higher lows are forming. If buyers keep defending this zone, another push toward the previous high becomes likely.
Entry Point
$645 — $652
Target Point
TP1 — $666
TP2 — $690
TP3 — $720
Stop Loss
$632
How it's possible
I’m s
BNB1,4%
- Reward
- 3
- Comment
- Repost
- Share
- Reward
- like
- Comment
- Repost
- Share
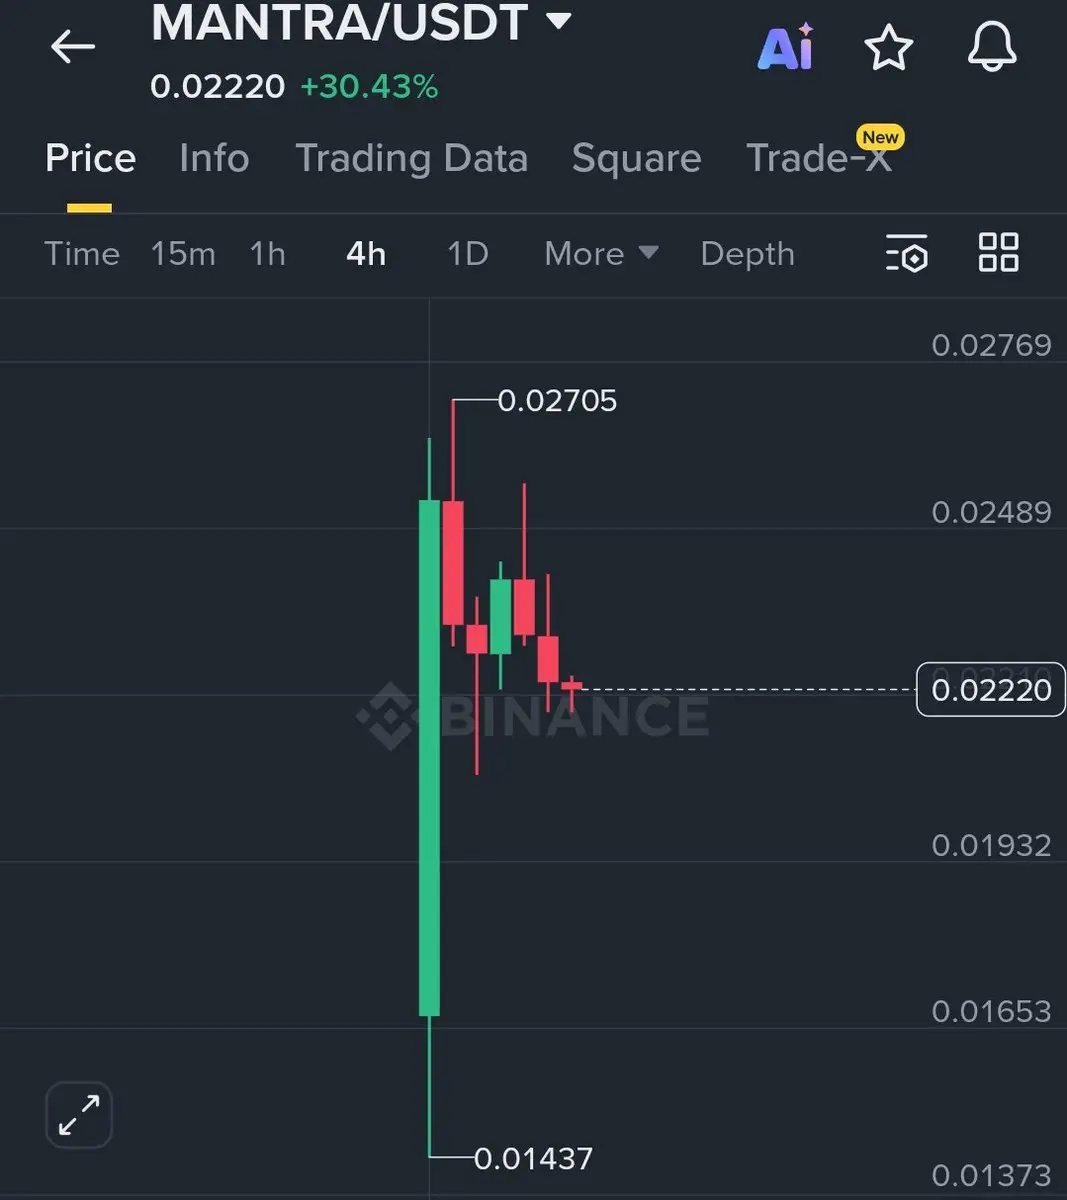
$MANTRA is just starting the show again.
The team has probably learnt the lessons from past mistakes.
Time to send it to $0.1
Bullish on RWAs.
The team has probably learnt the lessons from past mistakes.
Time to send it to $0.1
Bullish on RWAs.
- Reward
- 1
- Comment
- Repost
- Share

- Reward
- 2
- Comment
- Repost
- Share
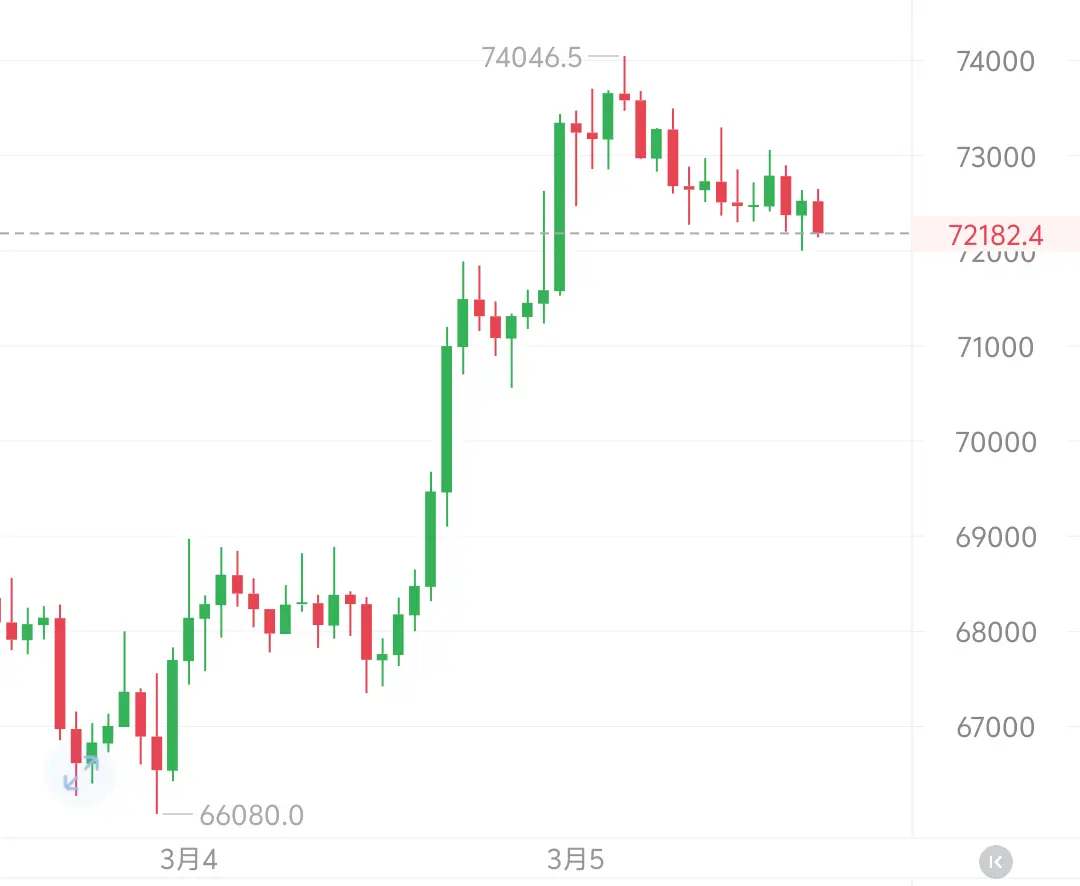
#加密市场上涨 3.5 Daily Bitcoin Market Analysis
From the 15-minute chart, BTC experienced a technical rebound after an early morning dip. The price is temporarily stabilizing near the middle band of the Bollinger Bands, showing some short-term bullish correction momentum:
Short-term: The price has rebounded from the lower Bollinger Band support around 71,143 and is gradually approaching the middle band (72,534). With decreasing volume, a small rebound is likely to continue in the afternoon, testing resistance in the 72,800-73,000 range.
Major trend assessment: There is a short-term rebound, but the
BTC3,47%

- Reward
- like
- Comment
- Repost
- Share
- Reward
- 1
- 1
- Repost
- Share
GateUser-780159bb:
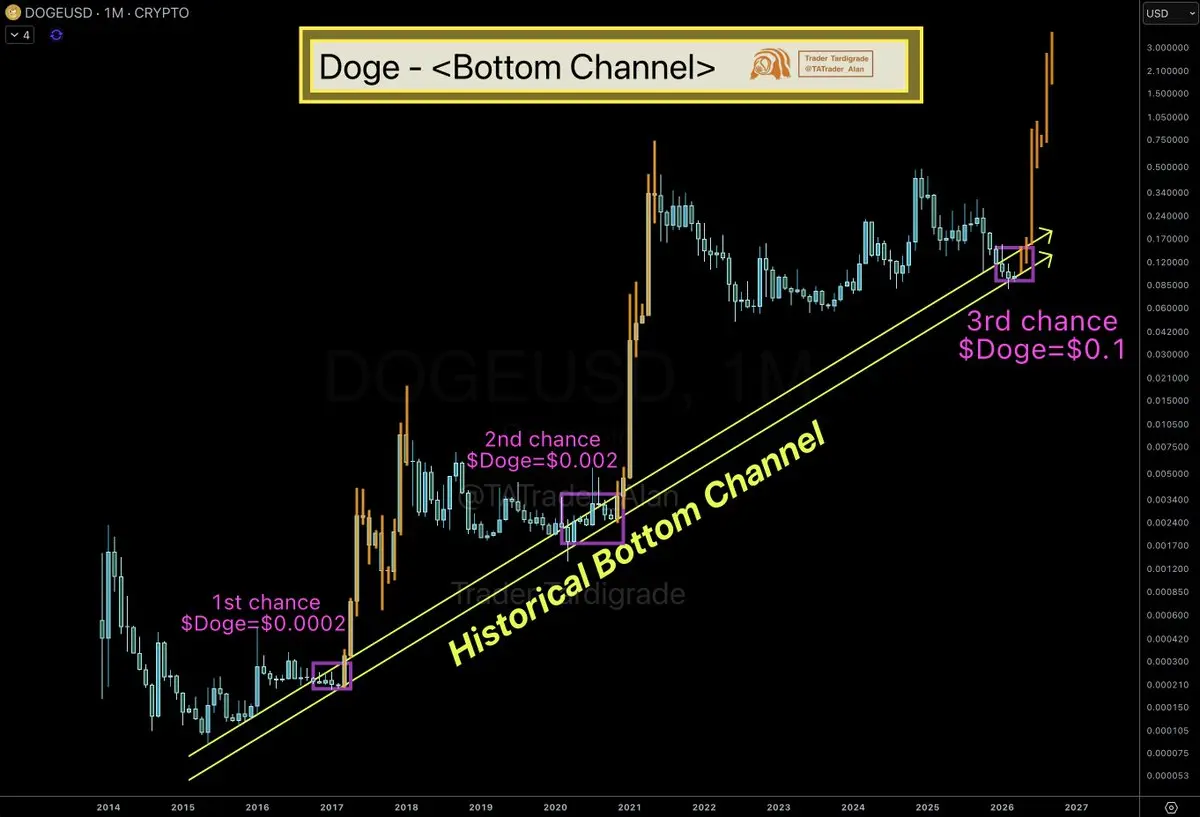
Stay Away from Contracts$Doge/monthly
#Dogecoin has retested the historical bottom support channel for the third time.
Aiming for the $3 target 🔥
#Dogecoin has retested the historical bottom support channel for the third time.
Aiming for the $3 target 🔥
DOGE5,59%
- Reward
- like
- Comment
- Repost
- Share
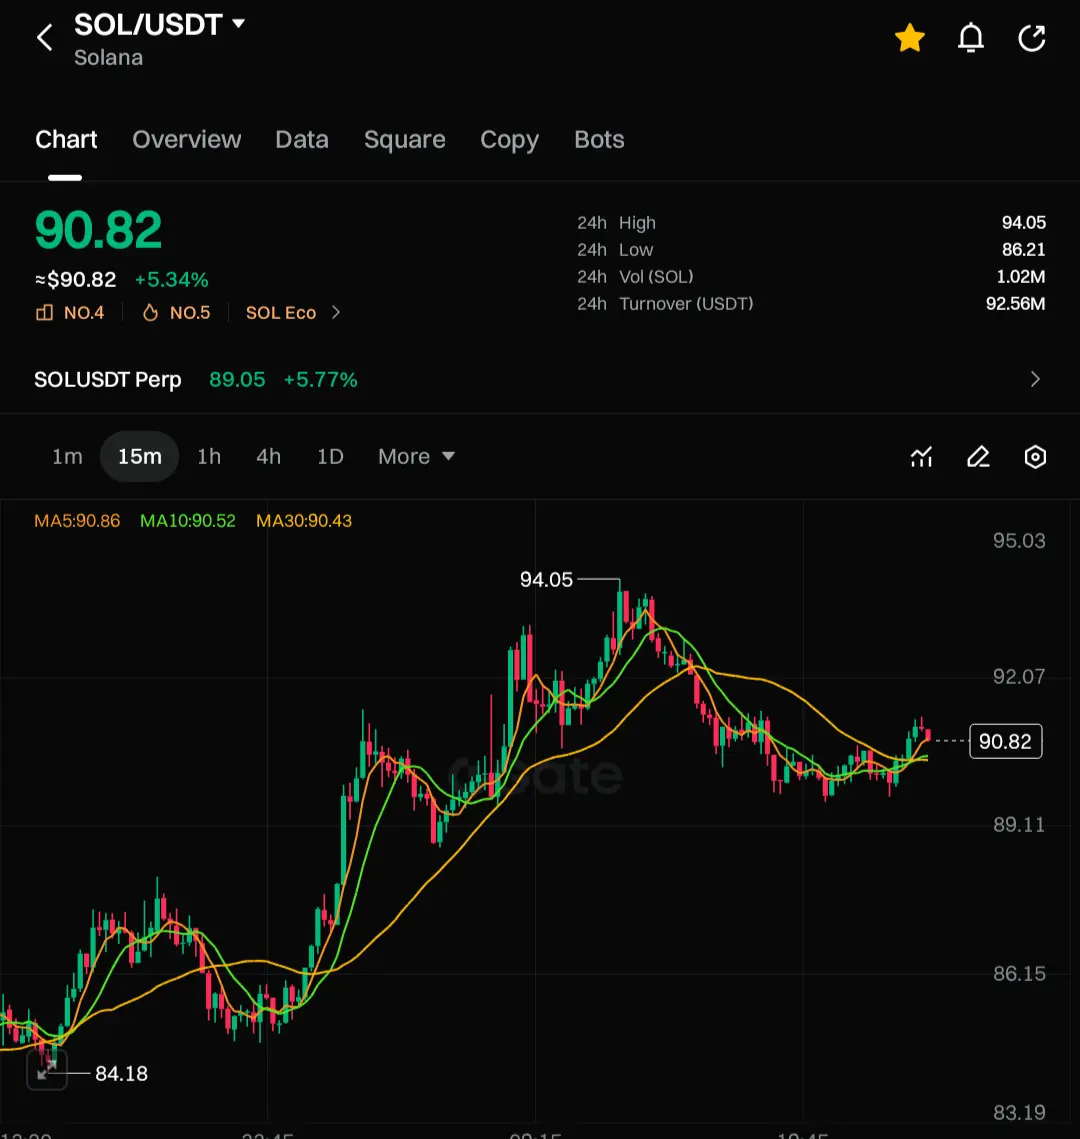
🚀 Solana (SOL/USDT) Uptrend! 🚀$SOL
$SOL has gained 5.34%, currently trading at $90.82, with a recent high of $94.05. The momentum is building as it stays above key support.
🔹 24h High: $94.05
🔹 24h Low: $86.21
🔹 24h Volume (SOL): 1.02M
🔹 24h Turnover (USDT): 92.56M
With the price holding strong and bullish signals intact, $SOL could continue its ascent! 📈🔥#BitcoinHitsOneMonthHigh
SOL2,91%
- Reward
- like
- Comment
- Repost
- Share
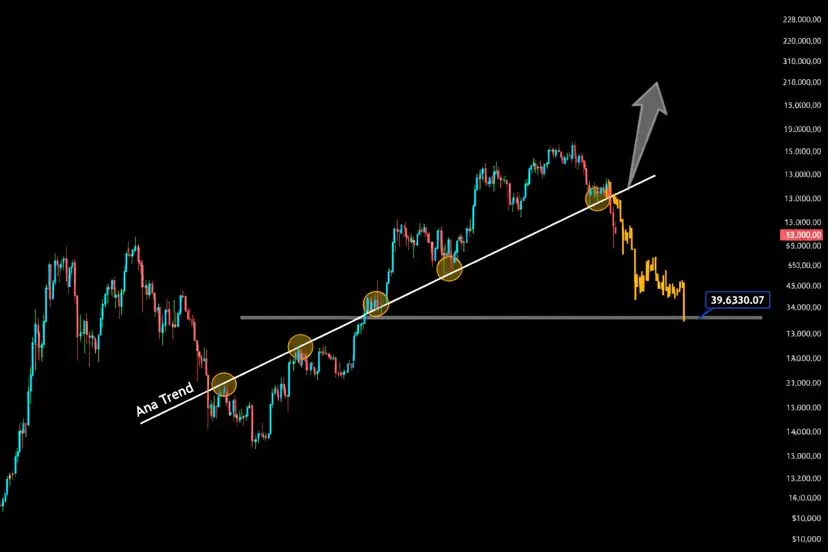
📉 Bitcoin Still Showing Corrective Structure
From a structural view, Bitcoin still looks corrective, not a confirmed recovery. Price has struggled to reclaim key resistance, and momentum remains fragile.
If selling pressure builds, $60K becomes the key level. Losing it could expose another liquidity pocket below the current range, suggesting the short-term bottom isn’t in yet.
One longer-term scenario to watch: a deeper correction later in the cycle that could search for stronger support near $40K before stabilizing.
Unlike past tops, this cycle hasn’t seen extreme euphoria, which sometimes l
BTC3,47%
- Reward
- 2
- Comment
- Repost
- Share
p小将
p小将
Created By@DreamJourney
Listing Progress
100.00%
MC:
$1.76K
More Tokens
Thursday, the afternoon of the 3.5th, BTC/ETH Silk Share
Bitcoin has currently fallen back below the 7-day moving average (72514.2), indicating a shift from a strong to a weak short-term pattern. The 30-day moving average (71453.1) now serves as an important support line. If this level is broken, the downside potential could further expand. On the hourly chart, the candlesticks have been consecutively bearish, and the bearish momentum has not yet been fully released. There is still a possibility of further decline in the short term.
Trading Suggestions:
Buy within the 72500-73000 range with a
View OriginalBitcoin has currently fallen back below the 7-day moving average (72514.2), indicating a shift from a strong to a weak short-term pattern. The 30-day moving average (71453.1) now serves as an important support line. If this level is broken, the downside potential could further expand. On the hourly chart, the candlesticks have been consecutively bearish, and the bearish momentum has not yet been fully released. There is still a possibility of further decline in the short term.
Trading Suggestions:
Buy within the 72500-73000 range with a

- Reward
- 2
- Comment
- Repost
- Share
🎯 Comments Reward|March 4th Leaderboard Update
Congratulations to this period's winners: Princess of Bitcoin · Picked a Big One · u Infinite Possibilities
🎁 Successfully making the list grants you a chance to win Gate merchandise
Join Gate Live, discuss trending topics with hosts, and each comment increases your chances of winning!
Don't be discouraged if you don't win this time—opportunities are available every day!
👉 Sign up now: https://gate.com/questionnaire/6473
#GateLive #评论有奖 #Giveaway
BTC3,47%

- Reward
- 4
- 2
- Repost
- Share
SiYu :
:
Wishing you great wealth in the Year of the Horse 🐴View More
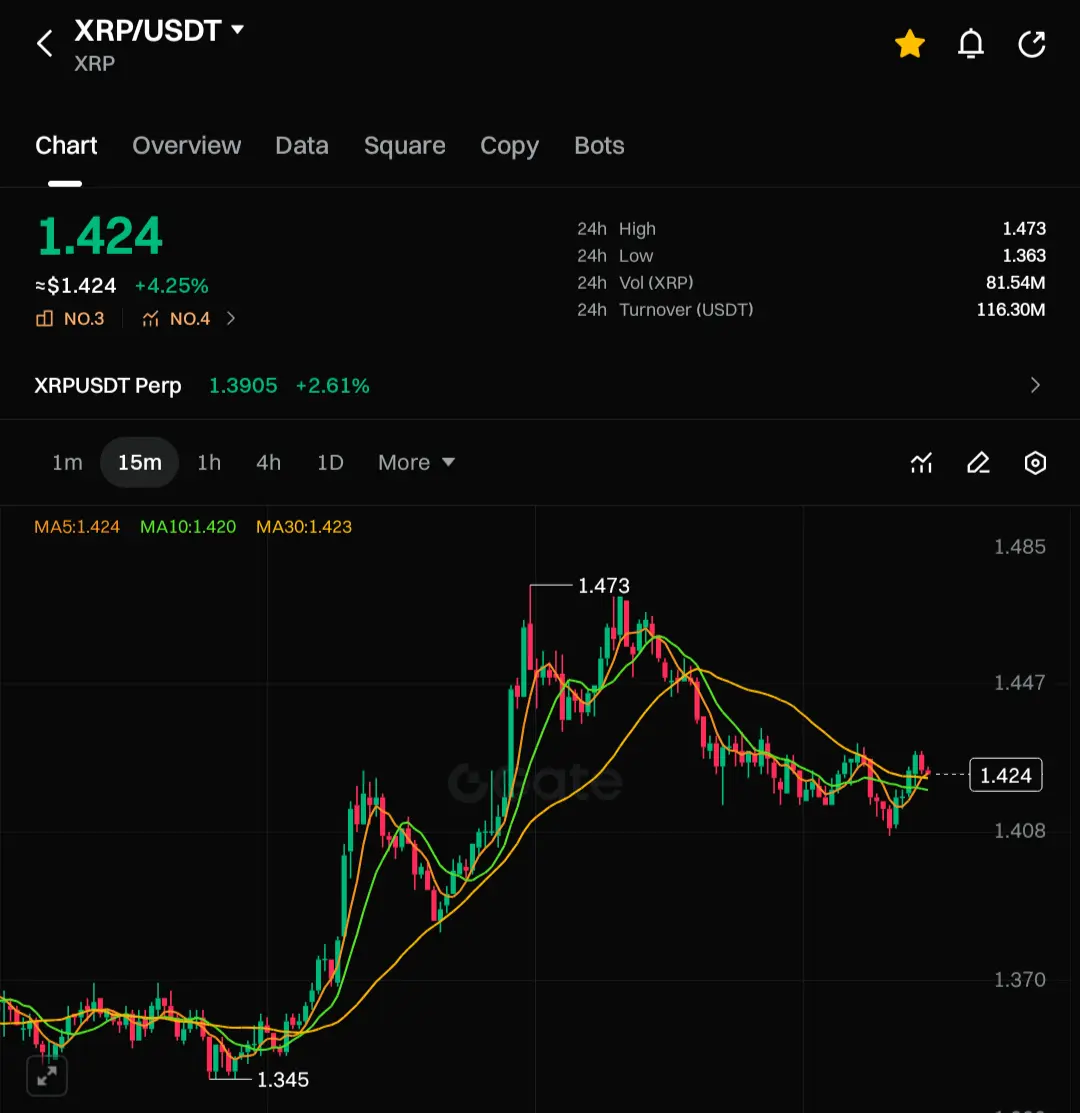
🚀 XRP (XRP/USDT) Bullish Momentum! 🚀$XRP
$XRP has surged 4.25%, currently priced at $1.424, with a recent high of $1.473. The price action is showing strong upward movement, making it one to watch!
🔹 24h High: $1.473
🔹 24h Low: $1.363
🔹 24h Volume (XRP): 81.54M
🔹 24h Turnover (USDT): 116.30M
With the price staying above key support, $XRP could continue its bullish path! 📈🔥
XRP2,69%
- Reward
- like
- Comment
- Repost
- Share
SOL breaks through the range on the 4-hour chart and pulls back
The resistance is clearly at the 92 level
SOL has been performing steadily
It consolidated for 26 days and only yesterday followed the market to break upward
But subsequent buying momentum was insufficient and it was pushed back down
Currently, focus on the 92 level; if it breaks below 88, you can follow the trend to go long
SOL2,91%

- Reward
- like
- Comment
- Repost
- Share
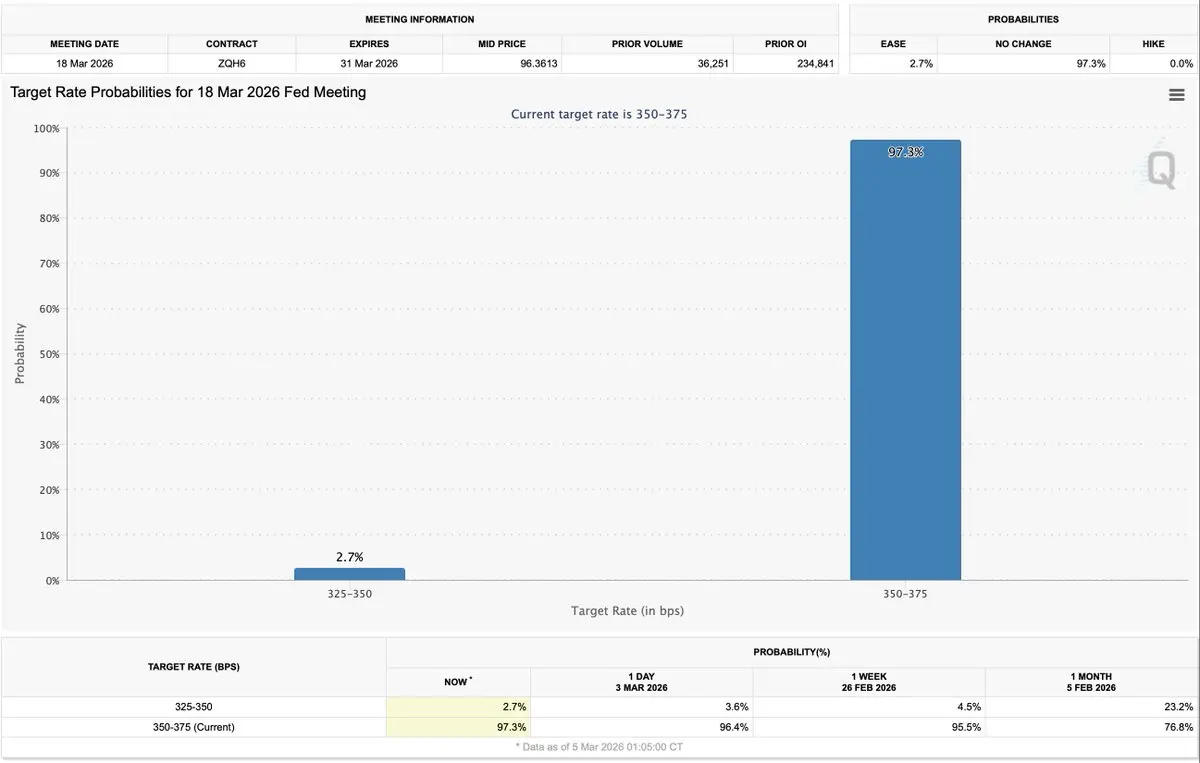
Just 13 days to go....
seems #InterestRates will stay on hold again -
Unless we get any #Inflation shocks (due 11th March)
For now the first cut expectation has been pushed out to September though a lot can change in 6 months that could affect Interest rates, #BTC & #Crypto
seems #InterestRates will stay on hold again -
Unless we get any #Inflation shocks (due 11th March)
For now the first cut expectation has been pushed out to September though a lot can change in 6 months that could affect Interest rates, #BTC & #Crypto
BTC3,47%
- Reward
- 1
- Comment
- Repost
- Share
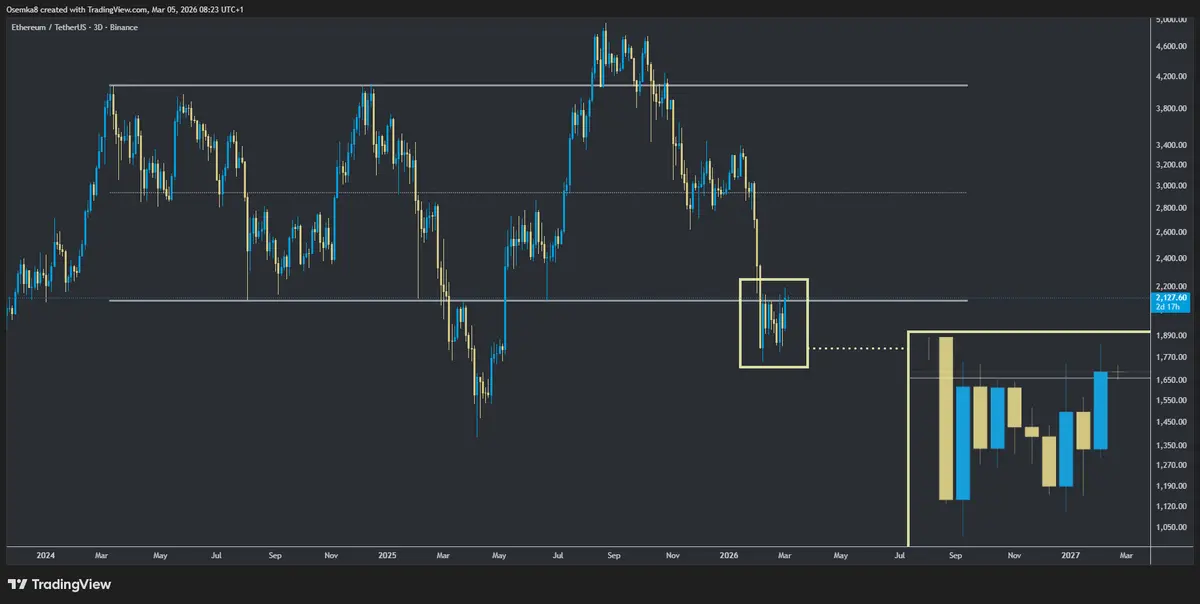
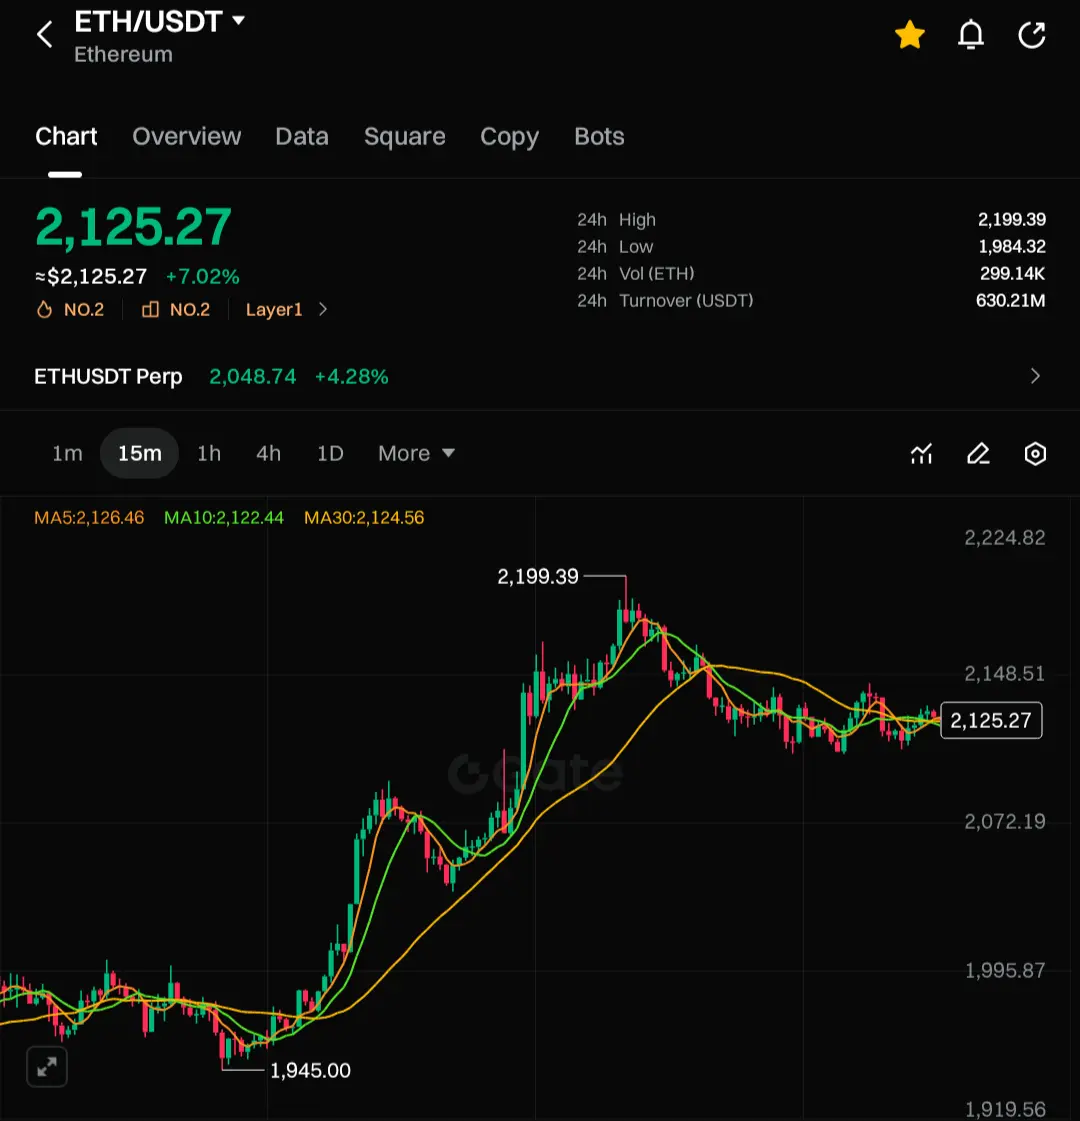
🚀 Ethereum ( $ETH ETH/USDT) Bullish Breakout! 🚀
Ethereum has surged 7.02%, currently priced at $2,125.27, with a recent high of $2,199.39. The market is showing strong upward momentum.
🔹 24h High: $2,199.39
🔹 24h Low: $1,984.32
🔹 24h Volume (ETH): 299.14K
🔹 24h Turnover (USDT): 630.21M
With the price holding above key support levels, Ethereum is poised for further gains. 📈🔥
ETH4,31%
- Reward
- like
- Comment
- Repost
- Share
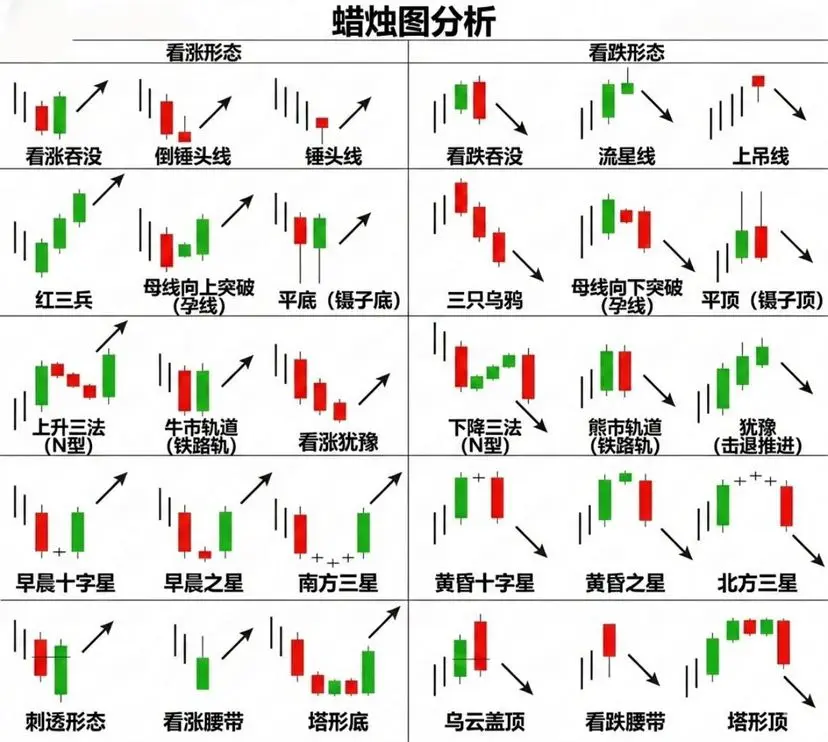
#交易教学
What is K-line (candlestick) analysis?
Japanese candlestick charts (K-line charts) are interval charts that display the highest and lowest prices within a specific time period.
Unlike line charts that only show closing prices, K-line charts allow traders to see not only the closing price but also the opening price as well as the highest and lowest values during that period.
Therefore, K-line charts are a key tool to help us track the price movements (Price Action) of assets throughout the trading session.
View OriginalWhat is K-line (candlestick) analysis?
Japanese candlestick charts (K-line charts) are interval charts that display the highest and lowest prices within a specific time period.
Unlike line charts that only show closing prices, K-line charts allow traders to see not only the closing price but also the opening price as well as the highest and lowest values during that period.
Therefore, K-line charts are a key tool to help us track the price movements (Price Action) of assets throughout the trading session.
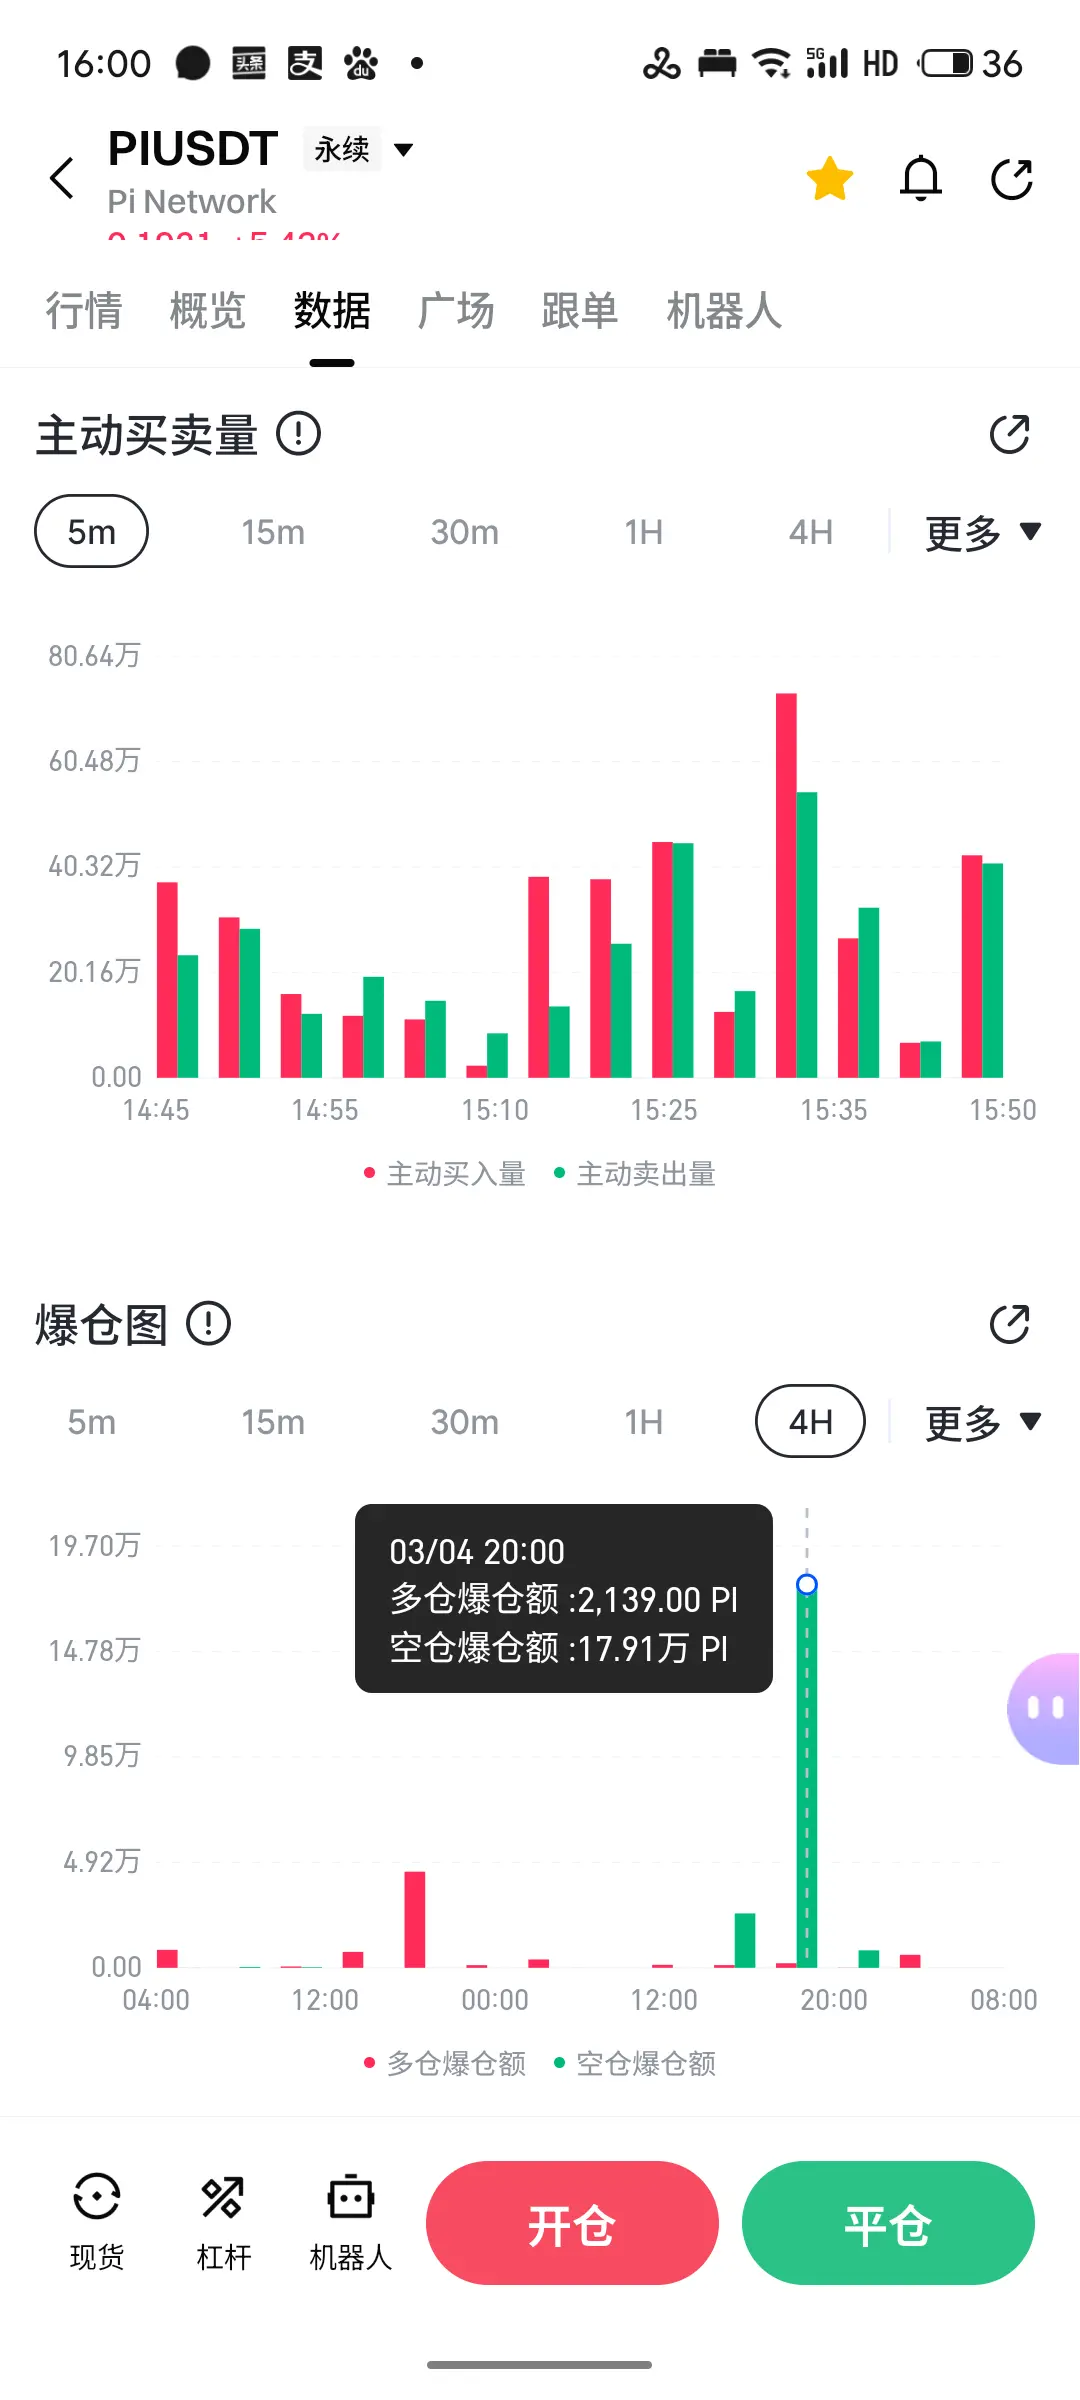
[The user has shared his/her trading data. Go to the App to view more.]
- Reward
- like
- Comment
- Repost
- Share
Load More
Join 40M users in our growing community
⚡️ Join 40M users in the crypto craze discussion
💬 Engage with your favorite top creators
👍 See what interests you
Trending Topics
View More333.84K Popularity
104.79K Popularity
200.54K Popularity
1.58M Popularity
11.87K Popularity
News
View MoreBillions Network launches Verified Agent Identity Skill for the OpenClaw platform and initiates the first AI agent reward program
10 m
Former FTX Future Fund charity team members establish an AI fund to increase investments in mining companies, including Cipher Mining.
11 m
"Maqi" increased their position by 150 ETH long contracts
11 m
Western Union partners with Crossmint to launch the USD stablecoin USDPT on Solana
18 m
Dogecoin price approaches bullish triangle breakout, can retail enthusiasm help it return to the February high?
26 m
Pin