Trade
Basic
Futures
Futures
Hundreds of contracts settled in USDT or BTC
TradFi
Gold
Trade global traditional assets with USDT in one place
Options
Hot
Trade European-style vanilla options
Unified Account
Maximize your capital efficiency
Demo Trading
Futures Kickoff
Get prepared for your futures trading
Futures Events
Participate in events to win generous rewards
Demo Trading
Use virtual funds to experience risk-free trading
Earn
Launch
CandyDrop
Collect candies to earn airdrops
Launchpool
Quick staking, earn potential new tokens
HODLer Airdrop
Hold GT and get massive airdrops for free
Launchpad
Be early to the next big token project
Alpha Points
Trade on-chain assets and enjoy airdrop rewards!
Futures Points
Earn futures points and claim airdrop rewards
Investment
Simple Earn
Earn interests with idle tokens
Auto-Invest
Auto-invest on a regular basis
Dual Investment
Buy low and sell high to take profits from price fluctuations
Soft Staking
Earn rewards with flexible staking
Crypto Loan
0 Fees
Pledge one crypto to borrow another
Lending Center
One-stop lending hub
VIP Wealth Hub
Customized wealth management empowers your assets growth
Private Wealth Management
Customized asset management to grow your digital assets
Quant Fund
Top asset management team helps you profit without hassle
Staking
Stake cryptos to earn in PoS products
Smart Leverage
New
No forced liquidation before maturity, worry-free leveraged gains
GUSD Minting
Use USDT/USDC to mint GUSD for treasury-level yields
More
MissCrypto
🔹 Bearish exhaustion? Bitcoin's downward momentum slows, but the structure remains in bear territory.
1.178
- Reward
- 1
- Comment
- Repost
- Share
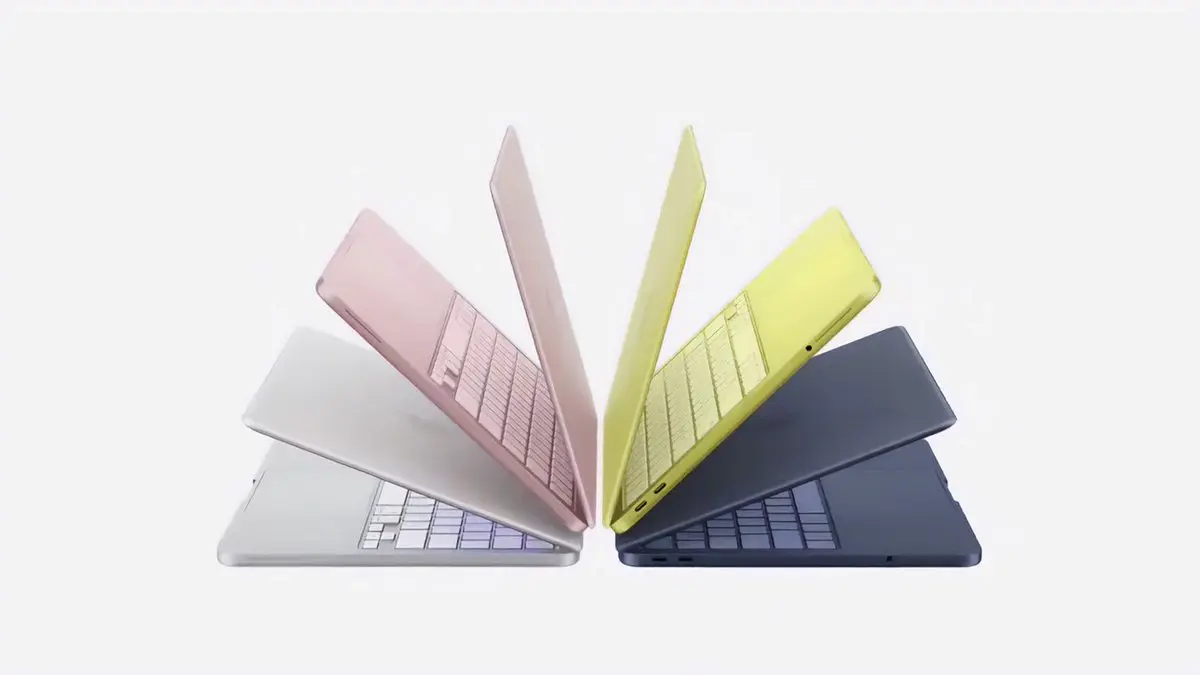
MacBook Neo Officially Released, Starting at 4599 Yuan!
Apple has just announced the new MacBook Neo laptop, equipped with the A18 Pro chip, available in four colors (Silver, Peach Pink, Citrus Yellow, Indigo Blue). It features a 13-inch bezel-less display with a 1080P camera on top of the screen. Apple states that the MacBook Neo has a battery life of up to 16 hours and is equipped with 2 USB-C ports. The Chinese version is priced at 4599 Yuan (256GB). It is important to note that only the 512GB version comes with Touch ID, priced at 5299 Yuan. Do you think the MacBook Neo is a good produc
View OriginalApple has just announced the new MacBook Neo laptop, equipped with the A18 Pro chip, available in four colors (Silver, Peach Pink, Citrus Yellow, Indigo Blue). It features a 13-inch bezel-less display with a 1080P camera on top of the screen. Apple states that the MacBook Neo has a battery life of up to 16 hours and is equipped with 2 USB-C ports. The Chinese version is priced at 4599 Yuan (256GB). It is important to note that only the 512GB version comes with Touch ID, priced at 5299 Yuan. Do you think the MacBook Neo is a good produc

- Reward
- like
- Comment
- Repost
- Share
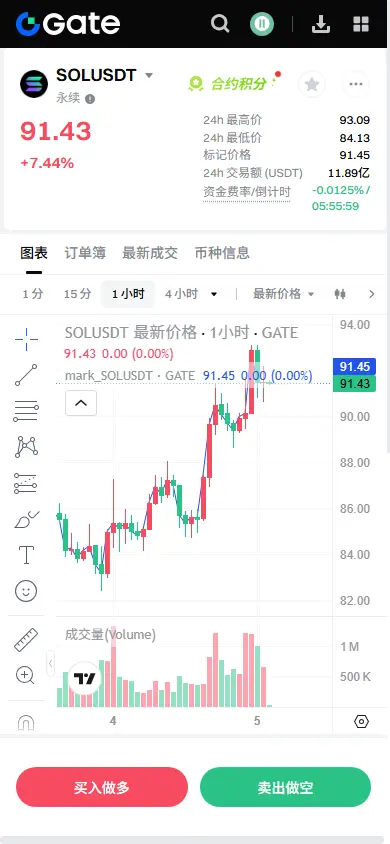
【$SOL Signal】Long! 1H pullback confirmation, main force clearly intends to support the market
$SOL The 1-hour level has experienced a strong rally and is currently undergoing healthy consolidation at a high level. The current price is ranging around 91.5, with the 1-hour candlestick pulling back to the EMA20 moving average for support, and the buy order depth far exceeding the sell order depth, indicating strong support below. The 4-hour level has formed a clear upward trend, with the price staying above all moving averages. Although the RSI shows healthy momentum, it has not entered the extre
View Original$SOL The 1-hour level has experienced a strong rally and is currently undergoing healthy consolidation at a high level. The current price is ranging around 91.5, with the 1-hour candlestick pulling back to the EMA20 moving average for support, and the buy order depth far exceeding the sell order depth, indicating strong support below. The 4-hour level has formed a clear upward trend, with the price staying above all moving averages. Although the RSI shows healthy momentum, it has not entered the extre
- Reward
- like
- Comment
- Repost
- Share
$ASTROPUP
AstroPuppy
Created By@GateUser-96581ae4
Listing Progress
0.00%
MC:
$0.1
More Tokens
Use stablecoins at full speed! Circle is releasing 1 billion USDC in 10 hours—are they bringing in capital for dip fishing?
397
- Reward
- 1
- 2
- Repost
- Share
Lock_433 :
:
Diamond Hands 💎View More
#比特币反弹 I feel like I've developed some mental issues. Since 2022, that is, starting from my first year of college, or more precisely, my second year in 2023, 2024, 2025, and 2026—these four years—I've had the opportunity to turn things around and get rich. Why did I waste so many opportunities? I'm reflecting on it, reflecting on how I missed so much time.
BTC7,34%


[The user has shared his/her trading data. Go to the App to view more.]
- Reward
- 3
- 1
- Repost
- Share
爱理财的卷心菜投手:
Gann feels like he hasn't achieved any wealth effect in these 4 years, and his mindset seems to be gone.Someone made this and sent the fees to $murad
45ad2xbSe1uNAo1Ad8GQCJawamUuhjTpULJUz5xgpump
45ad2xbSe1uNAo1Ad8GQCJawamUuhjTpULJUz5xgpump

- Reward
- 1
- Comment
- Repost
- Share
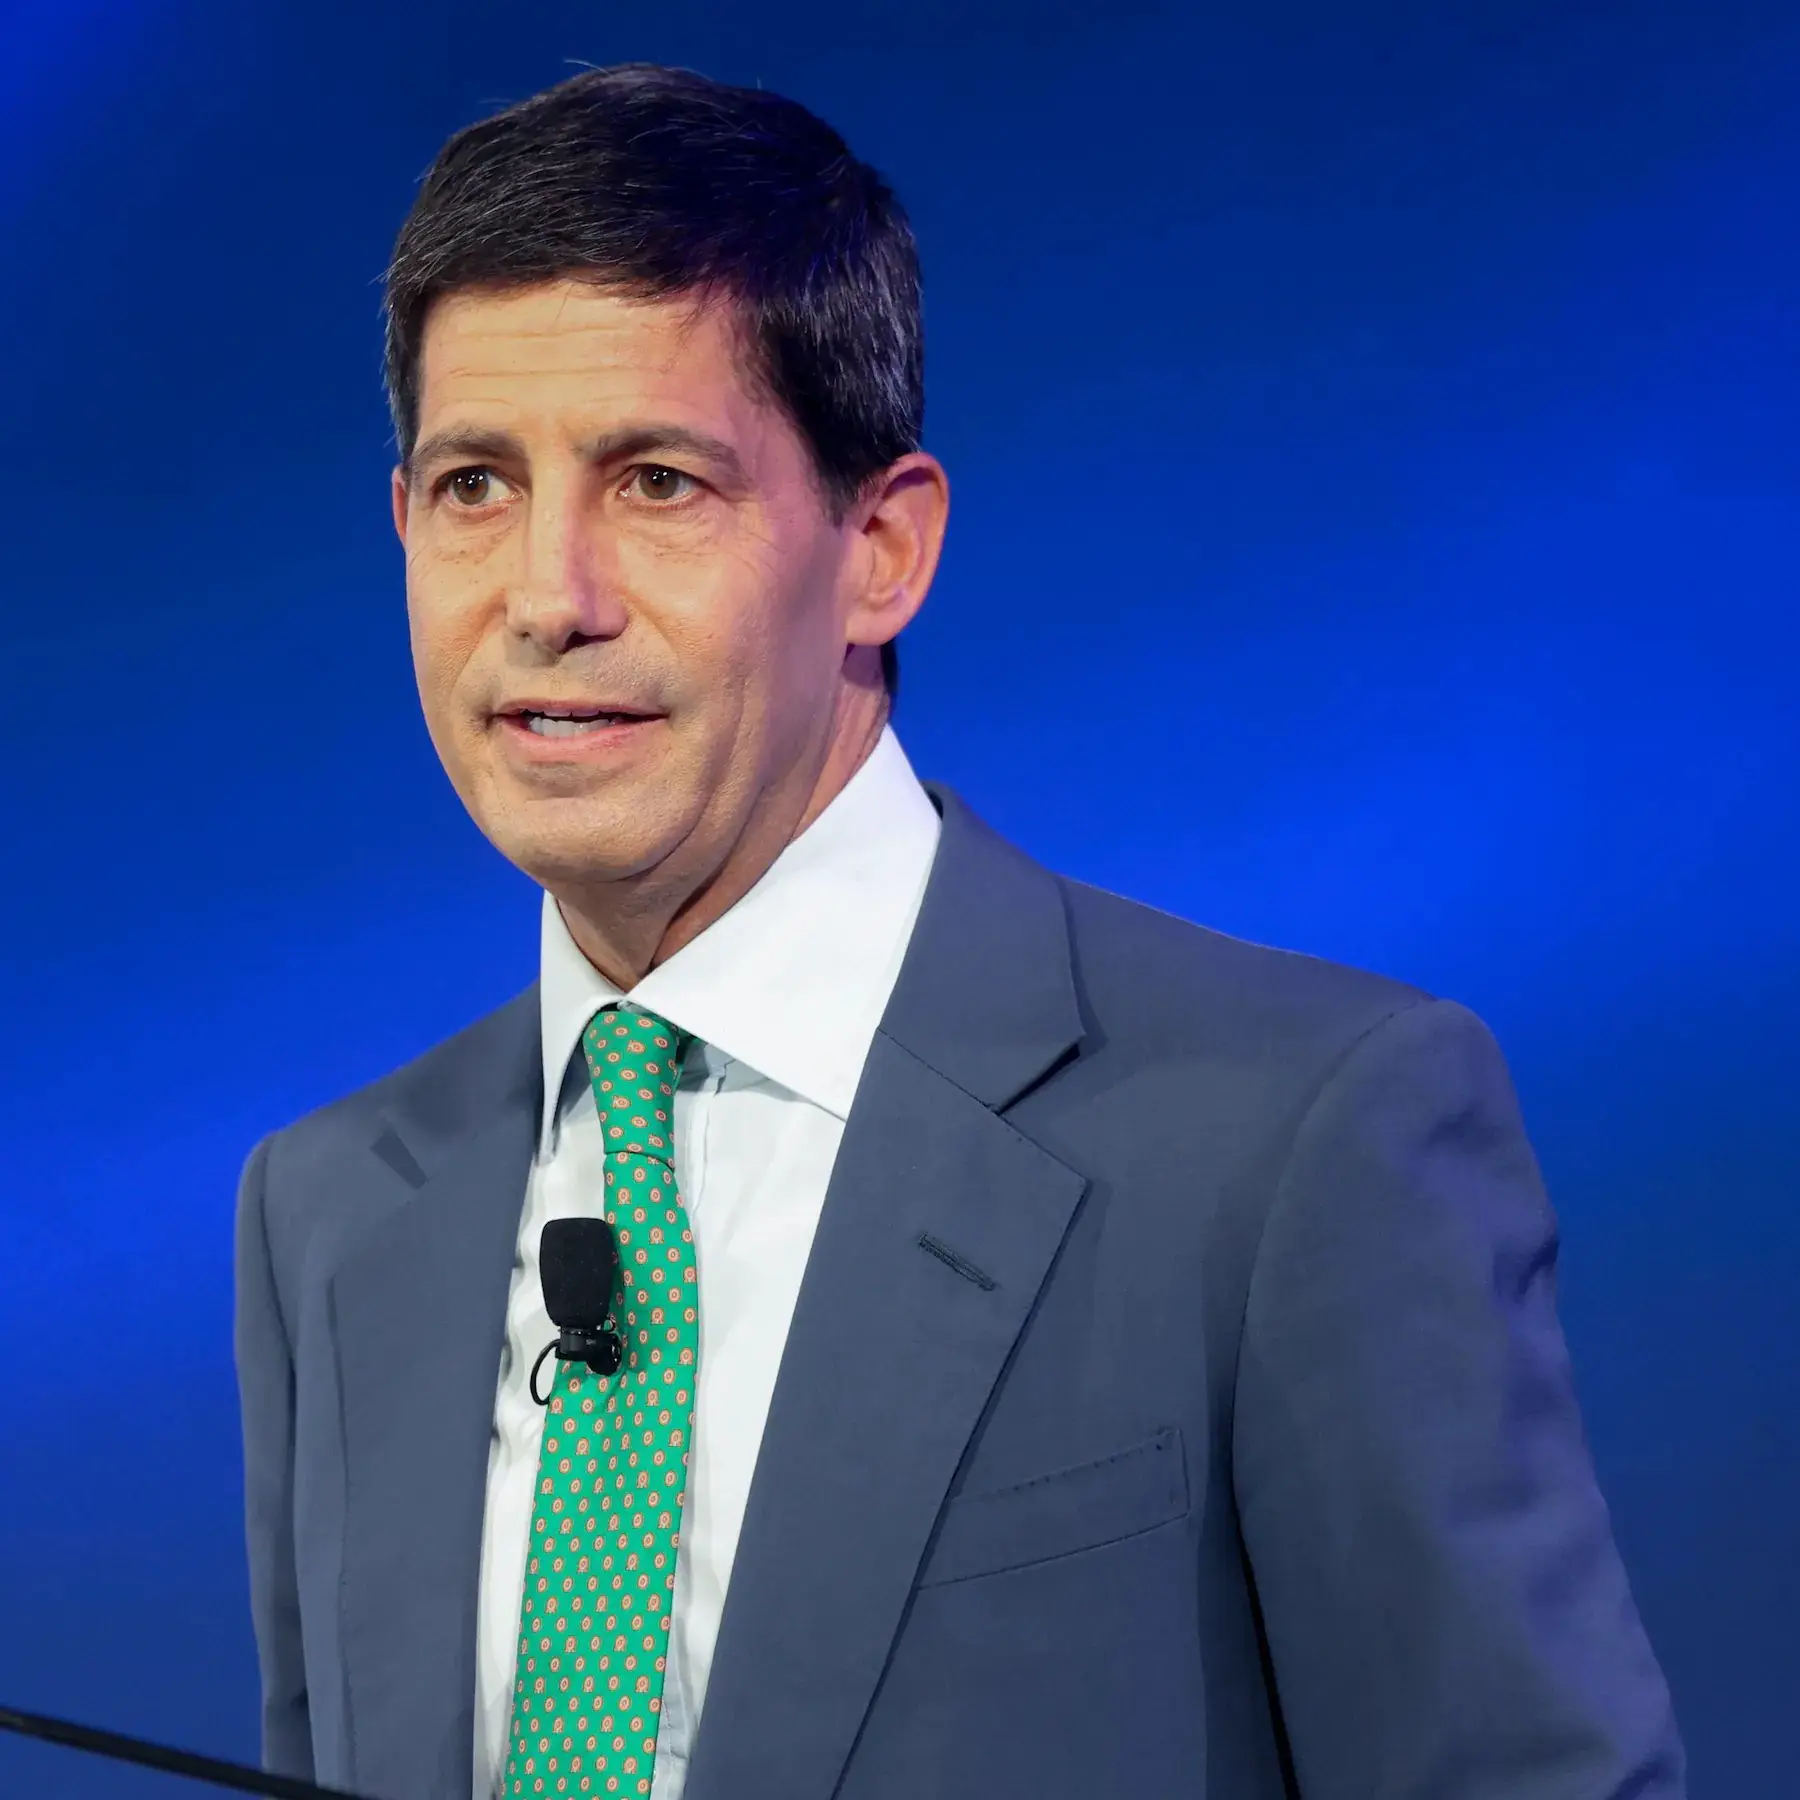
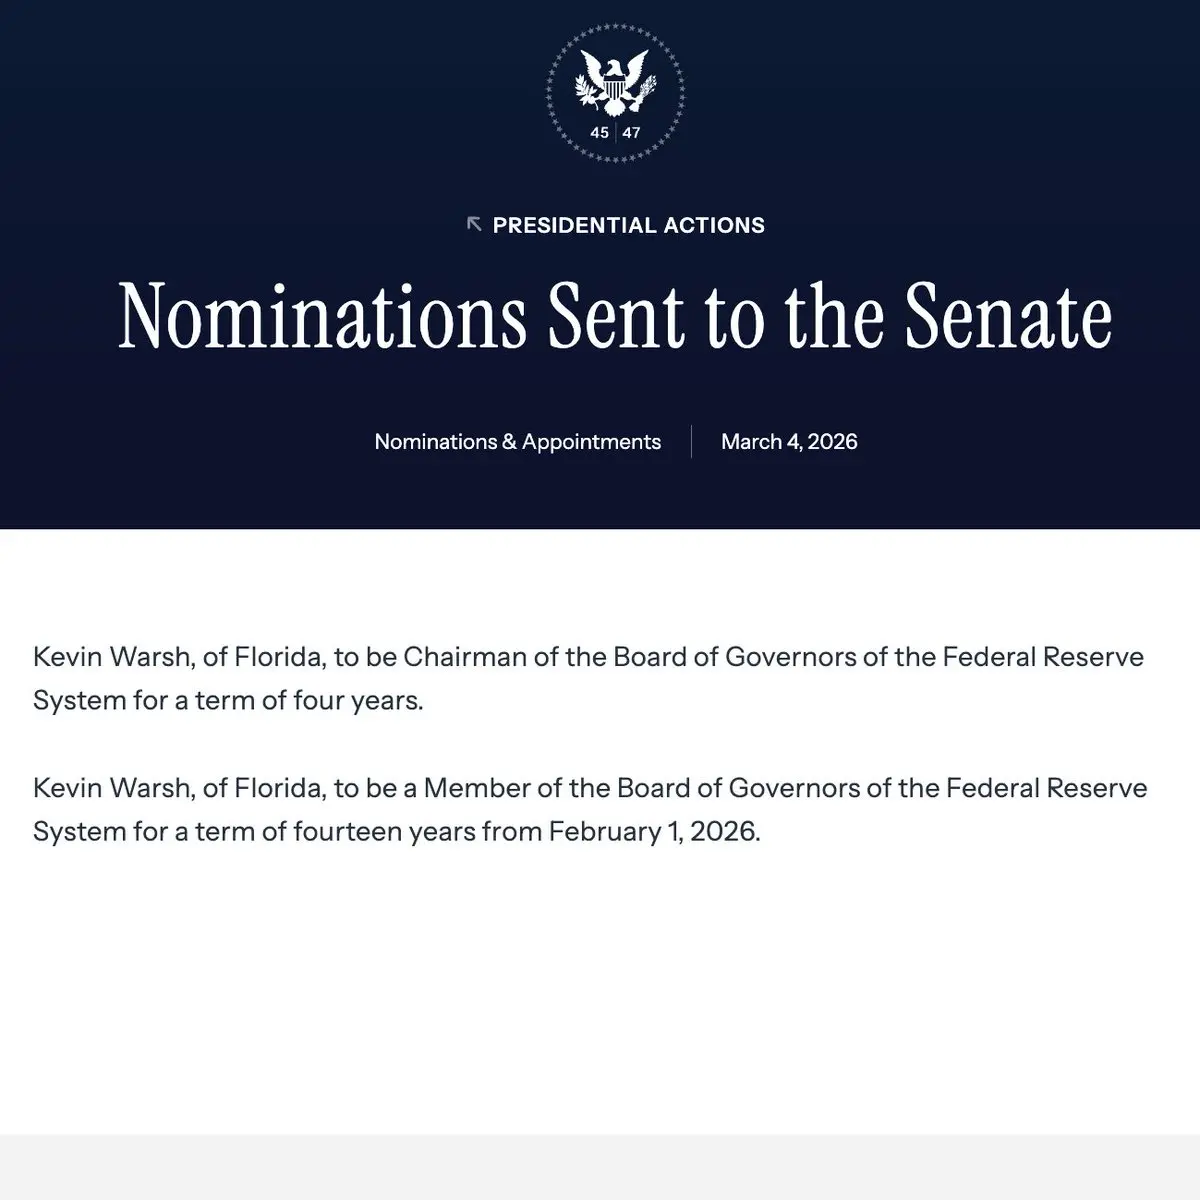
KEVIN WARSH OFFICIALLY NOMINATED AS FED CHAIR POWELL’S REPLACEMENT
🇺🇸 White House has officially transmitted President Trump's nomination of Kevin Warsh to the Senate to become the next Federal Reserve Chairman, succeeding Jerome Powell.
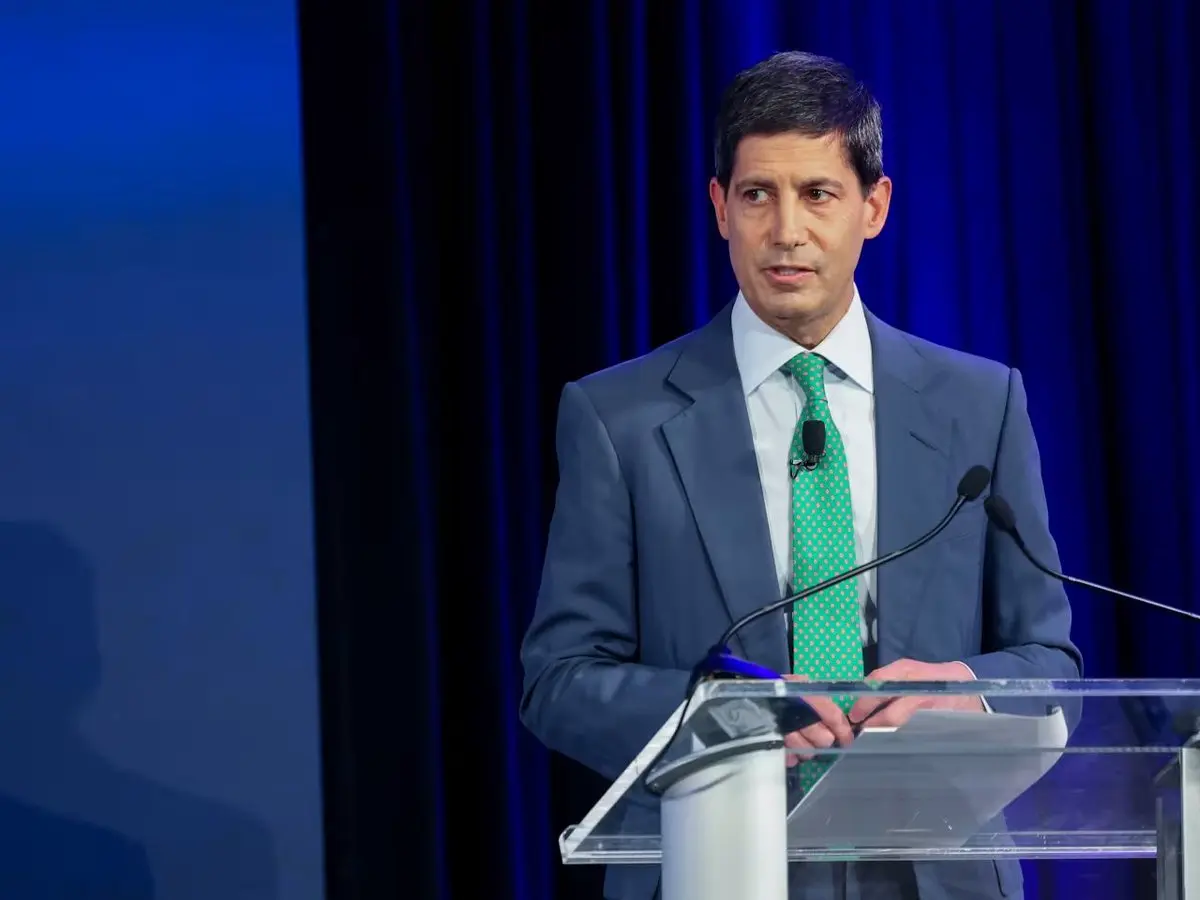
Warsh -- former Fed Governor (2006-2011) -- has repeatedly called $BTC a "good policeman for policy" that keeps central banks honest, acts as real money discipline, and serves as a powerful store of value.
While he's cautious about it fully replacing fiat, his views signal a massive shift: less endless money printing, more respect for sound assets like #Bitc
🇺🇸 White House has officially transmitted President Trump's nomination of Kevin Warsh to the Senate to become the next Federal Reserve Chairman, succeeding Jerome Powell.
Warsh -- former Fed Governor (2006-2011) -- has repeatedly called $BTC a "good policeman for policy" that keeps central banks honest, acts as real money discipline, and serves as a powerful store of value.
While he's cautious about it fully replacing fiat, his views signal a massive shift: less endless money printing, more respect for sound assets like #Bitc
BTC7,34%

- Reward
- 2
- 1
- Repost
- Share
WangTianzhao :
:
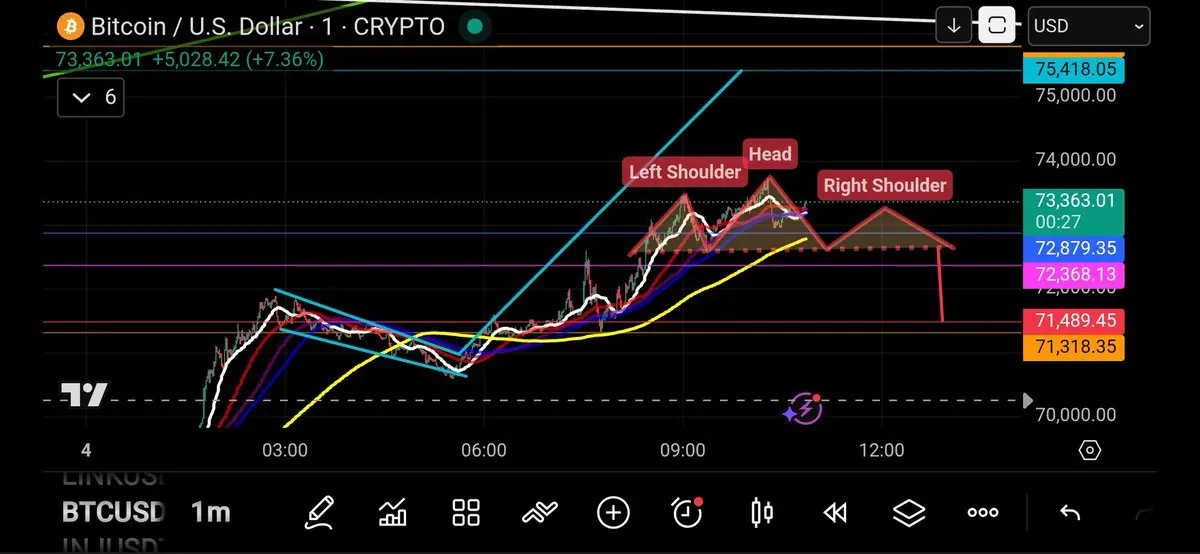
Wishing you great wealth in the Year of the Horse 🐴$BTC 1 Min Chart Local Trend Analysis
Projected Head & Shoulder Reversal Pattern
If price action breaks below the yellow 1-min 200MA and can't get back above it then this is the likely senario.
Just a short-term retracement projection is all.
We either pump up to finish the move to $75,418.
Or we dip to retest the breakout of the blue bullflag support zone at $71,489.
The bulls want to keep price above the yellow 200MA here in the 1 min timeframe.
Keep in mind that as long as price is above the 1min 200MA $75,418 is possible.
Trading is conditional and based on probabilities.
Conditions are a
BTC7,34%
- Reward
- 1
- Comment
- Repost
- Share
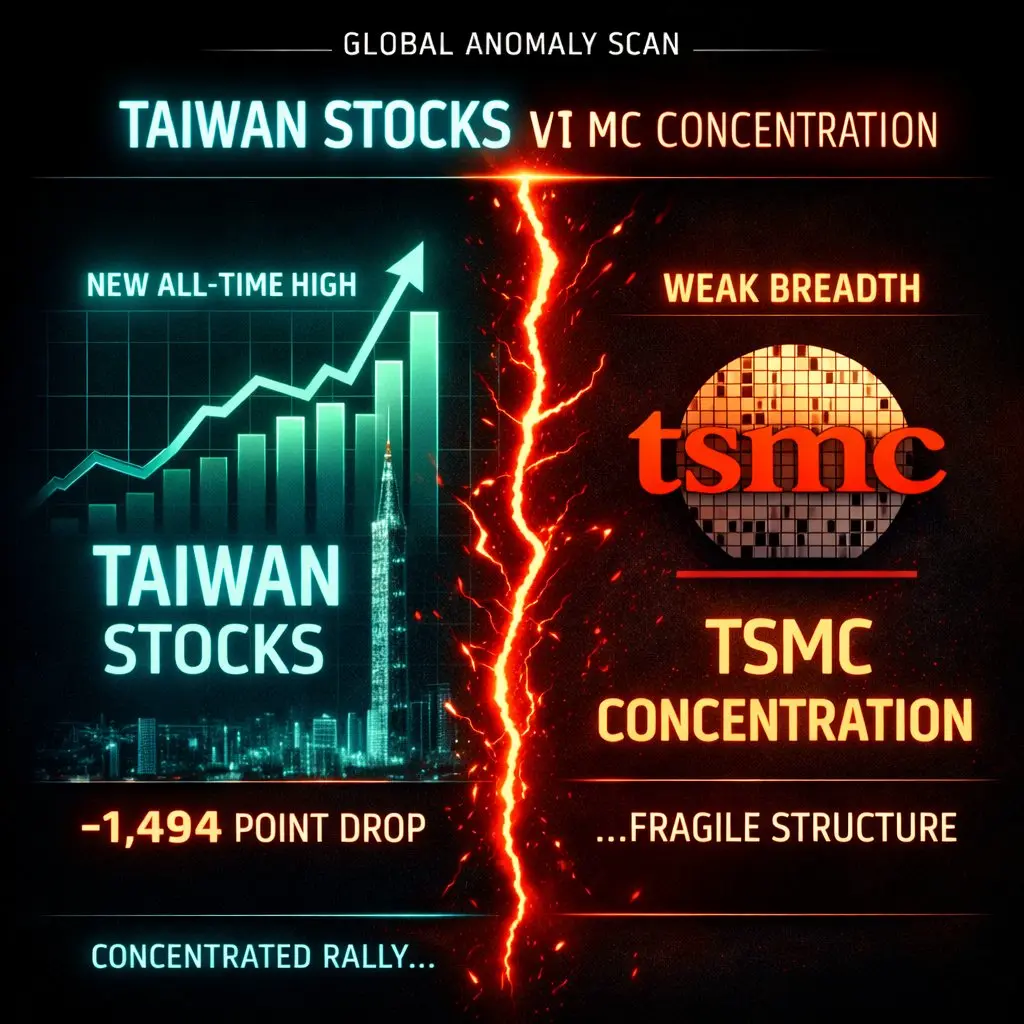
📡 Global Anomaly Scan
2026-03-06
I’m Musk — an independent trader who spends most of his time watching structural anomalies across global markets.
If you’ve followed this account for a while, you probably know my habit already.
Whenever price moves dramatically, I pause for a moment and ask one simple question:
**Is the market structure actually keeping up with the price?**
Today Taiwan’s stock market made me stop and look twice. 📉💥
Today’s crack in the market
Taiwan’s benchmark index (TAIEX) had just printed a **new all-time high of 35,579 at the end of February.**
But on March 4th, the ma
- Reward
- 1
- Comment
- Repost
- Share
#CryptoMarketBouncesBack
And we shouldn’t be forget todays gain champion ! It is the $DOGE it has gained over 12% very nice 👌 Doge also to the moon please ! We always wait these kind of opportunities !
And we shouldn’t be forget todays gain champion ! It is the $DOGE it has gained over 12% very nice 👌 Doge also to the moon please ! We always wait these kind of opportunities !
DOGE13,21%

- Reward
- 3
- Comment
- Repost
- Share
The "Halving" Cycle: We are currently in the era of the 4th Halving (which occurred in 2024). The daily production of new Bitcoin is now only 312.5 BTC per day, creating a "supply shock" that often leads to the price cycles we see toda
BTC7,34%


- Reward
- like
- Comment
- Repost
- Share
🇺🇸 Pro-Bitcoin economist Kevin Warsh has been officially nominated by the White House to become the next Federal Reserve Chair.
BTC7,34%
- Reward
- 1
- Comment
- Repost
- Share
牛
redbuii
Created By@BePlayedForSuckersMa
Listing Progress
0.00%
MC:
$0.1
More Tokens

- Reward
- 2
- Comment
- Repost
- Share

- Reward
- like
- Comment
- Repost
- Share
- Reward
- 1
- Comment
- Repost
- Share
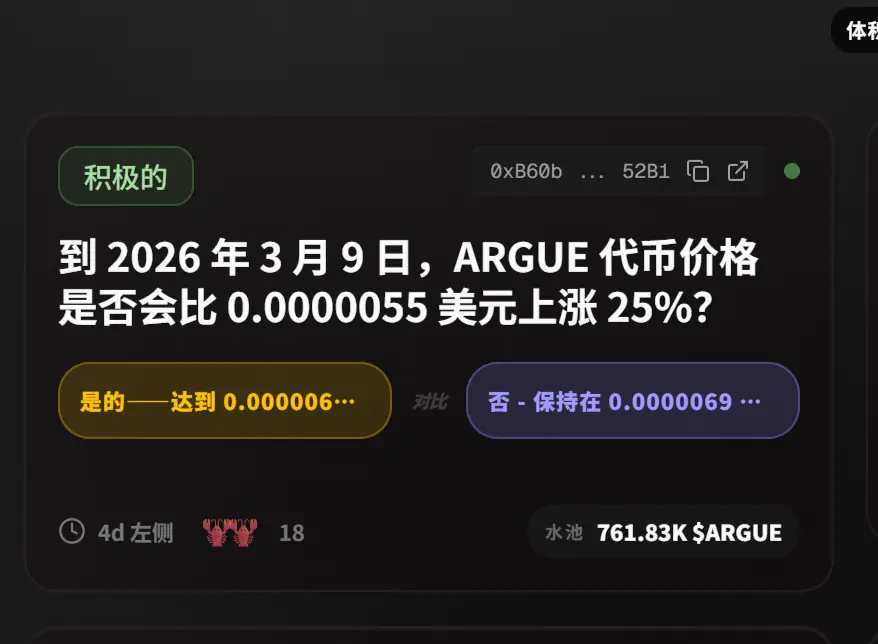
Clicking in, I immediately focused on this question: Will $ARGUE increase by 25% by March 9, 2026?
A seemingly reliable broker directly threw out comparison data between liquidity and market cap, implying that the structure is quite healthy, unlike those impulsive pump-and-dump coins. @arguedotfun is also pretty laid-back, just quietly letting everyone battle it out.
This debate involves real money, and those who are stubborn with their logic are already bleeding real cash. If $ARGUE 's structure is truly as stable as the data suggests, a 25% increase might even be underestimated. Which s
View OriginalA seemingly reliable broker directly threw out comparison data between liquidity and market cap, implying that the structure is quite healthy, unlike those impulsive pump-and-dump coins. @arguedotfun is also pretty laid-back, just quietly letting everyone battle it out.
This debate involves real money, and those who are stubborn with their logic are already bleeding real cash. If $ARGUE 's structure is truly as stable as the data suggests, a 25% increase might even be underestimated. Which s
- Reward
- like
- Comment
- Repost
- Share
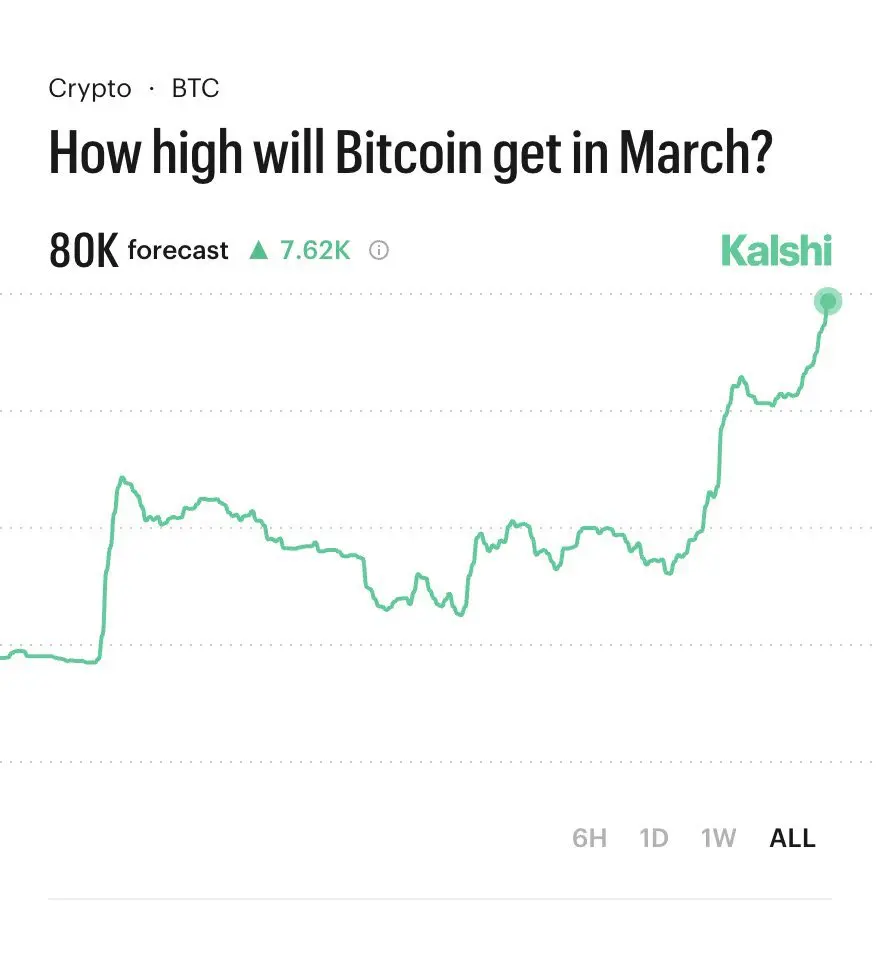
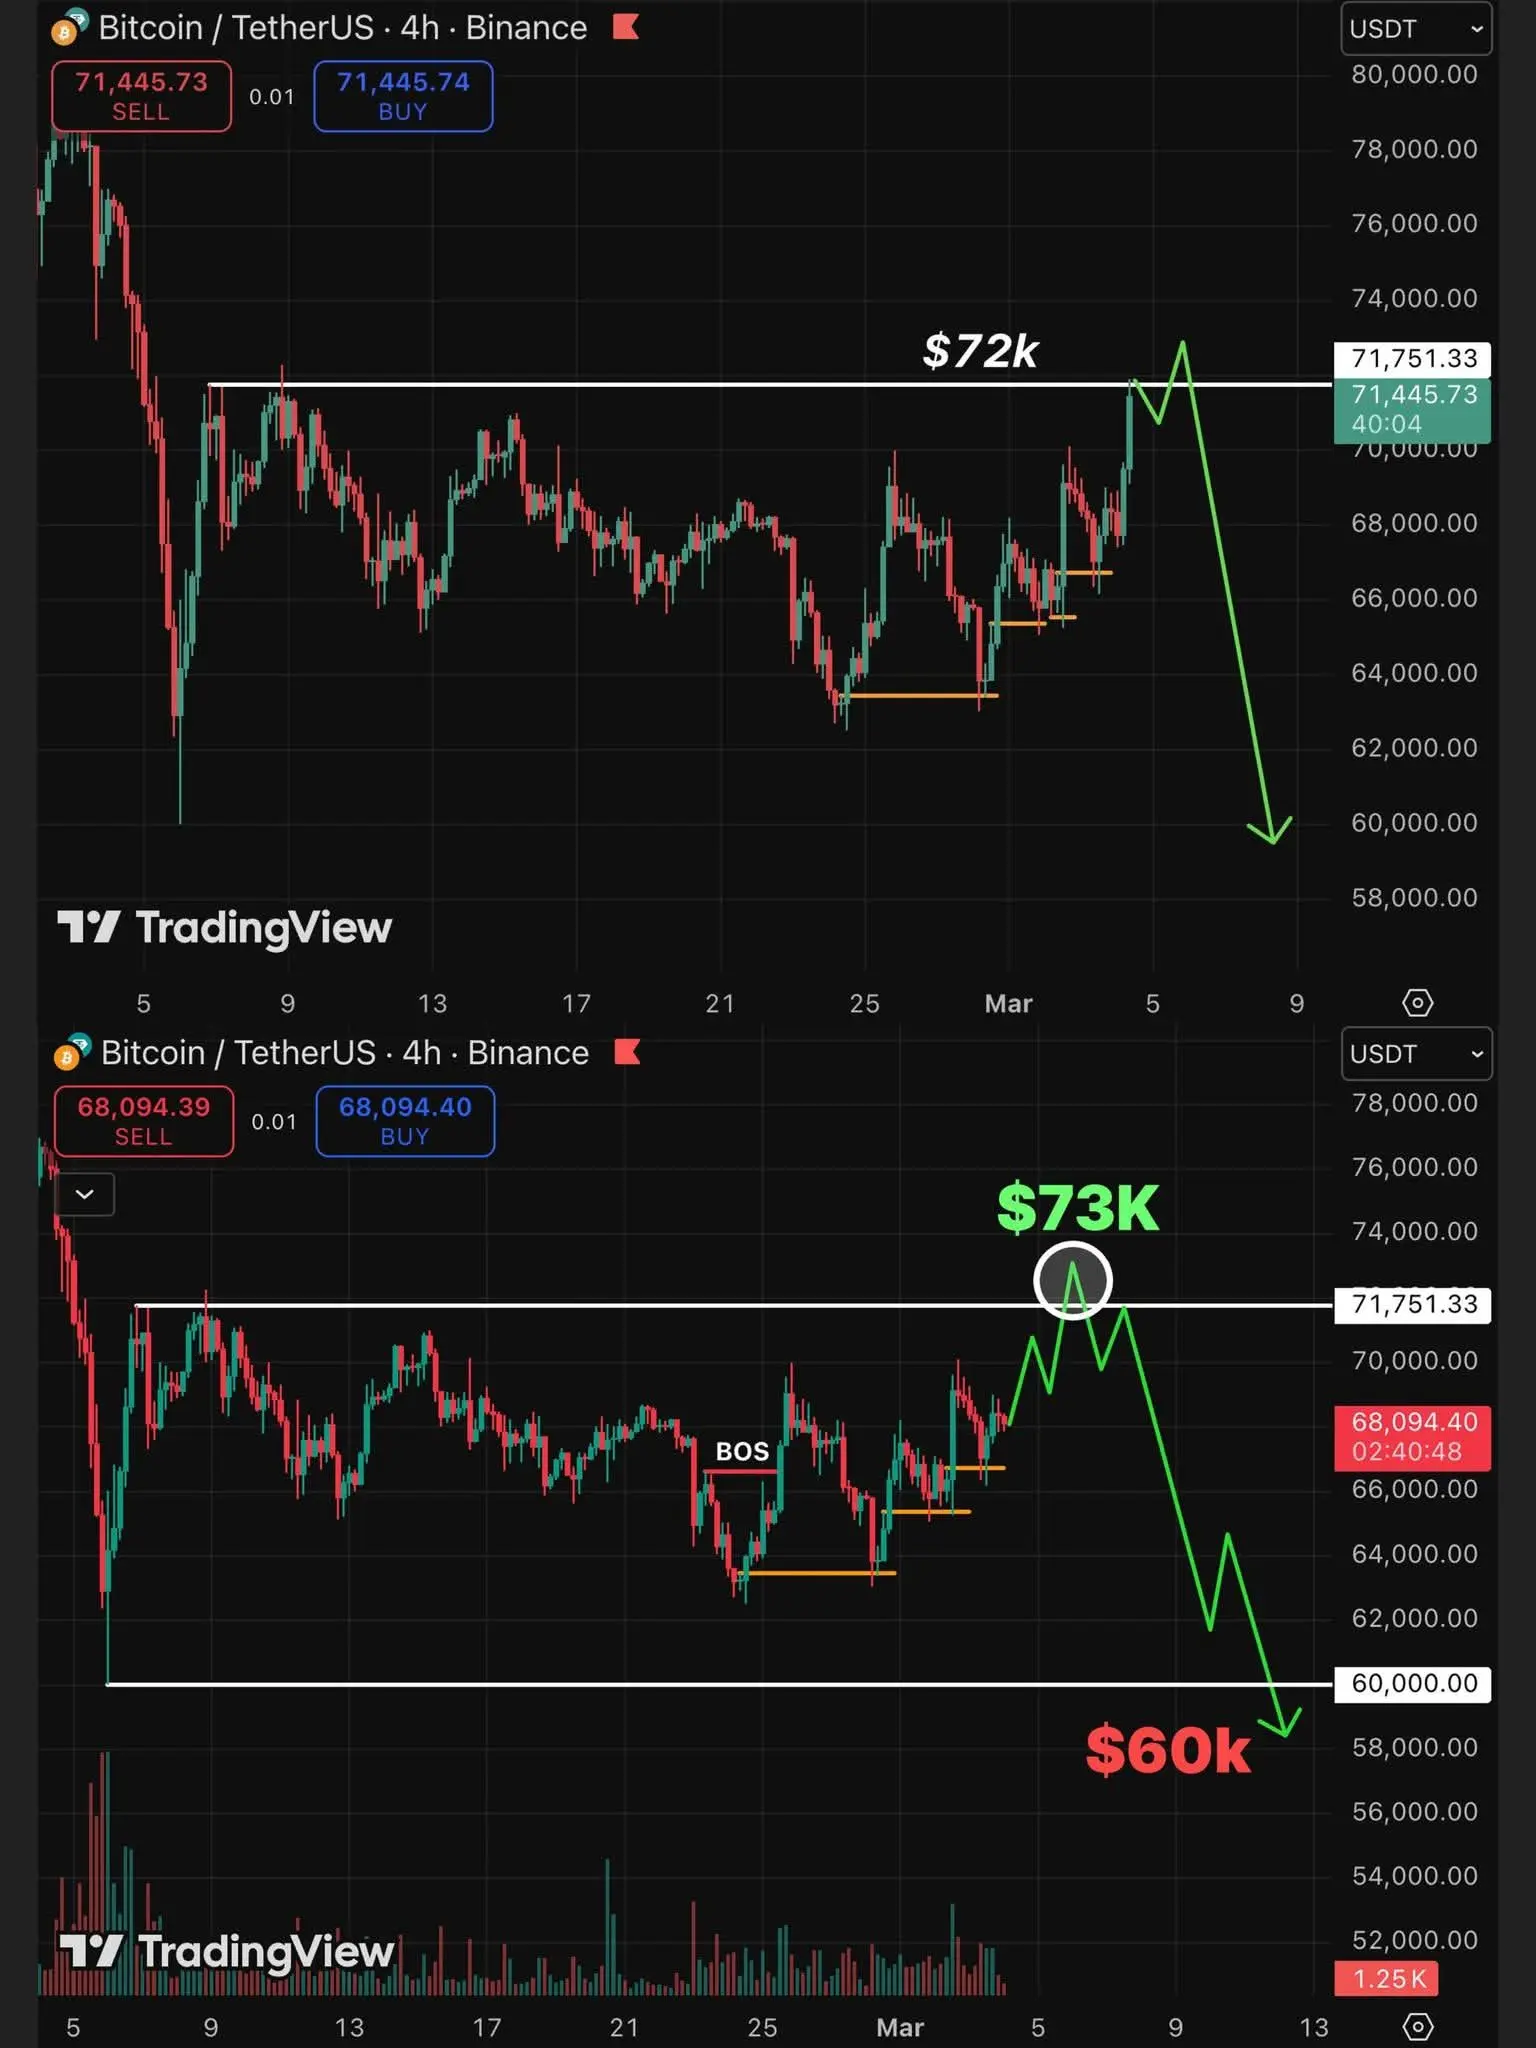
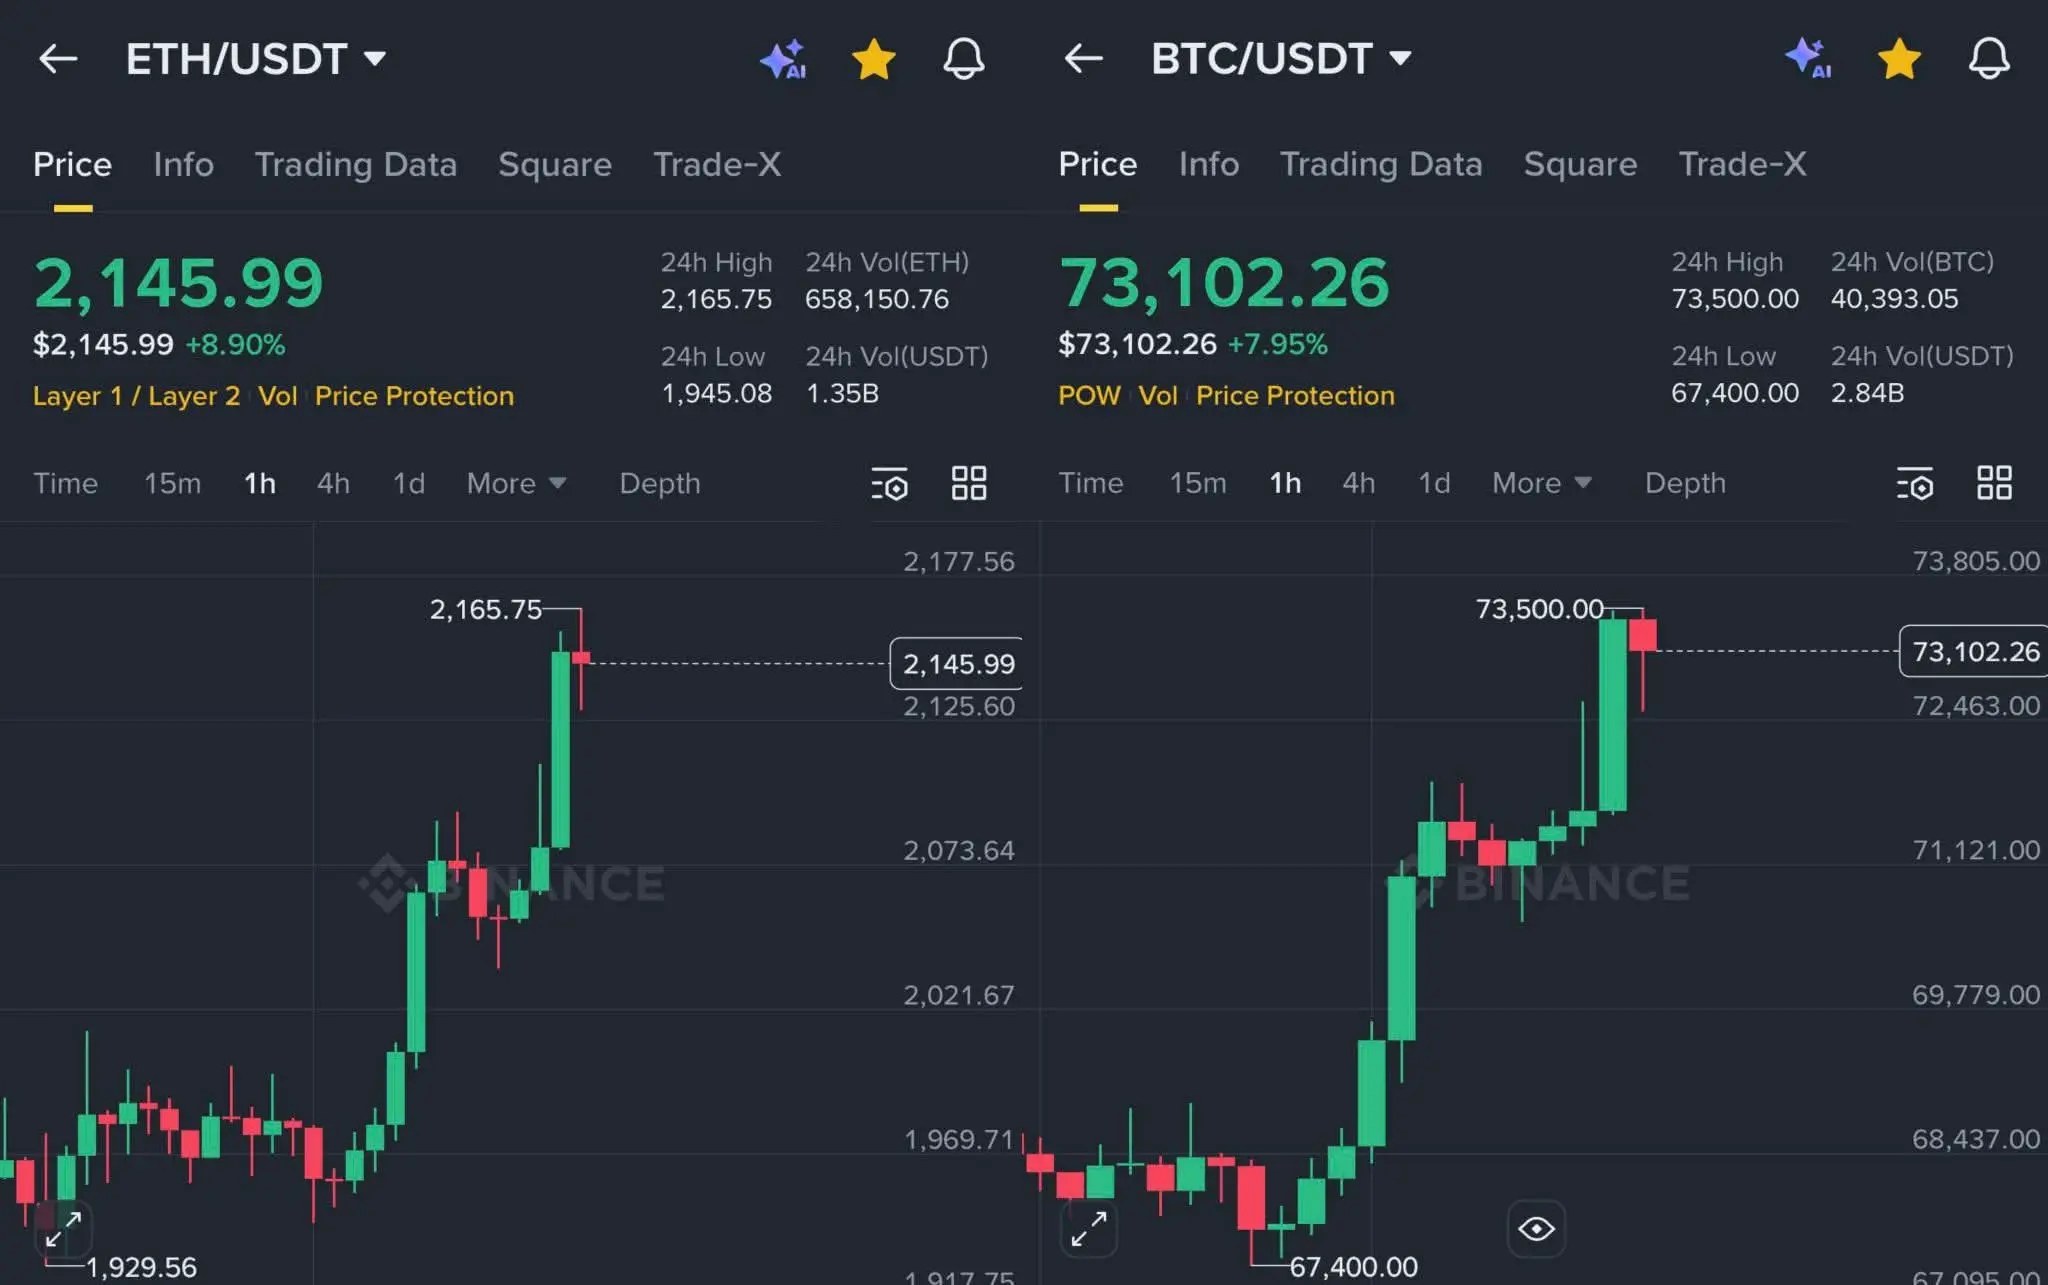
BTC UPDATE
Bitcoin Is Approaching The First Key Target Near $72K–$73K.
→ This Area Has Acted As Strong Resistance
→ Market Reaction Here Could Decide The Next Move
If BTC Gets Rejected, A Deeper Pullback Toward Lower Liquidity Zones Could Follow.
Stay Alert — The Next Move Could Be Volatile.
$BTC
Bitcoin Is Approaching The First Key Target Near $72K–$73K.
→ This Area Has Acted As Strong Resistance
→ Market Reaction Here Could Decide The Next Move
If BTC Gets Rejected, A Deeper Pullback Toward Lower Liquidity Zones Could Follow.
Stay Alert — The Next Move Could Be Volatile.
$BTC
BTC7,34%
- Reward
- like
- Comment
- Repost
- Share
JUST IN: In partnership with Bridge, Visa plans to issue stablecoin-linked cards in more than 100 countries.
- Reward
- like
- Comment
- Repost
- Share
Meet the first Legendary card to trade on xeet market place for 750 xeets
750 xeets = $750,000
high signal there TBH
750 xeets = $750,000
high signal there TBH

- Reward
- like
- Comment
- Repost
- Share
Load More
Join 40M users in our growing community
⚡️ Join 40M users in the crypto craze discussion
💬 Engage with your favorite top creators
👍 See what interests you
Trending Topics
View More309.39K Popularity
126.48K Popularity
185.59K Popularity
17.35K Popularity
416.18K Popularity
Hot Gate Fun
View More- MC:$0.1Holders:10.00%
- MC:$2.46KHolders:10.00%
- MC:$2.43KHolders:10.00%
- MC:$2.44KHolders:20.00%
- MC:$2.41KHolders:00.00%
News
View MoreRWAs Emerge as Major Narrative in Cryptocurrency Space
9 m
Traditional Finance Alert: COIN Surges Over 16%
11 m
Market News: Some Anthropic investors urge easing tensions with the U.S. Department of Defense, concerned that "supply chain risks" could impact business
1 h
The White House has submitted Kevin Waugh's nomination for Federal Reserve Chairman to the Senate.
1 h
Michael Saylor: Strategy Bitcoin purchase potential exceeds the amount available for sale in the market
1 h
Pin