Trade
Basic
Futures
Futures
Hundreds of contracts settled in USDT or BTC
TradFi
Gold
Trade global traditional assets with USDT in one place
Options
Hot
Trade European-style vanilla options
Unified Account
Maximize your capital efficiency
Demo Trading
Futures Kickoff
Get prepared for your futures trading
Futures Events
Participate in events to win generous rewards
Demo Trading
Use virtual funds to experience risk-free trading
Earn
Launch
CandyDrop
Collect candies to earn airdrops
Launchpool
Quick staking, earn potential new tokens
HODLer Airdrop
Hold GT and get massive airdrops for free
Launchpad
Be early to the next big token project
Alpha Points
Trade on-chain assets and enjoy airdrop rewards!
Futures Points
Earn futures points and claim airdrop rewards
Investment
Simple Earn
Earn interests with idle tokens
Auto-Invest
Auto-invest on a regular basis
Dual Investment
Buy low and sell high to take profits from price fluctuations
Soft Staking
Earn rewards with flexible staking
Crypto Loan
0 Fees
Pledge one crypto to borrow another
Lending Center
One-stop lending hub
VIP Wealth Hub
Customized wealth management empowers your assets growth
Private Wealth Management
Customized asset management to grow your digital assets
Quant Fund
Top asset management team helps you profit without hassle
Staking
Stake cryptos to earn in PoS products
Smart Leverage
New
No forced liquidation before maturity, worry-free leveraged gains
GUSD Minting
Use USDT/USDC to mint GUSD for treasury-level yields
More
# Cryptoanalysis
20.44K
Crypto_Exper
#JaneStreet10AMSellOff
Market Analysis 🚨
This morning’s 10 AM sell-off driven by Jane Street flows wasn’t just a random dip — it reveals underlying market dynamics that traders need to understand.
📊 Market Breakdown:
BTC & ETH: Sharp intraday drop triggered by stop-loss cascades.
Exchange Flows: Significant outflows, indicating long-term holders are absorbing the sell pressure.
Funding Rates: Neutral to slightly negative → short squeeze potential remains intact.
💡 Insights for Traders & Creators:
Liquidity Zones: Major support levels ($65K–$66K for BTC) are key to monitor.
Institutional Ac
- Reward
- 2
- Comment
- Repost
- Share
#JaneStreet10AMSellOff
Market Analysis 🚨
This morning’s 10 AM sell-off driven by Jane Street flows wasn’t just a random dip — it reveals underlying market dynamics that traders need to understand.
📊 Market Breakdown:
BTC & ETH: Sharp intraday drop triggered by stop-loss cascades.
Exchange Flows: Significant outflows, indicating long-term holders are absorbing the sell pressure.
Funding Rates: Neutral to slightly negative → short squeeze potential remains intact.
💡 Insights for Traders & Creators:
Liquidity Zones: Major support levels ($65K–$66K for BTC) are key to monitor.
Institutional Ac
Market Analysis 🚨
This morning’s 10 AM sell-off driven by Jane Street flows wasn’t just a random dip — it reveals underlying market dynamics that traders need to understand.
📊 Market Breakdown:
BTC & ETH: Sharp intraday drop triggered by stop-loss cascades.
Exchange Flows: Significant outflows, indicating long-term holders are absorbing the sell pressure.
Funding Rates: Neutral to slightly negative → short squeeze potential remains intact.
💡 Insights for Traders & Creators:
Liquidity Zones: Major support levels ($65K–$66K for BTC) are key to monitor.
Institutional Ac


- Reward
- 8
- 6
- Repost
- Share
SheenCrypto:
2026 GOGOGO 👊View More
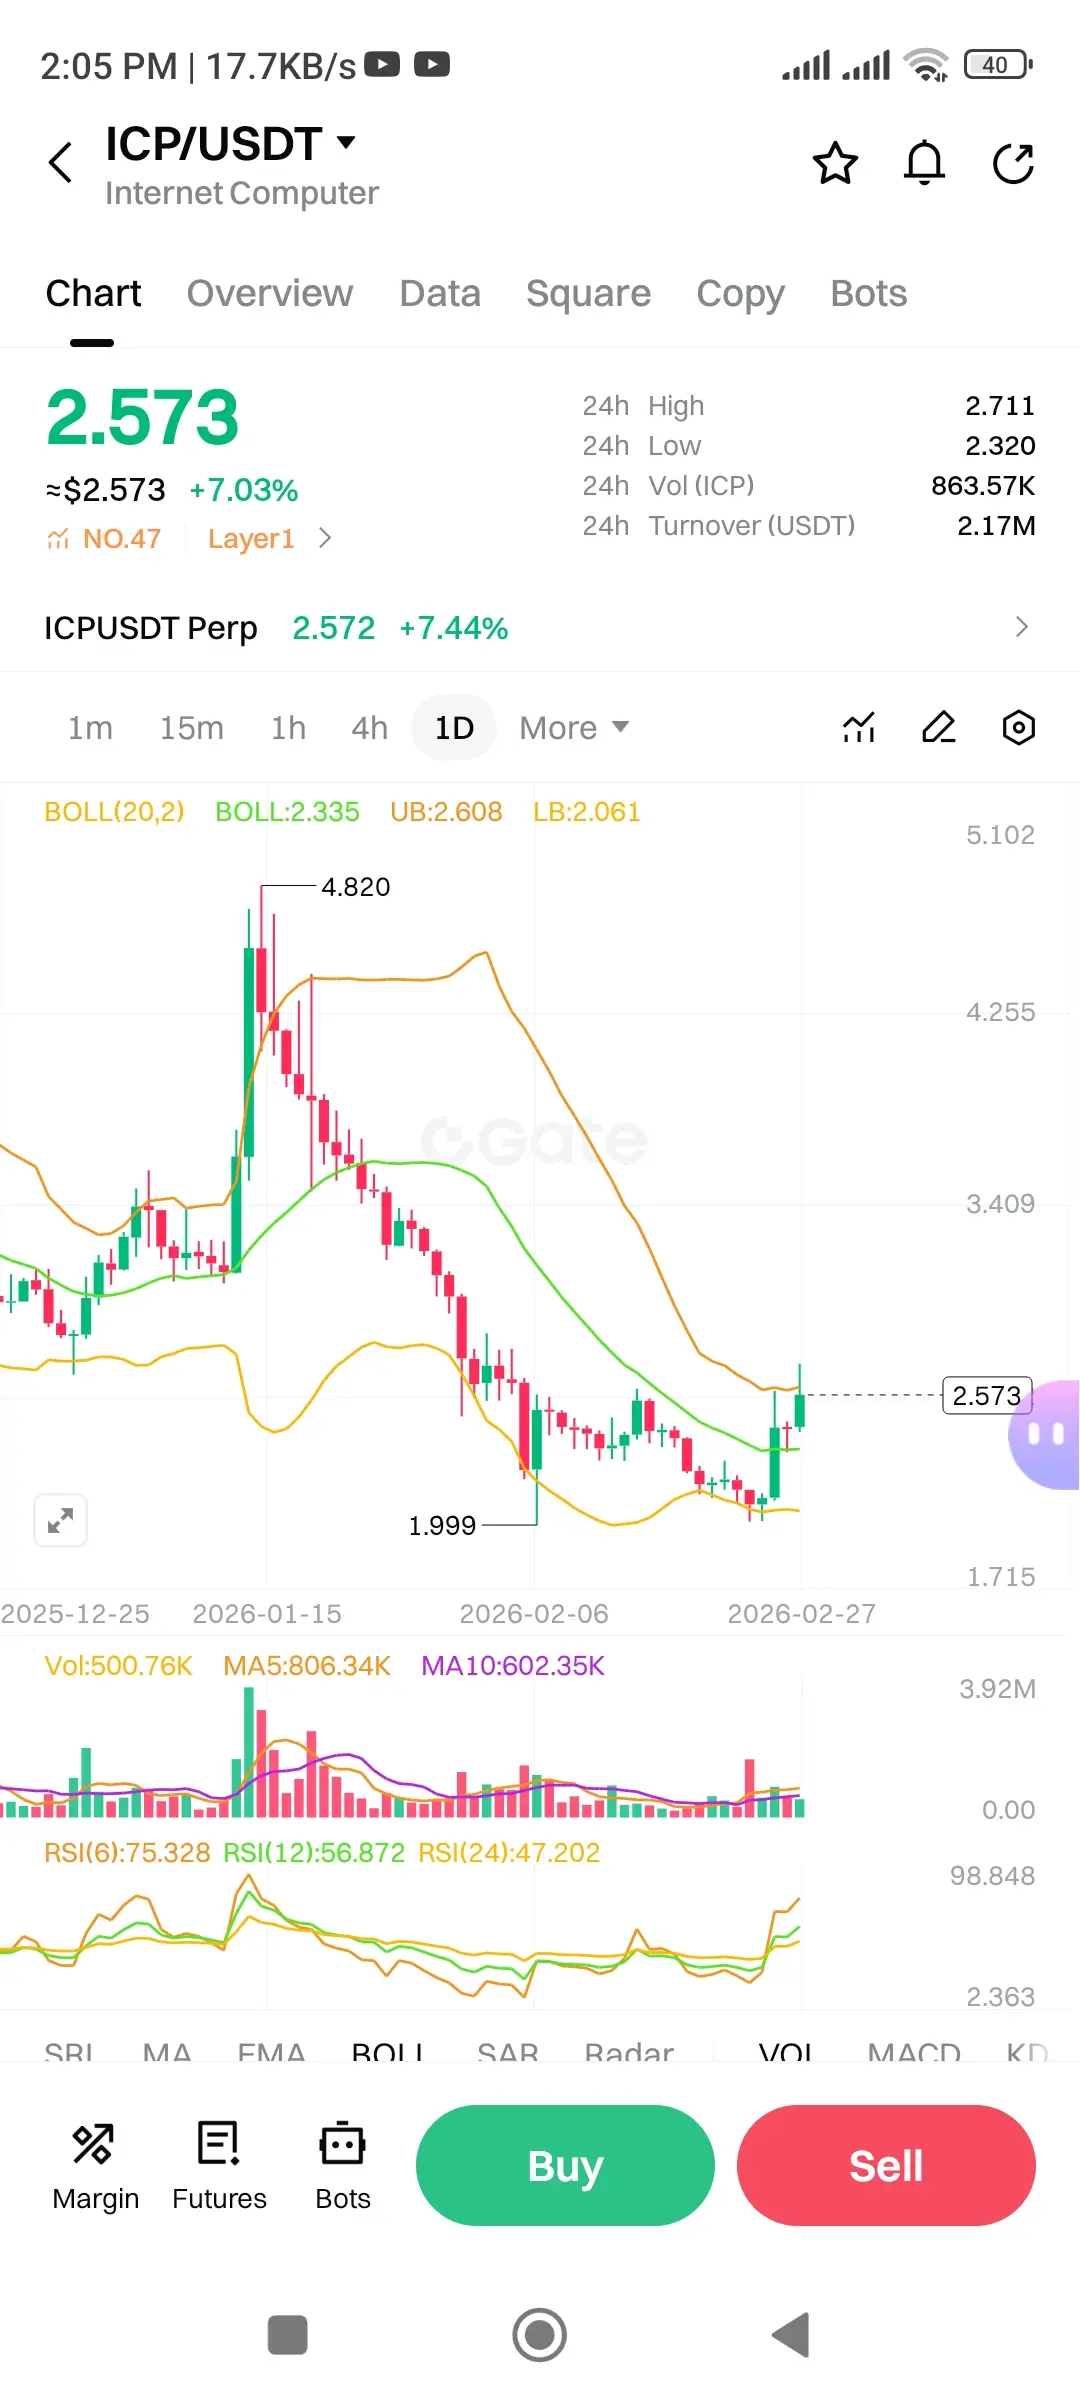
$ICP /USDT Technical Analysis | 1D Chart
Price: $2.573 | +7.03% 📈
After a brutal sell-off from $4.820, ICP finally found its footing near the $1.999 support zone where patient hands were clearly waiting.
📊 Indicators Breakdown:
🔵 BOLL(20,2): Price is now breaking above the Middle Band (2.335) and challenging the Upper Band at 2.608 a textbook bullish band expansion signal.
🟡 RSI(6): 75.328 | RSI(12): 56.872 | RSI(24): 47.202 Short-term momentum is blazing while mid & long-term RSI still has plenty of room to run no divergence yet!
📦 Volume: MA5 volume surpassing MA10 confirms fresh buying
ICP-7,77%
- Reward
- 2
- Comment
- Repost
- Share
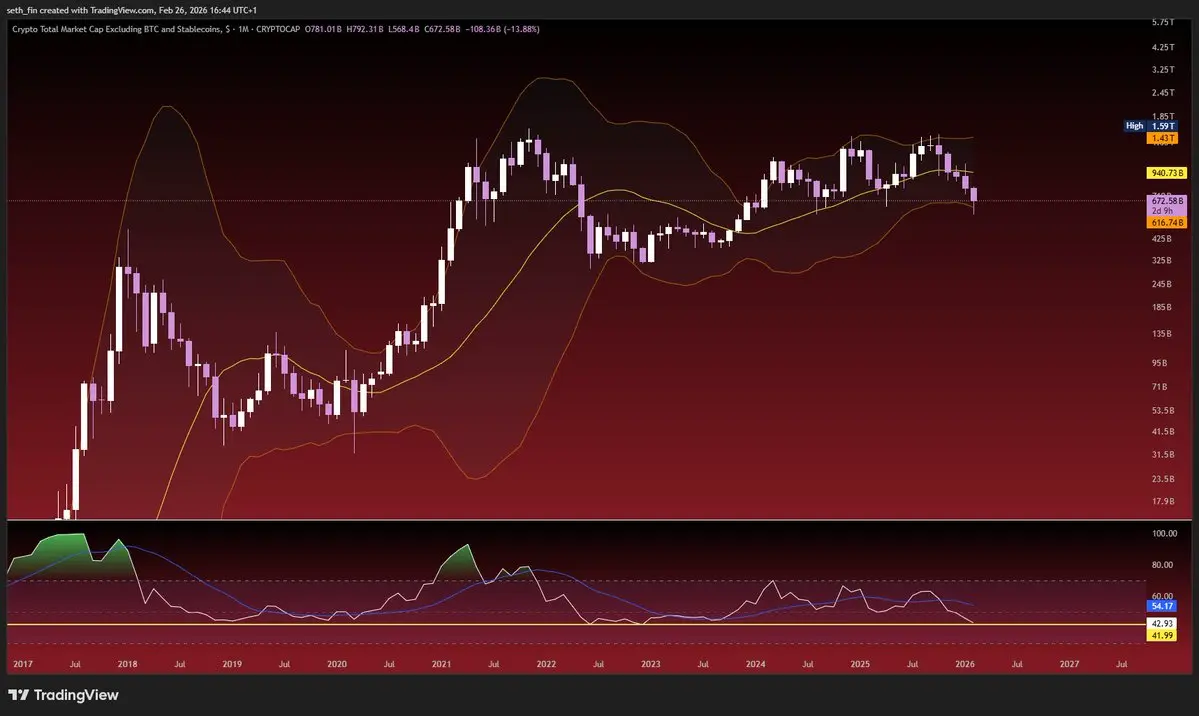
Everyone is watching price… but the real signal right now is TIME ⏳
Let’s break it down:
$BTC
🔹 The first range of this downtrend lasted 55 days (~21%)
🔹 The current range is 22 days in (~20%) and still developingSame size. Different duration.
Why does this matter?
Price shows the level.
Time shows the battle between buyers and sellers.
A long range = strong demand absorbing supply.
A short range = sellers are in control and buyers are just liquidity.
The first structure took nearly 2 months to break → buyers were active, defending value.If this current range breaks down faster, it means:
➡
BTC-2,94%
- Reward
- 2
- Comment
- Repost
- Share
📘 Deep Dive Creator Camp: Where Knowledge Meets Recognition
In today’s crypto market, information is everywhere — but understanding is rare. Prices move fast, narratives change overnight, and most content focuses only on what happened, not why it happened. This growing gap between noise and knowledge is exactly what the Gate Square Deep Dive Creator Camp is designed to fix.
This initiative is a strong statement:
👉 Serious research still matters.
👉 Original thinking deserves exposure.
👉 Quality creators should be rewarded.
🚀 The Vision Behind Deep Dive Creator Camp
Gate Square understands

- Reward
- 8
- 8
- Repost
- Share
Korean_Girl :
:
To The Moon 🌕View More
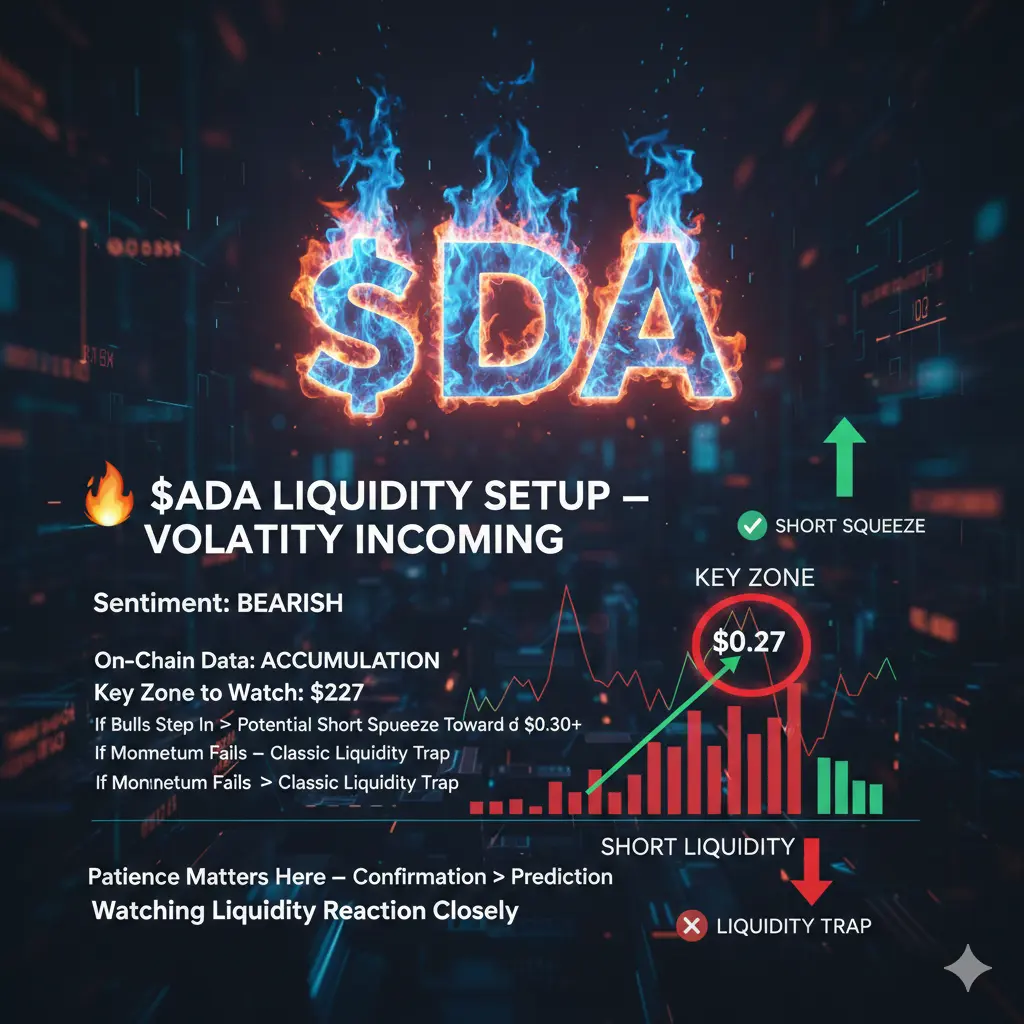
🔥 $ADA Liquidity Setup — Volatility Incoming
Short liquidity is building as sentiment remains bearish after the heavy Q1 correction.
While price structure still looks weak, on-chain and liquidity data suggest larger players may be accumulating into fear.
📍 Key zone to watch: $0.27
This area holds a growing short leverage pocket.
✅ If bulls step in → potential short squeeze toward $0.30+
❌ If momentum fails → classic liquidity trap and distribution phase.
Market is entering a volatility loop where both upside squeezes and fast pullbacks are possible.
Patience matters here — confirmation > pr
ADA-7,21%
- Reward
- 3
- Comment
- Repost
- Share
Exploring the Next Wave: AI and DePIN Synergy
The Analysis:
As we navigate through February 2026, the convergence of AI (Artificial Intelligence) and DePIN (Decentralized Physical Infrastructure Networks) is becoming the primary driver for the next market leg. While major assets are consolidating, mid-cap projects providing decentralized compute power are seeing a significant uptick in on-chain activity.
Key Observations:
Market Sentiment: Bullish on infrastructure plays; capital is rotating out of pure memes into utility-driven tokens.
Technical View: The total market cap for AI tokens has fo
- Reward
- like
- Comment
- Repost
- Share
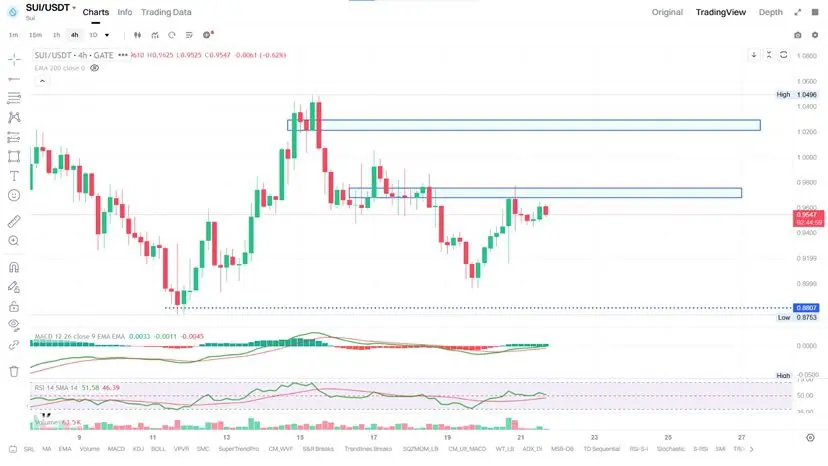
🚨 SUI Token Update – Short Pressure Building!
SUI is currently facing strong short pressure between $0.95 – $0.97.
This zone is acting as immediate resistance where sellers are actively defending the price.
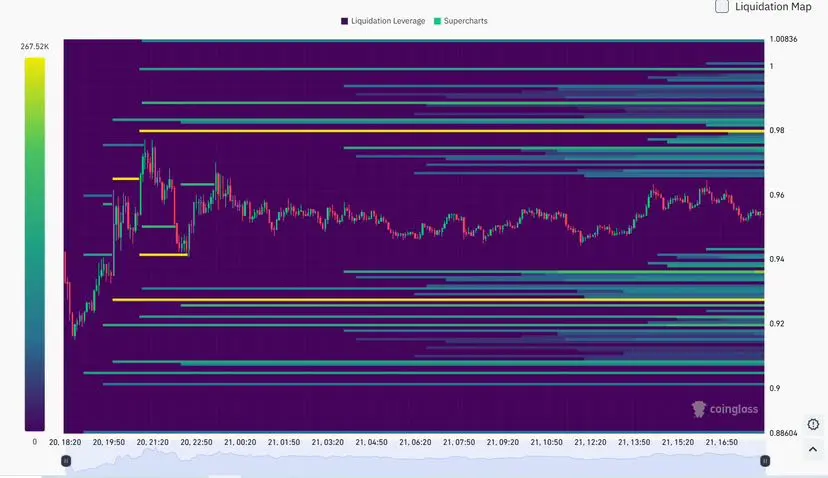
🔥 Major Strong Seller Zone:
📍 $1.00 – $1.04
According to the heatmap levels and the marked price chart, heavy liquidity and sell orders are stacked in the $1.00 – $1.04 region. This confirms strong seller interest and potential rejection if price moves into this area.
📊 Technical Outlook:
If SUI fails to break above $1.04 with strong volume, expect rejection.
Sustained rejection could p
SUI is currently facing strong short pressure between $0.95 – $0.97.
This zone is acting as immediate resistance where sellers are actively defending the price.
🔥 Major Strong Seller Zone:
📍 $1.00 – $1.04
According to the heatmap levels and the marked price chart, heavy liquidity and sell orders are stacked in the $1.00 – $1.04 region. This confirms strong seller interest and potential rejection if price moves into this area.
📊 Technical Outlook:
If SUI fails to break above $1.04 with strong volume, expect rejection.
Sustained rejection could p
SUI-8,5%
- Reward
- 2
- Comment
- Repost
- Share
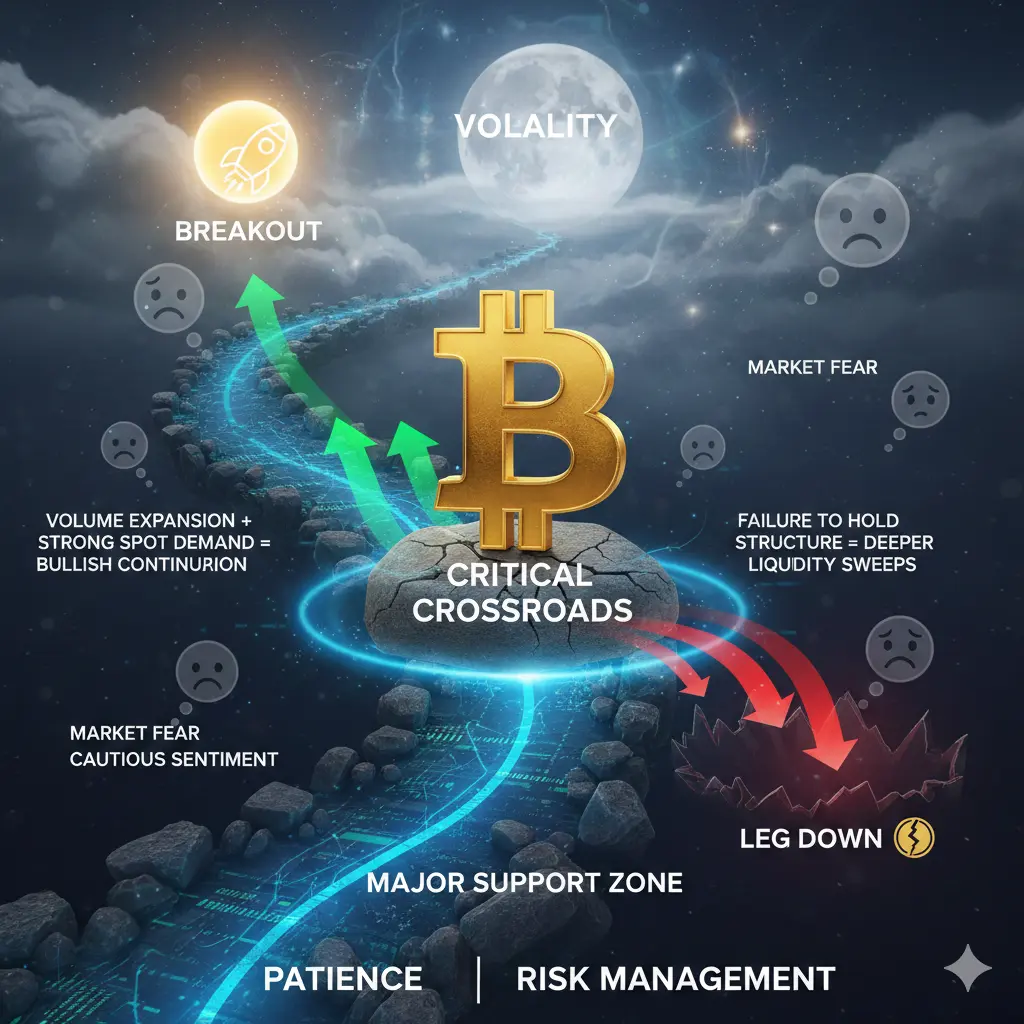
#What’sNextforBitcoin?
Bitcoin is currently standing at a critical crossroads. After recent volatility and rising market fear, the key question is whether this is consolidation before the next breakout — or preparation for another leg down.
Technically, price is reacting near major support zones while sentiment remains cautious. Historically, periods of extreme fear often appear near macro bottoms, but confirmation comes from volume expansion and strong spot demand.
If buyers defend support and reclaim key resistance levels, we could see momentum shift back to bullish continuation. However, fa
BTC-2,94%
- Reward
- 4
- 6
- Repost
- Share
Discovery :
:
2026 GOGOGO 👊View More
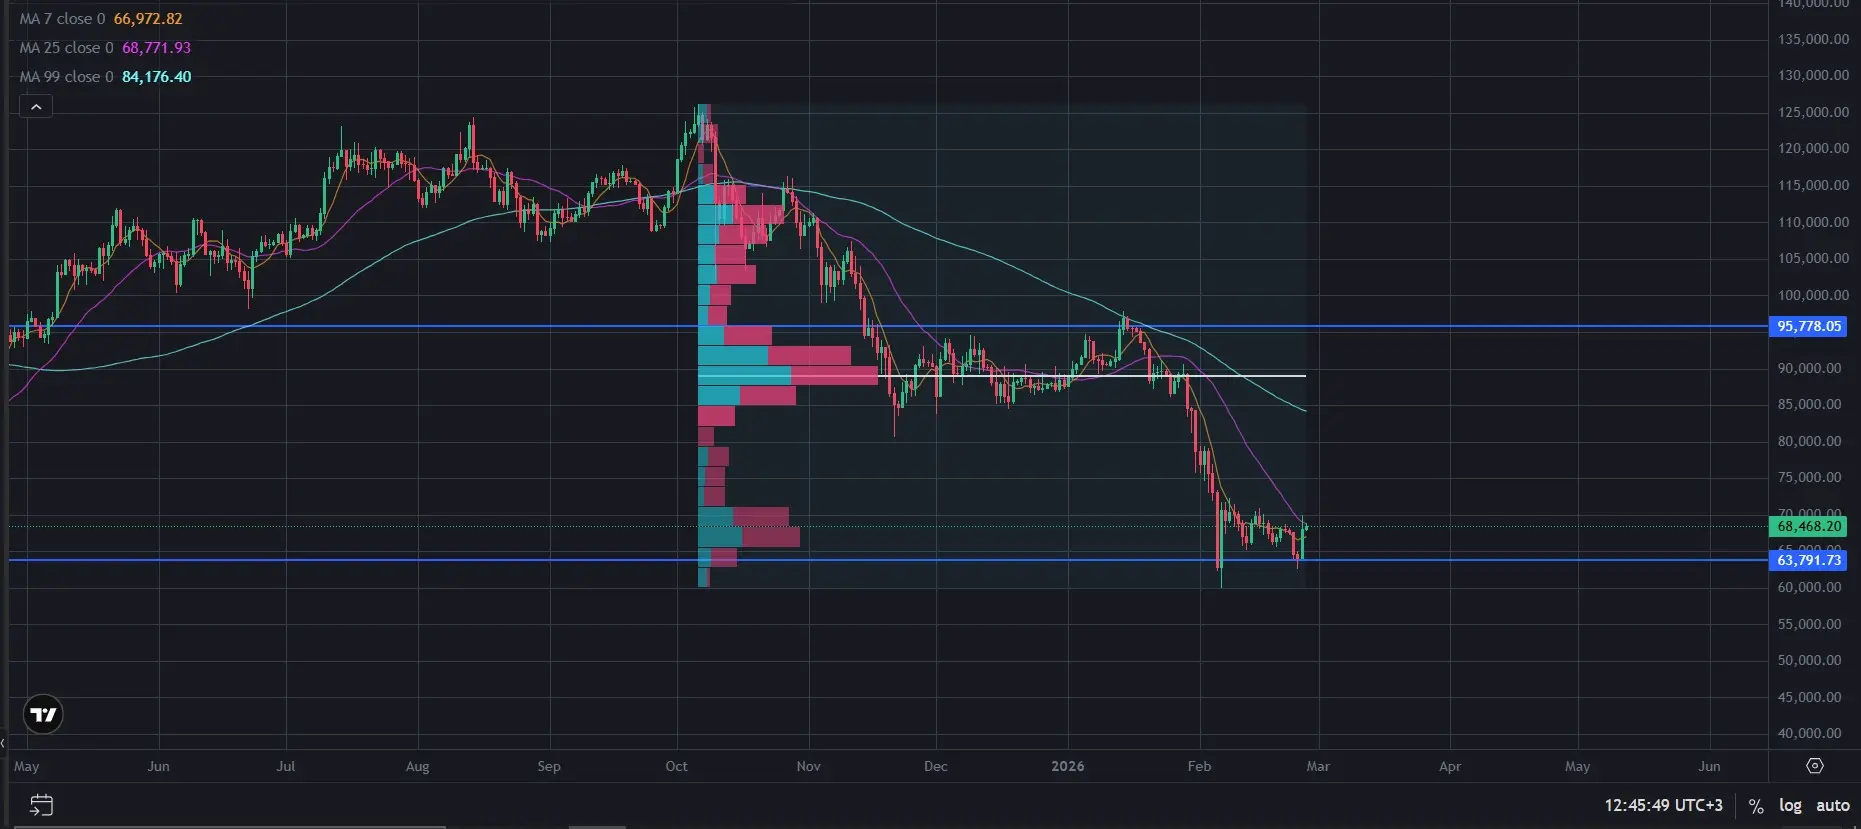
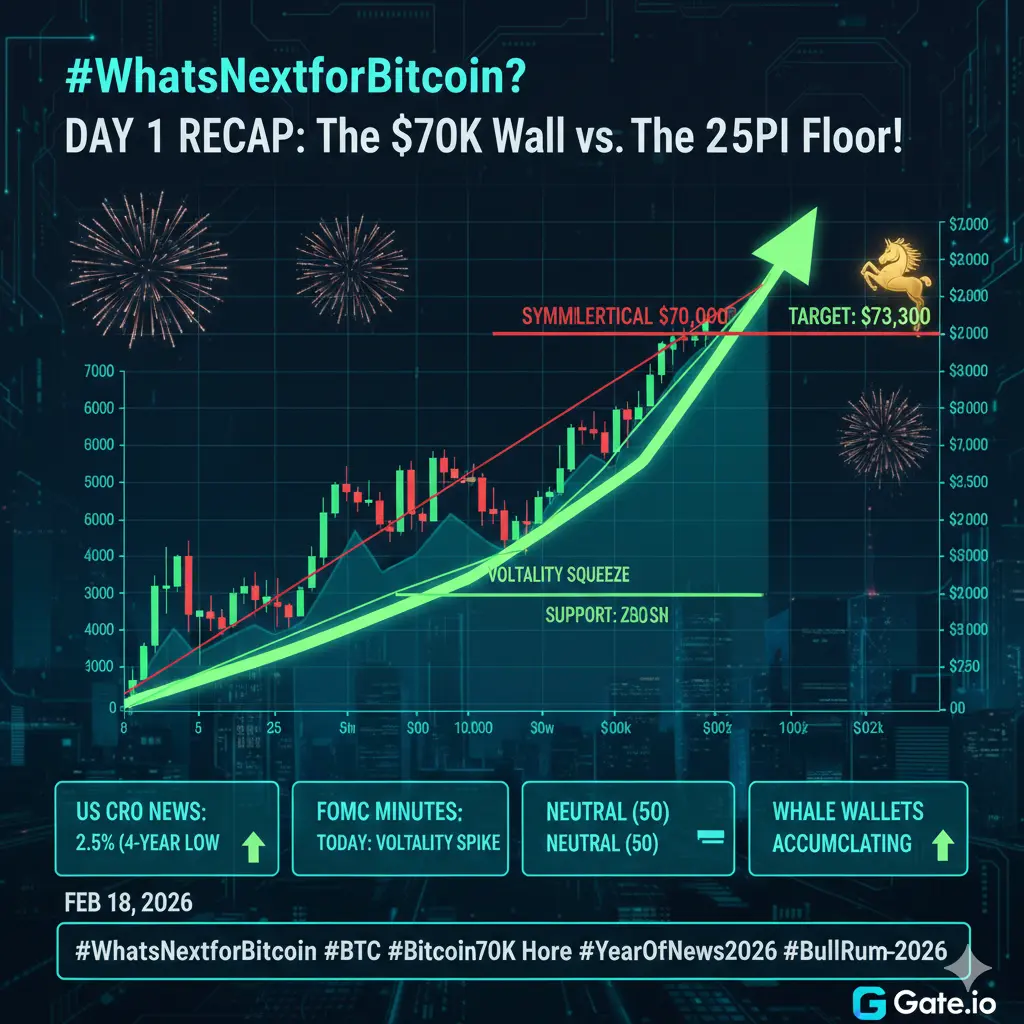
#What’sNextforBitcoin? 🚨 DAY 1 RECAP: The $70K Wall vs The 2.5% CPI Floor
It’s Wednesday, Feb 18, 2026 — and Bitcoin is NOT crashing… it’s compressing.
After reclaiming $70K yesterday, heavy resistance pushed BTC back into consolidation around $68K–$68.5K.
This isn’t weakness.
This is pressure building. ⚡
🔮 What’s Next for Bitcoin?
📊 Technical Structure
Bitcoin is forming a Symmetrical Triangle on the 4H chart — higher lows from $60K, but repeated rejection at $70K.
That means one thing:
A breakout is coming.
The trigger?
📰 FOMC Minutes today.
🏦 Macro Advantage
US Core CPI is at 2.5% (4-y
BTC-2,94%
- Reward
- 10
- 14
- Repost
- Share
Yusfirah:
LFG 🔥View More
Load More
Join 40M users in our growing community
⚡️ Join 40M users in the crypto craze discussion
💬 Engage with your favorite top creators
👍 See what interests you
Trending Topics
42.46M Popularity
150.61K Popularity
94.48K Popularity
1.66M Popularity
486.35K Popularity
9.11K Popularity
7.76K Popularity
21.37K Popularity
4.42K Popularity
362.06K Popularity
45.38K Popularity
102.18K Popularity
17.45K Popularity
70.53K Popularity
7.94K Popularity
News
View MoreIran's Supreme Leader Khamenei will deliver a speech to the nation
2 m
Trump will not deliver a nationwide speech today.
5 m
Oil tanker transportation through the Strait of Hormuz has come to a halt
8 m
Berkshire Hathaway Q4 Operating Profit Down Nearly 30% Year-over-Year
12 m
Data: Hyperliquid platform whales currently hold $3 billion in positions, with a long-short position ratio of 0.97.
14 m
Pin