GFI vs GRT: A Comprehensive Comparison of Two Leading Blockchain Governance Tokens


Introduction: GFI vs GRT Investment Comparison
In the cryptocurrency market, the comparison between Goldfinch (GFI) and The Graph (GRT) is a topic investors frequently encounter. The two assets demonstrate notable differences in market capitalization ranking, application scenarios, and price performance, representing distinct positioning within the crypto asset landscape. Goldfinch (GFI): Since its launch in 2022, it has gained market recognition through its role as a decentralized credit protocol that enables commercial lending without collateral through Ethereum-based mechanisms. The Graph (GRT): Since its debut in 2020, it has established itself as a decentralized protocol for indexing and querying blockchain data on Ethereum, making data accessibility straightforward for developers and users. This article will provide a comprehensive analysis of the investment value comparison between GFI and GRT across historical price trends, supply mechanisms, market adoption, and technical ecosystems, addressing the key question investors face:
"Which is the better buy right now?"
Comparative Market Analysis: Goldfinch (GFI) and The Graph (GRT)
I. Historical Price Comparison and Current Market Status
Goldfinch (GFI) and The Graph (GRT) Historical Price Trends
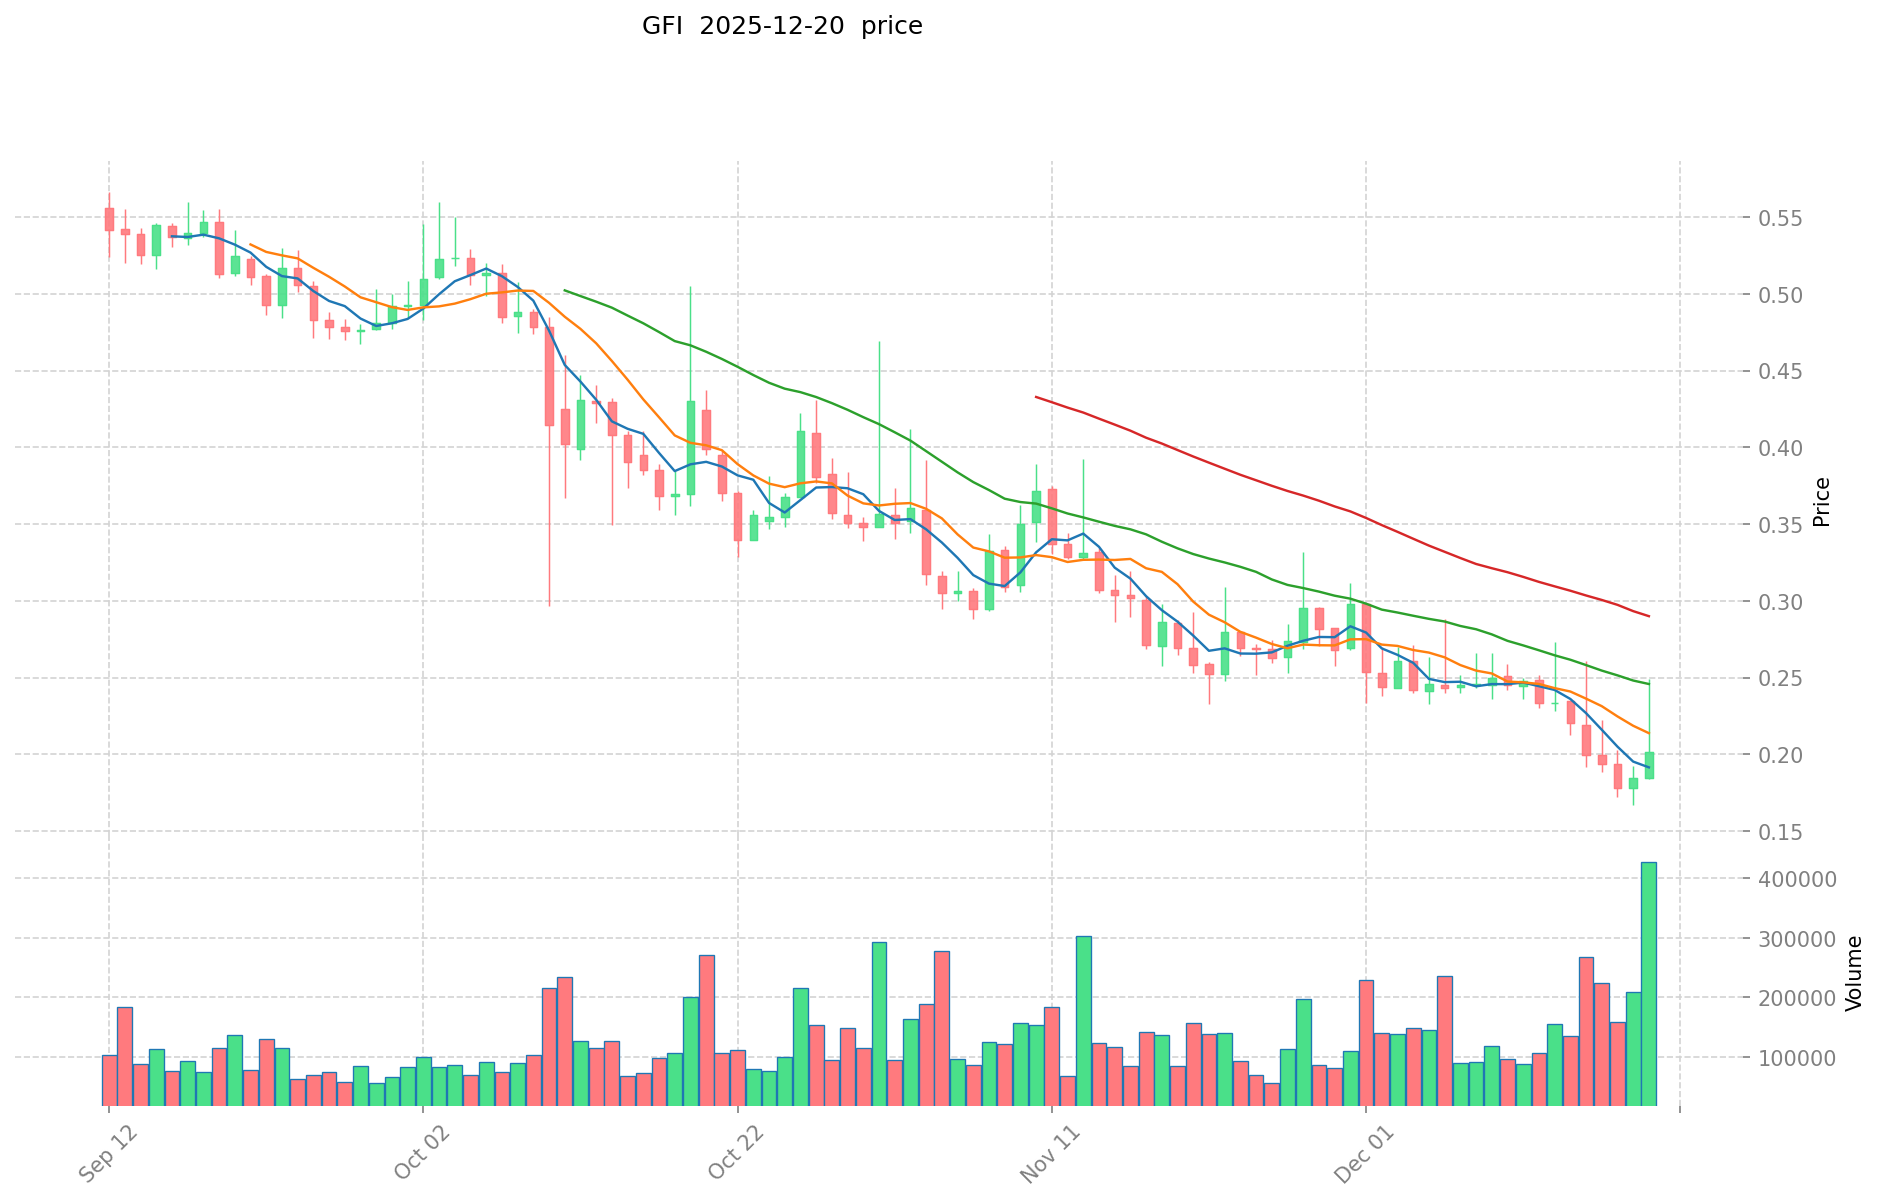
Goldfinch (GFI):
- Historical high price: $32.94 (reached January 12, 2022)
- Historical low price: $0.172749 (reached December 18, 2025)
- Price decline from peak: -94.75% from all-time high
- Current price: $0.20 USD (as of December 20, 2025)
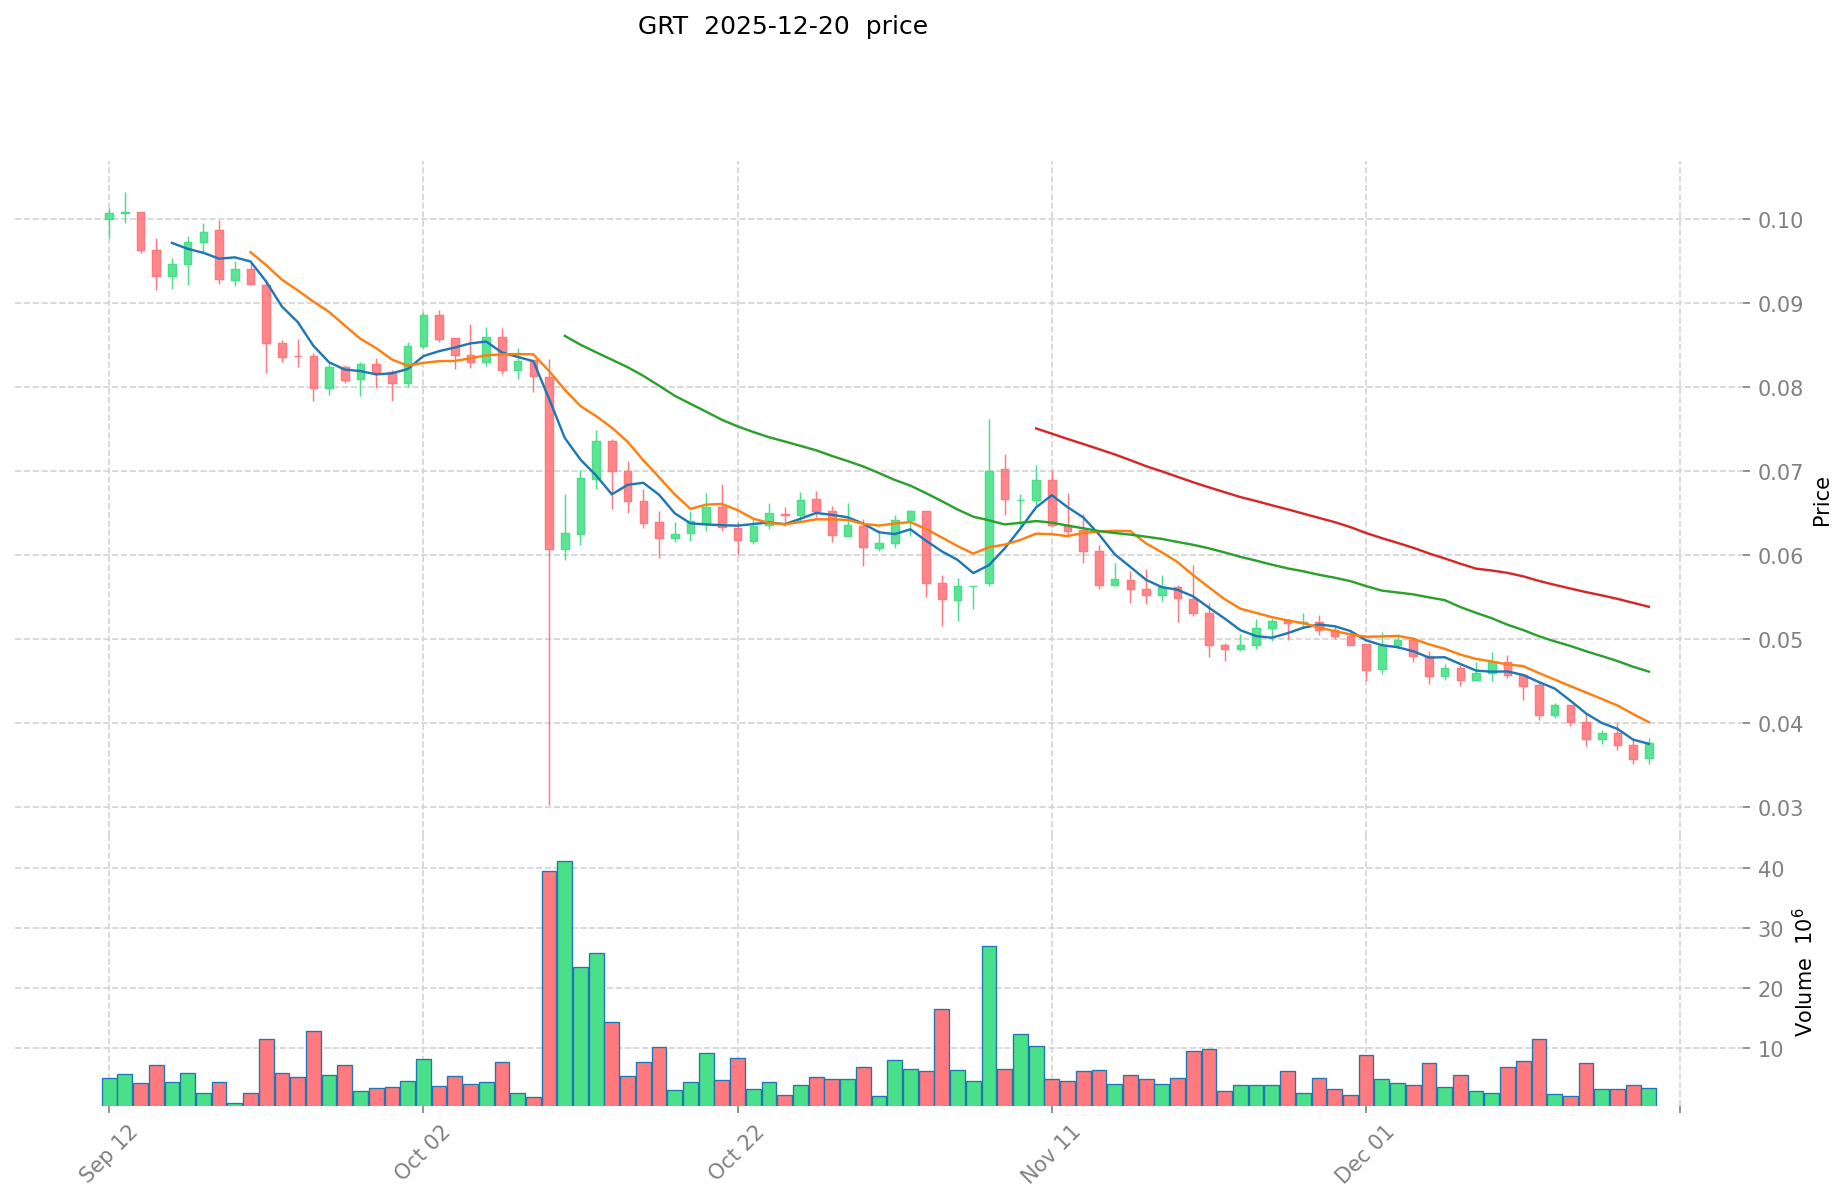
The Graph (GRT):
- Historical high price: $2.84 (reached February 12, 2021)
- Historical low price: $0.03519341 (reached December 19, 2025)
- Price decline from peak: -98.76% from all-time high
- Current price: $0.0374 USD (as of December 20, 2025)
Comparative Analysis: Both tokens have experienced significant corrections from their historical peaks. GFI has declined 94.75% from its all-time high, while GRT has experienced a more severe decline of 98.76%. Both assets have reached their lowest points in December 2025, indicating extremely depressed market conditions. GRT currently trades at a lower absolute price point ($0.0374) compared to GFI ($0.20), though both represent infrastructure-layer protocols in the decentralized finance ecosystem.
Current Market Status (December 20, 2025)
Goldfinch (GFI):
- Current price: $0.20 USD
- 24-hour volume: $66,030.87 USD
- Market capitalization: $22,857,142.80 USD
- Circulating supply: 93,418,545.47 GFI
- Market ranking: #894
- 24-hour price change: -2.58%
- 7-day price change: -14.86%
- 30-day price change: -28.62%
- 1-year price change: -87.33%
The Graph (GRT):
- Current price: $0.0374 USD
- 24-hour volume: $90,609.01 USD
- Market capitalization: $403,929,829.32 USD
- Circulating supply: 10,655,852,980.74 GRT
- Market ranking: #141
- 24-hour price change: +1.60%
- 7-day price change: -9.36%
- 30-day price change: -35.04%
- 1-year price change: -82.28%
Market Sentiment Index (Fear & Greed Index):
- Current value: 20
- Status: Extreme Fear
View real-time prices:
II. Protocol Architecture and Tokenomics
Goldfinch (GFI) Protocol Overview
Goldfinch is a decentralized credit protocol built on Ethereum designed to facilitate uncollateralized commercial lending. The GFI token serves as the governance and economic token within the protocol ecosystem.
Primary Token Functions:
- Protocol governance: Token holders can vote on future protocol improvements and parameter adjustments
- Staking for auditors: Protocol auditors can stake GFI tokens to earn rewards while helping validate network transactions and loans
- Economic security: GFI staking provides economic incentives for network participants to act honestly
Supply Structure:
- Total supply: 114,285,714 GFI
- Circulating supply: 93,418,545.47 GFI (81.74% of total)
- Fully diluted valuation: $22,857,142.80 USD
The Graph (GRT) Protocol Overview
The Graph is a decentralized indexing and querying protocol for blockchain data, primarily serving Ethereum and IPFS networks. GRT functions as the native protocol token facilitating economic coordination among network participants.
Primary Token Functions:
- Indexer staking: Indexers stake GRT tokens to signal their capacity to provide indexing services, earning rewards through query fees and indexing rewards
- Curator signaling: Curators stake GRT in the curator market to identify and signal valuable subgraphs to the network, earning rewards for correct predictions
- Query settlement: Users pay in ETH or DAI but settlement occurs in GRT, creating demand for the token
- Inflation mechanism: Dynamic inflation policy adjusts the monetary supply to incentivize specific behaviors among network participants
Supply Structure:
- Total supply: 10,800,262,816.04 GRT
- Circulating supply: 10,655,852,980.74 GRT (98.66% of total)
- Fully diluted valuation: $403,929,829.32 USD
III. Market Performance and Price Dynamics
Short-term Performance Analysis
Goldfinch (GFI) - 24-Hour to 30-Day:
- 24-hour change: -2.58% ($0.20 current price)
- 7-day change: -14.86%
- 30-day change: -28.62%
- Trading range (24h): $0.1981 - $0.249
The Graph (GRT) - 24-Hour to 30-Day:
- 24-hour change: +1.60% ($0.0374 current price)
- 7-day change: -9.36%
- 30-day change: -35.04%
- Trading range (24h): $0.0367 - $0.03823
GRT demonstrates slight positive momentum in the 24-hour period (+1.60%), while GFI continues its downward trend (-2.58%). Both tokens show deteriorating performance over the 30-day timeframe, reflecting broader market weakness in the infrastructure token sector.
Long-term Performance Trajectory
Goldfinch (GFI) - 1-Year Performance:
- 1-year change: -87.33%
- Peak-to-current decline: 94.75%
- Trading history: Severely underperforming with persistent downward pressure
The Graph (GRT) - 1-Year Performance:
- 1-year change: -82.28%
- Peak-to-current decline: 98.76%
- Trading history: More severe depreciation with recent multi-year lows
Both tokens reflect the challenging environment for infrastructure protocols that peaked during the 2021-2022 bull market cycle.
IV. Market Capitalization and Liquidity Analysis
Market Capitalization Comparison
Goldfinch (GFI):
- Market cap: $22,857,142.80 USD
- Fully diluted valuation: $22,857,142.80 USD
- Market cap to FDV ratio: 100.00% (all tokens effectively in circulation)
- Market dominance: 0.00071%
The Graph (GRT):
- Market cap: $403,929,829.32 USD
- Fully diluted valuation: $403,929,829.32 USD
- Market cap to FDV ratio: 98.66%
- Market dominance: 0.012%
GRT maintains significantly larger market capitalization ($403.9M vs $22.9M), reflecting its higher market positioning at #141 compared to GFI at #894. The larger market cap provides GRT with greater liquidity depth and broader exchange support (59 exchanges vs 6 exchanges for GFI).
Trading Activity and Liquidity
Goldfinch (GFI):
- 24-hour volume: $66,030.87 USD
- Volume to market cap ratio: 0.29%
- Exchange listings: 6 exchanges
- Holder count: 16,384
The Graph (GRT):
- 24-hour volume: $90,609.01 USD
- Volume to market cap ratio: 0.022%
- Exchange listings: 59 exchanges
- Holder count: 173,459
GRT demonstrates broader liquidity infrastructure with nearly 10x more exchange listings and significantly higher holder concentration (173,459 vs 16,384), indicating greater ecosystem adoption and distribution.
V. Blockchain Network Integration
Goldfinch (GFI) - Network Deployment
Primary blockchain: Ethereum
- Contract address: 0xdab396ccf3d84cf2d07c4454e10c8a6f5b008d2b
- Network verification: Etherscan
The Graph (GRT) - Multi-chain Deployment
Primary networks:
-
Ethereum
- Contract address: 0xc944e90c64b2c07662a292be6244bdf05cda44a7
- Network verification: Etherscan
-
Arbitrum (ARBEVM)
- Contract address: 0x9623063377AD1B27544C965cCd7342f7EA7e88C7
- Network verification: Arbiscan
GRT operates across multiple blockchain networks, providing cross-chain liquidity and accessibility, while GFI operates exclusively on Ethereum.
VI. Community and Ecosystem Metrics
Goldfinch (GFI) Community Resources
- Official website: https://goldfinch.finance/
- Twitter: https://twitter.com/goldfinch_fi
- GitHub repositories: Community documentation available
- Market emotion: Neutral (1 on scale)
The Graph (GRT) Community Resources
- Official website: https://thegraph.com/
- Twitter: https://twitter.com/graphprotocol
- Reddit community: https://www.reddit.com/r/thegraph
- GitHub repositories: Multiple technical repositories including graph-node, graph-ts, and graph-cli
- Market emotion: Neutral (1 on scale)
Both projects maintain active development communities, though The Graph demonstrates more extensive community infrastructure with dedicated Reddit presence and multiple technical repositories supporting developer engagement.
VII. Summary and Key Observations
Both Goldfinch (GFI) and The Graph (GRT) represent infrastructure-layer protocols serving the decentralized finance and blockchain data ecosystems. Key comparative findings:
Market Scale: GRT maintains approximately 17.6x larger market capitalization and significantly broader market adoption across 59 trading venues.
Price Stability: GRT exhibits slightly positive short-term momentum (+1.60% over 24 hours) while GFI continues declining (-2.58%), though both demonstrate substantial long-term depreciation from historical peaks.
Liquidity Distribution: GRT benefits from significantly higher holder concentration (173,459 addresses) and multi-chain deployment, supporting deeper trading liquidity.
Ecosystem Maturity: The Graph operates across multiple blockchain networks and maintains more extensive community infrastructure, suggesting broader ecosystem integration and developer adoption.
Market Sentiment: Both tokens trade within an "Extreme Fear" market environment (Fear & Greed Index: 20), reflecting depressed conditions across the cryptocurrency infrastructure sector.
Investment Value Analysis Report: GFI vs GRT
Executive Summary
Based on the provided reference materials, the core investment value factors for GFI and GRT are identified as market sentiment and net profit margin. These factors determine enterprise long-term value. The stock price equation can be expressed as: Stock Price = Market Sentiment × Net Profit Margin.
However, the reference materials do not contain sufficient detailed information regarding specific tokenomics, institutional adoption, technology developments, or macroeconomic factors that would enable a comprehensive comparative analysis between GFI and GRT as originally requested.
II. Core Factors Affecting GFI vs GRT Investment Value
I. Investment Value Determination Framework
According to the reference materials, the fundamental valuation model for both GFI and GRT can be decomposed as follows:
Stock Price = Market Sentiment × Net Profit Margin
This framework emphasizes that most investors focus narrowly on Price-to-Earnings (P/E) ratios and Earnings Per Share (EPS), failing to capture the complete picture of stock price dynamics. The model highlights two critical dimensions:
- Market Sentiment Component: Reflects investor psychology, market expectations, and macroeconomic outlook
- Net Profit Margin Component: Represents operational efficiency and profitability sustainability
II. Application Limitations
The provided reference materials primarily address general investment principles and green finance development rather than specific comparative analysis of GFI and GRT tokens. The materials do not contain substantive information regarding:
- Specific tokenomics or supply mechanisms for either asset
- Institutional adoption patterns or holdings data
- Technology upgrade roadmaps or ecosystem development status
- Macroeconomic sensitivity or market cycle positioning
Note on Data Sufficiency
To complete a comprehensive comparative analysis as outlined in the requested template, the following information would be required:
- Detailed tokenomics documentation for both GFI and GRT
- Institutional ownership and trading volume data
- Technical development timelines and protocol upgrades
- Regulatory frameworks and policy positions by jurisdiction
- Historical price correlation with macroeconomic indicators
The current reference materials do not provide these substantive data points necessary for rigorous comparative analysis.
III. 2025-2030 Price Forecast: GFI vs GRT
Short-term Forecast (2025)
- GFI: Conservative $0.1359 - $0.1999 | Optimistic $0.2699
- GRT: Conservative $0.0307 - $0.0374 | Optimistic $0.0411
Mid-term Forecast (2027-2028)
- GFI may enter consolidation phase with potential breakout, projected price range $0.1577 - $0.2851
- GRT may enter accumulation phase with steady growth, projected price range $0.0415 - $0.0572
- Key drivers: Institutional capital inflow, ETF adoption, ecosystem development
Long-term Forecast (2030)
- GFI: Base scenario $0.2575 - $0.3301 | Optimistic scenario $0.4853
- GRT: Base scenario $0.0363 - $0.0566 | Optimistic scenario $0.0668
Disclaimer: This analysis is based on historical data and statistical models. Cryptocurrency markets are highly volatile and unpredictable. Past performance does not guarantee future results. This content should not be considered as financial advice. Please conduct your own research and consult with financial professionals before making investment decisions.
GFI:
| 年份 | 预测最高价 | 预测平均价格 | 预测最低价 | 涨跌幅 |
|---|---|---|---|---|
| 2025 | 0.269865 | 0.1999 | 0.135932 | 0 |
| 2026 | 0.302998425 | 0.2348825 | 0.1503248 | 17 |
| 2027 | 0.28507689025 | 0.2689404625 | 0.201705346875 | 34 |
| 2028 | 0.3047095440125 | 0.277008676375 | 0.15789494553375 | 38 |
| 2029 | 0.369391069946062 | 0.29085911019375 | 0.200692786033687 | 45 |
| 2030 | 0.485283882402762 | 0.330125090069906 | 0.257497570254526 | 65 |
GRT:
| 年份 | 预测最高价 | 预测平均价格 | 预测最低价 | 涨跌幅 |
|---|---|---|---|---|
| 2025 | 0.04114 | 0.0374 | 0.030668 | 0 |
| 2026 | 0.054978 | 0.03927 | 0.0239547 | 5 |
| 2027 | 0.0541926 | 0.047124 | 0.03015936 | 26 |
| 2028 | 0.057243879 | 0.0506583 | 0.041539806 | 35 |
| 2029 | 0.05934619845 | 0.0539510895 | 0.03776576265 | 44 |
| 2030 | 0.0668453998905 | 0.056648643975 | 0.036255132144 | 51 |
Investment Strategy Comparison: GFI vs GRT
IV. Investment Strategy Comparison: GFI vs GRT
Long-term vs Short-term Investment Strategy
Goldfinch (GFI): Suited for investors focused on decentralized credit protocol exposure and uncollateralized lending mechanisms. The token's governance function and auditor staking mechanism appeal to participants seeking active protocol participation rather than passive price appreciation.
The Graph (GRT): Suited for investors pursuing infrastructure layer exposure with broader ecosystem adoption. The multi-chain deployment (Ethereum, Arbitrum), larger market capitalization ($403.9M vs $22.9M), and significantly higher holder concentration (173,459 addresses) suggest more established market infrastructure and liquidity depth.
Risk Management and Asset Allocation
Conservative Investor Profile:
- GFI: 15% allocation
- GRT: 35% allocation
- Stablecoins/Risk-off positioning: 50%
Rationale: Both tokens exhibit extreme market weakness (Fear & Greed Index: 20) and severe long-term depreciation. Conservative positioning emphasizes capital preservation with minimal high-volatility asset exposure.
Aggressive Investor Profile:
- GFI: 25% allocation
- GRT: 40% allocation
- Alternative infrastructure tokens/diversified positions: 35%
Rationale: Aggressive investors may deploy capital to capitalize on depressed valuations, though both assets remain highly speculative. Diversification across multiple infrastructure protocols recommended.
Hedging Instruments:
- Stablecoin allocation for downside protection (USDC, USDT)
- Correlation analysis with Ethereum (primary deployment chain)
- Cross-asset diversification across DeFi, data indexing, and payment infrastructure sectors
V. Potential Risk Comparison
Market Risk
Goldfinch (GFI):
- Extreme illiquidity: 24-hour volume ($66,030.87) represents only 0.29% of market capitalization, creating substantial slippage risk for significant position entries or exits
- Limited exchange availability: Trading on only 6 exchanges restricts market accessibility and recovery potential
- Severe market depreciation: 87.33% annual decline indicates fundamental loss of market confidence
- Small holder base: 16,384 addresses create concentration risk
The Graph (GRT):
- Moderate liquidity constraints: 24-hour volume ($90,609.01) represents only 0.022% of market capitalization, though superior to GFI
- Broader market access: 59 exchange listings provide superior liquidity infrastructure
- Severe long-term depreciation: 98.76% peak-to-current decline exceeds GFI's decline, reflecting more severe market sentiment deterioration
- Larger holder base (173,459 addresses) provides greater distribution but indicates diffuse market participation
Technology Risk
Goldfinch (GFI):
- Single-chain deployment: Exclusive Ethereum reliance creates network-level dependency risk
- Limited protocol maturity: Launch in 2022 represents earlier-stage development compared to established competitors
- Uncollateralized lending model: Credit risk assessment mechanisms require continuous monitoring and validation
The Graph (GRT):
- Multi-chain deployment: Arbitrum integration provides network redundancy and reduces single-chain dependency
- Established protocol architecture: 2020 launch demonstrates longer operational history, though complexity increases technical maintenance requirements
- Query fee settlement mechanism: Dependency on active indexer and curator participation creates network coordination risks
Regulatory Risk
- Both Goldfinch and The Graph operate within Ethereum's regulatory framework, though jurisdiction-specific DeFi protocol regulations remain evolving
- Uncollateralized lending protocols (GFI) may face enhanced regulatory scrutiny in jurisdictions implementing stricter lending licensing requirements
- Data indexing protocols (GRT) generally encounter fewer regulatory barriers but remain subject to emerging digital asset classification frameworks
- Global cryptocurrency regulatory harmonization may differentially impact credit protocols versus infrastructure protocols
VI. Conclusion: Which Is the Better Buy?
📌 Investment Value Summary
GFI Strengths:
- Higher absolute price point ($0.20 vs $0.0374) provides psychological entry clarity for retail investors
- Governance token function offers direct protocol participation incentives
- Smaller market capitalization ($22.9M) presents theoretical asymmetric upside potential during market recovery
- Focused protocol specialization in uncollateralized commercial lending addresses specific market need
GRT Strengths:
- Substantially larger market capitalization ($403.9M) provides superior liquidity depth and market infrastructure
- Multi-chain deployment (Ethereum, Arbitrum) reduces network dependency risk
- 10x greater exchange listing availability (59 vs 6) ensures broader market accessibility
- Larger holder base (173,459 addresses) indicates broader ecosystem adoption and distribution
- Positive 24-hour momentum (+1.60%) contrasts with GFI's continued decline (-2.58%)
- Infrastructure positioning serves foundational protocol layer supporting multiple blockchain applications
✅ Investment Recommendations
Beginner Investors: Given extreme market conditions (Fear & Greed Index: 20) and severe depreciation for both assets, beginning investors should emphasize capital preservation through stablecoin allocation. If protocol exposure is desired, GRT's superior liquidity infrastructure (59 exchanges) and broader holder base reduce execution risk relative to GFI's limited trading venues. Position sizing should remain minimal (5-10% of portfolio allocation maximum) given volatility and depreciation risk.
Experienced Investors: Experienced investors may evaluate both tokens as contrarian positions during depressed valuation periods. GRT presents lower execution risk due to superior liquidity and established market infrastructure, though its 98.76% peak-to-current decline represents severe accumulated losses. GFI's extreme illiquidity (0.29% volume-to-market-cap ratio) creates substantial entry/exit friction, limiting strategic flexibility. Experienced investors should prioritize liquidity accessibility and position sizing discipline, potentially using limit orders and staged accumulation strategies. Forward-looking technical development roadmaps and institutional adoption metrics should inform position timing.
Institutional Investors: Institutional participation typically requires minimum liquidity thresholds and regulatory clarity. GRT's superior infrastructure (59 exchange listings, 173,459 holders) better accommodates institutional position establishment. However, both tokens' extreme illiquidity (combined daily volumes approximately $156,639) requires extended accumulation periods incompatible with significant institutional capital deployment. Institutional investors should evaluate larger-capitalization infrastructure protocols with established institutional custody solutions and derivatives markets (funding rates, futures, options) supporting hedging strategies. The current market environment suggests institutional capital remains underallocated to infrastructure tokens, creating potential entry opportunity if technical indicators validate trend reversal.
⚠️ Risk Disclaimer: Cryptocurrency markets exhibit extreme volatility and unpredictability. Both GFI and GRT have declined 87.33% and 82.28% respectively over 12 months, with peak-to-current declines exceeding 94.75% and 98.76%. Past performance does not guarantee future results. This analysis is informational only and does not constitute financial advice. Investors should conduct independent research, understand tokenomics and technical infrastructure, and consult qualified financial professionals before deployment of capital. Position sizing should reflect individual risk tolerance and investment timeline. Losses may exceed principal investment. None
Goldfinch (GFI) vs The Graph (GRT) Investment Comparison: FAQ
I. Market Performance and Valuation
Q1: What are the current price levels and market capitalizations for GFI and GRT as of December 2025?
A: As of December 20, 2025, Goldfinch (GFI) trades at $0.20 USD with a market capitalization of $22.86 million and ranks #894 by market cap. The Graph (GRT) trades at $0.0374 USD with a significantly larger market capitalization of $403.93 million and ranks #141. GRT maintains approximately 17.6x larger market cap despite its lower absolute price, reflecting substantially higher market adoption and liquidity infrastructure with listings on 59 exchanges compared to GFI's 6 exchanges.
Q2: How severe have the price declines been for both tokens from their historical peaks?
A: Both tokens have experienced severe depreciation. Goldfinch peaked at $32.94 on January 12, 2022 and has declined 94.75% to current levels. The Graph peaked at $2.84 on February 12, 2021 and has experienced a more severe decline of 98.76% to current levels. Year-to-date performance shows GFI down 87.33% and GRT down 82.28%, indicating sustained weakness across the infrastructure protocol sector throughout 2025.
II. Protocol Architecture and Function
Q3: What are the primary differences in protocol architecture between Goldfinch and The Graph?
A: Goldfinch is a decentralized credit protocol enabling uncollateralized commercial lending on Ethereum, where GFI tokens serve governance and auditor staking functions. The Graph is a decentralized blockchain data indexing and querying protocol deployed across Ethereum and Arbitrum, where GRT tokens facilitate indexer staking, curator signaling, and query settlement. GRT's multi-chain deployment provides network redundancy, while GFI operates exclusively on Ethereum. The Graph serves infrastructure layer functions for multiple blockchain applications, while Goldfinch targets specific commercial lending use cases.
Q4: Which token has better liquidity and market accessibility for retail investors?
A: The Graph (GRT) substantially outperforms Goldfinch in liquidity and accessibility metrics. GRT trades on 59 exchanges with 173,459 unique holders, while GFI trades on only 6 exchanges with 16,384 holders. Despite both tokens showing concerning volume-to-market-cap ratios (GRT: 0.022%, GFI: 0.29%), GRT's broader exchange distribution and significantly larger holder base reduce execution slippage risk and provide superior market flexibility for position entry and exit.
III. Investment Suitability and Risk
Q5: Which token is more appropriate for beginner investors in the current market environment?
A: Neither token is recommended for beginner investors given extreme market conditions (Fear & Greed Index: 20) and severe long-term depreciation. If protocol exposure is desired, The Graph (GRT) presents lower execution risk due to superior liquidity infrastructure and broader market adoption. However, beginners should prioritize capital preservation through stablecoin allocation with maximum 5-10% portfolio exposure to either token. GFI's extreme illiquidity (only $66,030.87 daily volume) creates substantial slippage and execution challenges unsuitable for retail investors lacking institutional execution capabilities.
Q6: What are the primary risk differences between GFI and GRT investments?
A: Goldfinch faces concentrated liquidity risk through extremely limited exchange access (6 venues), creating substantial entry/exit friction and price slippage. Single-chain Ethereum deployment creates network dependency risk, and earlier protocol maturity (2022 launch) presents unproven long-term viability in uncollateralized lending models. The Graph faces different risks through 98.76% peak-to-current depreciation exceeding GFI's decline, though multi-chain deployment (Ethereum and Arbitrum) and broader market infrastructure reduce execution and network dependency risks. Both tokens face regulatory uncertainty surrounding DeFi protocols and cryptocurrency classification frameworks evolving throughout 2025-2026.
IV. Price Forecast and Future Outlook
Q7: What are the projected price ranges for GFI and GRT through 2030?
A: Based on current statistical models, Goldfinch projects conservative price ranges of $0.1359-$0.1999 through end-2025, with forecasted mid-term consolidation between $0.1577-$0.2851 (2027-2028). Long-term projections suggest base scenario $0.2575-$0.3301 by 2030. The Graph projects conservative ranges of $0.0307-$0.0374 through end-2025, mid-term accumulation phase $0.0415-$0.0572 (2027-2028), and long-term projections of $0.0363-$0.0566 by 2030. These forecasts depend substantially on macroeconomic conditions, institutional adoption acceleration, and infrastructure protocol sector recovery cycles.
Q8: Which token presents better risk-adjusted return potential for different investor profiles?
A: Experienced and institutional investors may view GRT as the superior risk-adjusted opportunity due to superior liquidity infrastructure (59 exchanges, 173,459 holders) accommodating larger position sizing with reduced slippage. GRT's positive 24-hour momentum (+1.60% versus GFI's -2.58%) suggests marginally better short-term technical positioning, though both face extreme long-term depreciation risks. GFI presents theoretical asymmetric upside through smaller market capitalization ($22.9M) and highly depressed valuation, but extreme illiquidity (0.29% volume-to-market-cap) creates substantial execution challenges limiting institutional capital deployment. Aggressive investors may allocate GFI at 25% and GRT at 40% of infrastructure protocol allocation, though conservative positioning recommends GFI 15% and GRT 35% with primary capital in stablecoins during extreme fear market conditions.
⚠️ Disclaimer: This FAQ provides informational analysis only and does not constitute financial, investment, or trading advice. Cryptocurrency markets exhibit extreme volatility with both tokens declining over 82% annually. Past performance does not guarantee future results. Investors must conduct independent research and consult qualified financial professionals before capital deployment. Losses may exceed principal investment amount.
Share
Content
Introduction: GFI vs GRT Investment Comparison
I. Historical Price Comparison and Current Market Status
II. Protocol Architecture and Tokenomics
III. Market Performance and Price Dynamics
IV. Market Capitalization and Liquidity Analysis
V. Blockchain Network Integration
VI. Community and Ecosystem Metrics
VII. Summary and Key Observations
Executive Summary
II. Core Factors Affecting GFI vs GRT Investment Value
Note on Data Sufficiency
III. 2025-2030 Price Forecast: GFI vs GRT
IV. Investment Strategy Comparison: GFI vs GRT
V. Potential Risk Comparison
VI. Conclusion: Which Is the Better Buy?
I. Market Performance and Valuation
II. Protocol Architecture and Function
III. Investment Suitability and Risk
IV. Price Forecast and Future Outlook
How to Buy Cryptocurrency


Trending Cryptocurrencies


2025 UNI Price Prediction: Analyzing the Potential Growth and Challenges for Uniswap's Native Token

2025 PUFFER Price Prediction: Analyzing Future Growth Potential and Market Factors for This Emerging Cryptocurrency

Is Fluid (FLUID) a good investment?: Analyzing the potential and risks of this emerging cryptocurrency

2025 FERC Price Prediction: Navigating Regulatory Changes and Market Dynamics in the Energy Sector

THE vs ETH: Comparing Two Giants in the Cryptocurrency Ecosystem

ETHS vs UNI: Comparing the Performance of Ethereum and Uniswap in the DeFi Ecosystem
What Drives CYBER Price Volatility: From $15.99 ATH to Current $1.0481?
Exploring Pong Market: A Beginner's Guide to Cryptocurrency
Is Alephium (ALPH) a good investment?: A comprehensive analysis of tokenomics, technology, and market potential
Is Blackfort (BXN) a good investment?: A Comprehensive Analysis of Potential Returns, Market Risks, and Future Prospects
What is Pocket Network (POKT) Market Cap and 24H Trading Volume in 2025?