TAO vs ENJ: Comparing Two Leading Blockchain Gaming and NFT Tokens in 2024

Introduction: TAO vs ENJ Investment Comparison
In the cryptocurrency market, comparisons between Bittensor and Enjin Coin have become an important topic for investors. The two assets differ significantly in market capitalization ranking, application scenarios, and price performance, representing different positions within the crypto asset landscape. Bittensor (TAO): This decentralized machine learning network enables collaborative training and deployment of machine learning models, with the TAO token rewarding participants for their contributions to the ecosystem. Enjin Coin (ENJ): Launched in 2009 as the largest online game community creation platform, Enjin has evolved to integrate blockchain technology, allowing players, content creators, and game publishers to add virtual goods and provide value to gaming and community ecosystems. This article will provide a comprehensive analysis of TAO vs ENJ investment value comparison across historical price trends, supply mechanisms, market adoption, technological ecosystems, and future outlook, attempting to address the question most investors are concerned about:
"Which is the better buy right now?"
Comparative Analysis Report: Bittensor (TAO) and Enjin Coin (ENJ)
I. Historical Price Comparison and Current Market Status
Bittensor (TAO) and Enjin Coin (ENJ) Historical Price Trends
Bittensor (TAO):
- All-time high: $795.60 (April 11, 2024)
- All-time low: $21.428 (September 5, 2023)
- Price decline from ATH to current levels: approximately 66.5% decrease
Enjin Coin (ENJ):
- All-time high: $4.82 (November 25, 2021)
- All-time low: $0.01865964 (November 12, 2017)
- Price decline from ATH to current levels: approximately 99.4% decrease
Comparative Analysis: TAO has experienced significant volatility since its 2024 peak, while ENJ has undergone a prolonged downturn spanning multiple market cycles. Both assets demonstrate substantial depreciation from their historical highs, though TAO's recent entry into mainstream attention has provided relatively better price retention compared to ENJ's extended bear market performance.
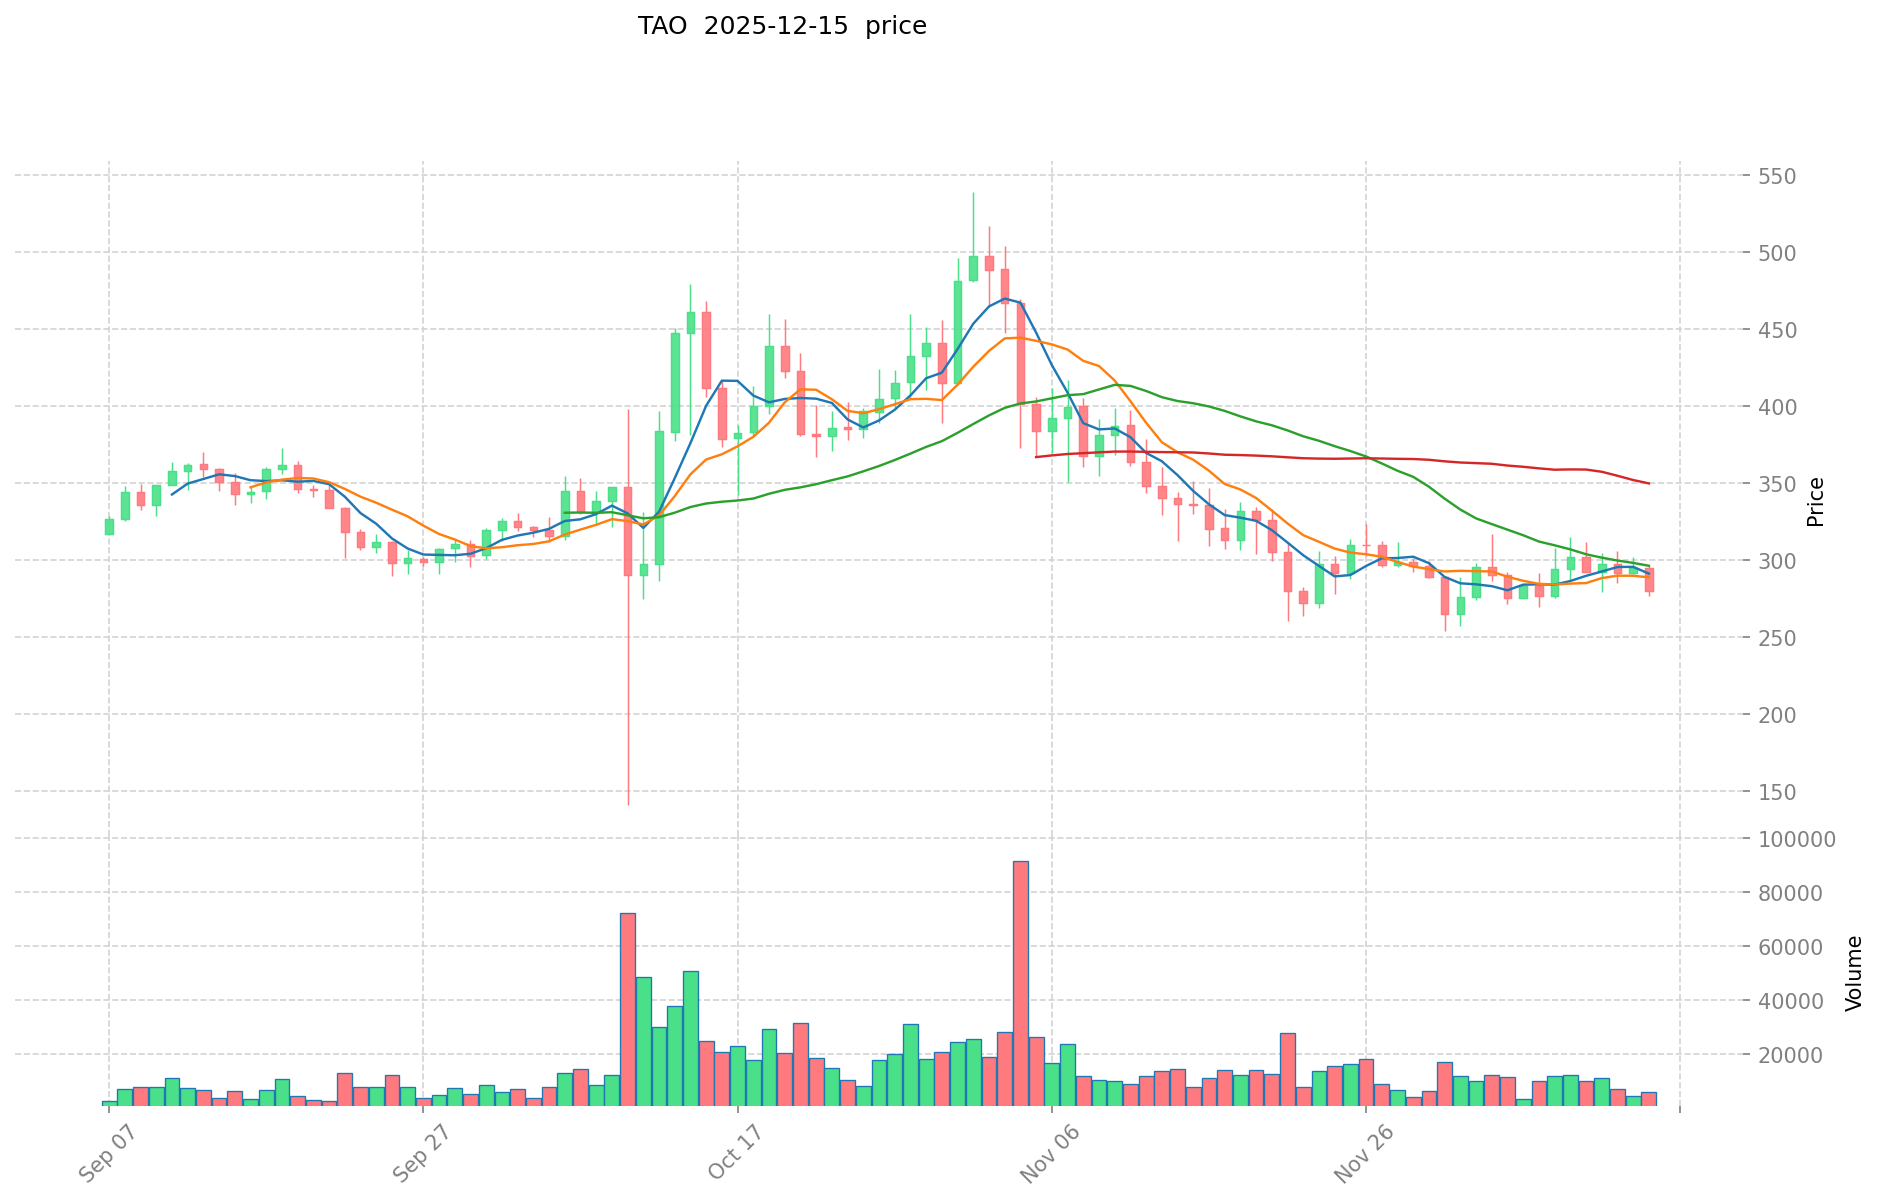
Current Market Status (December 16, 2025)
Price Metrics:
- TAO current price: $266.50
- ENJ current price: $0.02815
24-Hour Trading Activity:
- TAO 24-hour trading volume: $3,253,318.56
- ENJ 24-hour trading volume: $99,092.48
- TAO market dominance significantly exceeds ENJ volume by approximately 32.8x
Market Sentiment Index: Crypto Fear & Greed Index stands at 16, indicating "Extreme Fear" market conditions as of December 15, 2025.
View real-time prices:
II. Market Capitalization and Valuation Analysis
Bittensor (TAO):
- Total market cap: $5,596,500,000
- Circulating market cap: $2,557,731,351.50
- Circulating supply: 9,597,491 TAO
- Total supply: 21,000,000 TAO
- Circulation ratio: 45.70%
- Market dominance: 0.17%
- Ranking: #44
Enjin Coin (ENJ):
- Total market cap: $51,013,765.77
- Circulating market cap: $53,841,145.45
- Circulating supply: 1,912,651,703.30 ENJ
- Total supply: 1,812,211,928 ENJ
- Circulation ratio: 191.27%
- Market dominance: 0.0016%
- Ranking: #488
Analysis: TAO demonstrates substantially larger market capitalization and liquidity, with a market cap approximately 109.7 times greater than ENJ. The circulation ratio discrepancy reflects different tokenomic structures, with TAO's lower circulation ratio suggesting greater scarcity relative to maximum supply.
III. Price Performance and Market Volatility
Short-Term Price Movements (TAO):
| Time Period | Price Change | Change Amount |
|---|---|---|
| 1 Hour | -1.37% | -$3.70 |
| 24 Hours | -7.65% | -$22.08 |
| 7 Days | -9.16% | -$26.87 |
| 30 Days | -21.33% | -$72.26 |
| 1 Year | -52.41% | -$293.49 |
Short-Term Price Movements (ENJ):
| Time Period | Price Change | Change Amount |
|---|---|---|
| 1 Hour | -0.77% | -$0.000218 |
| 24 Hours | -8.57% | -$0.00264 |
| 7 Days | -13.38% | -$0.00435 |
| 30 Days | -27.27% | -$0.01055 |
| 1 Year | -90.64% | -$0.2726 |
Volatility Assessment: Both assets are experiencing bearish pressure across all time horizons. ENJ exhibits more severe long-term depreciation with a 1-year decline of 90.64%, while TAO's 1-year decline of 52.41% reflects relative resilience. Current market conditions show heightened short-term volatility for both assets, particularly in the 24-hour to 30-day windows.
IV. Project Overview and Ecosystem Context
Bittensor (TAO):
Bittensor operates as a decentralized machine learning network built on blockchain technology. The platform functions as an open, self-governed, tokenized market system designed for artificial intelligence technology development and distribution. The network employs a Substrate-based blockchain architecture utilizing proof-of-stake consensus mechanisms for energy efficiency.
Primary Functions:
- Decentralized collaboration for training and deploying machine learning models
- Token utility for rewarding network participants and miners
- Incentive distribution for computational contributions
- Transaction fee payment and network governance
- Access to machine learning services
- staking mechanism for network security enhancement
Enjin Coin (ENJ):
Enjin represents the largest online gaming community creation platform, established in 2009 with headquarters in Singapore. The platform operates infrastructure for gaming community management including guild systems, esports teams, Minecraft servers, role-playing communities, and fan websites. The ecosystem currently encompasses approximately 250,000 gaming communities with 18.7 million registered players and approximately 60 million monthly global gaming player visits.
Primary Functions:
- Virtual goods management within gaming communities
- Blockchain-based transformation of existing gaming infrastructure
- Value provision for games and community ecosystems
- Community store monetization enabling millions in monthly virtual good sales
V. Ecosystem Participants and Holder Distribution
Bittensor (TAO):
- Total token holders: 404,473
- Exchange listing count: 31 major exchanges
- Change from ICO price: 1.6404x
Enjin Coin (ENJ):
- Total token holders: 153,663
- Exchange listing count: 42 major exchanges
- Circulation exceeds total supply indicating complex tokenomic structure
Comparative Insights: TAO demonstrates higher per-holder concentration with fewer total holders but greater market cap, suggesting more concentrated investor distribution. ENJ's greater exchange listing prevalence (42 vs 31) contrasts with significantly lower trading volume and market activity.
VI. Network Architecture and Technical Foundation
Bittensor (TAO):
- Blockchain architecture: Substrate-based (similar to Polkadot ecosystem)
- Consensus mechanism: Proof of Stake (PoS)
- Energy efficiency focus
- Decentralized machine learning network topology
- Official channels: Website, documentation, GitHub repository, blockchain explorer
Enjin Coin (ENJ):
- Gaming ecosystem infrastructure
- Content management system focus
- Forum and creator platform emphasis
- Community governance framework
- Official channels: Website, GitHub repository (ERC-1155 standards), blockchain explorer
VII. Community Engagement and Information Resources
Bittensor (TAO):
- Official website: https://bittensor.com/
- Documentation: https://docs.bittensor.com/
- GitHub: https://github.com/opentensor/BitTensor
- Whitepaper: https://bittensor.com/whitepaper
- Blockchain explorer: https://x.taostats.io/
- Social media: @opentensor (X/Twitter)
Enjin Coin (ENJ):
- Official website: https://enjin.io/
- GitHub: https://github.com/enjin/erc-1155
- Whitepaper: https://enjincoin.io/enjincoin_whitepaper.pdf
- Blockchain explorer: https://enjin.subscan.io/
- Social media: @enjin (Twitter), r/EnjinCoin (Reddit)
VIII. Key Observations and Market Context
Market Condition Summary: The current extreme fear market sentiment (Fear & Greed Index: 16) indicates widespread risk aversion across the cryptocurrency market. Both TAO and ENJ face downward price pressure, with ENJ experiencing substantially more severe long-term decline.
Liquidity Considerations: TAO maintains significantly higher trading volume and market liquidity, facilitating easier position entry and exit compared to ENJ's comparatively constrained trading activity.
Market Position: TAO's ranking at #44 by market cap positions it within the top-tier cryptocurrency assets, while ENJ's #488 ranking reflects diminished market prominence and reduced institutional attention.
Report Date: December 16, 2025

Investment Value Analysis: TAO vs ENJ
II. Core Factors Influencing Investment Value of TAO vs ENJ
Market Sentiment and Regulatory Environment
-
Market Sentiment Impact: Both TAO and ENJ are subject to investor sentiment fluctuations, which represent a primary driver of price volatility across the crypto asset market. Market perception of technological progress and adoption potential directly influences trading behavior and valuation multiples.
-
Regulatory Concerns: ENJ has experienced price volatility incidents associated with market manipulation allegations. Specifically, ENJ and other tokens such as ATOM experienced "flash crashes" on certain exchanges where prices momentarily collapsed to zero before rapidly recovering, triggering user accusations of market manipulation during periods of market confusion.
Technology Application and Ecosystem Positioning
-
ENJ Application Focus: Enjin Coin (ENJ) provides foundational support for in-game NFTs, positioning itself within the gaming and digital collectibles ecosystem. The token's value proposition is directly tied to demand for NFT functionality within gaming environments.
-
Comparative Technology Solutions: In the broader NFT ecosystem, other projects such as Immutable (IMX) address specific pain points like elevated "miner fees," enabling players to mint and trade with zero gas costs. These technological differentiators influence relative competitive positioning between tokens.
Macroeconomic Context
-
Interest Rate Environment: Lower interest rates typically encourage investment in higher-risk, higher-volatility assets such as cryptocurrencies and equities, as investors seek elevated returns. This macroeconomic factor influences capital flows into the crypto sector broadly.
-
Market Cycle Dynamics: The broader crypto market exhibits cyclical patterns influenced by regulatory developments, technological innovations, and macroeconomic policy shifts. Both TAO and ENJ are subject to these systemic market forces.
Current Market Data (Reference Point)
- ENJ Market Metrics: As of the reference period, ENJ was trading at approximately ¥0.3544 CNY with a market capitalization of approximately ¥670.61M. The 24-hour trading volume was ¥80.24M, with a 24-hour price movement of +2.49%.
Note: The available reference materials provide limited comparable data on TAO fundamentals, supply mechanisms, institutional adoption, and specific technological roadmaps for both assets. A comprehensive comparative analysis would require additional primary data sources on tokenomics, development timelines, and enterprise adoption metrics for both projects.
III. 2025–2030 Year Price Prediction: TAO vs ENJ
Short-term Prediction (2025)
- TAO: Conservative $218.61–$266.60 | Optimistic $381.24
- ENJ: Conservative $0.0244–$0.0281 | Optimistic $0.0326
Mid-term Prediction (2027–2028)
- TAO may enter growth consolidation phase, with projected price range of $209.33–$525.23
- ENJ may enter gradual appreciation phase, with projected price range of $0.0339–$0.0424
- Key drivers: Institutional capital inflow, ETF adoption, ecosystem development
Long-term Prediction (2029–2030)
- TAO: Base case scenario $337.09–$518.59 | Optimistic scenario $700.10–$633.72
- ENJ: Base case scenario $0.0217–$0.0403 | Optimistic scenario $0.0499–$0.0506
Disclaimer: This analysis is based on historical data models and predictive algorithms. Cryptocurrency markets are highly volatile and subject to regulatory, technological, and market sentiment changes. Price predictions do not constitute investment advice. Past performance does not guarantee future results. Investors should conduct independent research and assess their own risk tolerance before making investment decisions.
TAO:
| 年份 | 预测最高价 | 预测平均价格 | 预测最低价 | 涨跌幅 |
|---|---|---|---|---|
| 2025 | 381.238 | 266.6 | 218.612 | 0 |
| 2026 | 437.29065 | 323.919 | 168.43788 | 21 |
| 2027 | 525.2346585 | 380.604825 | 209.33265375 | 42 |
| 2028 | 584.2664668575 | 452.91974175 | 407.627767575 | 69 |
| 2029 | 700.1006908100625 | 518.59310430375 | 337.0855177974375 | 94 |
| 2030 | 633.7207734591825 | 609.34689755690625 | 365.60813853414375 | 128 |
ENJ:
| 年份 | 预测最高价 | 预测平均价格 | 预测最低价 | 涨跌幅 |
|---|---|---|---|---|
| 2025 | 0.032596 | 0.0281 | 0.024447 | 0 |
| 2026 | 0.0394524 | 0.030348 | 0.01911924 | 7 |
| 2027 | 0.041531238 | 0.0349002 | 0.033853194 | 23 |
| 2028 | 0.04241944809 | 0.038215719 | 0.03592277586 | 35 |
| 2029 | 0.0499938035958 | 0.040317583545 | 0.0217714951143 | 43 |
| 2030 | 0.050574376798848 | 0.0451556935704 | 0.027544973077944 | 60 |
Comparative Investment Analysis Report: Bittensor (TAO) vs Enjin Coin (ENJ)
IV. Investment Strategy Comparison: TAO vs ENJ
Long-Term vs Short-Term Investment Strategies
-
TAO: Suited for investors focused on emerging artificial intelligence infrastructure adoption and decentralized machine learning ecosystem development. The project's position as a #44-ranked asset with significant institutional interest supports long-term accumulation strategies during market downturns.
-
ENJ: Suited for investors seeking recovery plays within the gaming and NFT sectors, with expectations tied to gaming industry blockchain integration maturation. Short-term trading strategies may capitalize on sentiment-driven price movements within defined support and resistance levels.
Risk Management and Asset Allocation
-
Conservative Investor Profile: TAO 70% vs ENJ 30%
- TAO's superior market liquidity and trading volume provide better risk management through easier position management
- ENJ allocation limited to diversification purposes given reduced trading volume constraints
-
Aggressive Investor Profile: TAO 60% vs ENJ 40%
- Higher ENJ allocation targets potential recovery upside from current depressed valuation levels
- TAO maintains core portfolio position reflecting relative stability and liquidity advantages
-
Hedging Instruments: Stablecoin allocation (USDT/USDC) recommended at 20-30% portfolio weight given extreme fear market sentiment (Fear & Greed Index: 16). Cross-asset diversification into Bitcoin and Ethereum positions recommended for systematic risk mitigation.
V. Comparative Risk Analysis
Market Risk
-
TAO: Concentration risk from relatively smaller holder base (404,473 total holders) and recent entry into mainstream cryptocurrency awareness. Price volatility significant across all time horizons (1-year decline of 52.41%) reflecting sensitivity to market sentiment shifts and AI sector enthusiasm fluctuations.
-
ENJ: Severe long-term depreciation risk evidenced by 90.64% 1-year price decline and 99.4% decline from all-time high. Historical flash crash incidents involving price collapse to zero create elevated counterparty and exchange risk concerns. Substantially reduced trading volume ($99,092.48 24-hour volume) creates liquidity risk during rapid market movements.
Technology Risk
-
TAO: Substrate-based blockchain architecture dependency creates reliance on Polkadot ecosystem security standards. Decentralized machine learning network governance complexity introduces execution risk for protocol upgrades and parameter adjustments.
-
ENJ: Gaming ecosystem adoption dependency creates technology risk tied to blockchain integration success within gaming infrastructure. ERC-1155 standard implementation requires continuous compatibility maintenance with evolving Ethereum network specifications and gas optimization developments.
Regulatory Risk
-
TAO: Emerging regulatory frameworks for decentralized AI systems present uncertainty regarding data privacy, model validation, and computational resource governance. Regulatory clarity on AI-specific blockchain applications remains limited across major jurisdictions.
-
ENJ: Gaming-focused tokenomics subject to regulatory scrutiny regarding virtual goods representation and consumer protection frameworks. NFT-related regulatory developments, particularly in European and Asian markets, create compliance uncertainty. Historical flash crash incidents and market manipulation allegations introduce reputational and regulatory investigation risks.
VI. Conclusion: Which Is the Better Buy?
📌 Investment Value Summary:
TAO Advantages:
- Superior market capitalization ($5.6B vs $51M), providing institutional-grade liquidity and reduced counterparty risk
- Higher trading volume (32.8x greater than ENJ), facilitating efficient position entry and exit
- Top-tier #44 market ranking indicating greater market prominence and institutional adoption
- Lower circulation ratio (45.70% vs 191.27%), reflecting greater tokenomic scarcity relative to maximum supply
- Emerging AI infrastructure positioning aligned with current technological innovation focus
- Price retention relative to historical peak (66.5% decline) demonstrates comparative resilience versus ENJ
ENJ Advantages:
- Established 250,000 gaming community ecosystem with 18.7 million registered players providing real-world adoption metrics
- Longer operational history (founded 2009) creating infrastructure stability and community trust
- Greater exchange listing prevalence (42 exchanges), expanding accessibility across trading platforms
- Potential recovery upside from severely depressed valuation levels (currently 99.4% below all-time high)
- Direct revenue generation through virtual goods monetization (60 million monthly player visits)
✅ Investment Recommendations:
Novice Investors:
- Prioritize TAO allocation as primary position given superior liquidity, market stability, and transparent price discovery mechanisms
- Avoid significant ENJ allocation until trading volume and market stability indicators improve
- Maintain conservative leverage and deploy capital incrementally during established support level tests
- Recommended allocation: 80% TAO, 20% stablecoin reserves
Experienced Investors:
- TAO: Long-term accumulation strategy during market downturns, utilizing technical support levels around $218-$250 range for position averaging
- ENJ: Tactical trading positions targeting identified resistance levels with defined stop-loss parameters; consider as speculative recovery play with maximum position sizing of 5-10% portfolio weight
- Recommended allocation: 60% TAO, 20% ENJ (scaled positions), 20% stablecoin hedging
Institutional Investors:
- TAO: Primary allocation vehicle for cryptocurrency exposure to AI infrastructure sector, supported by institutional-grade liquidity and established market infrastructure
- ENJ: Evaluate through enterprise gaming partnership potential rather than token appreciation; monitor for gaming studio adoption milestones
- Risk management: Implement multi-leg hedging strategies utilizing derivatives markets; maintain 30-40% stablecoin allocation during elevated market volatility periods
⚠️ Risk Disclaimer: Cryptocurrency markets demonstrate extreme volatility and remain subject to rapid regulatory, technological, and sentiment-driven changes. The current market environment exhibits extreme fear conditions (Fear & Greed Index: 16), indicating heightened systematic risk across digital assets. Historical price predictions presented in this report represent algorithmic models and do not constitute investment advice. Past performance provides no guarantee of future results. Both TAO and ENJ have experienced significant depreciation from historical peaks. Investors must conduct independent research, assess individual risk tolerance, and consult qualified financial advisors before making investment decisions. Capital preservation should take priority over speculative returns during periods of elevated market uncertainty.
Report Date: December 16, 2025 None
FAQ: Bittensor (TAO) vs Enjin Coin (ENJ) Investment Comparison
I. Market Position and Liquidity
Q1: Why is TAO considered more liquid than ENJ despite both assets experiencing price declines?
A: TAO maintains substantially higher trading volume ($3,253,318.56 in 24-hour volume) compared to ENJ ($99,092.48), representing approximately 32.8 times greater liquidity. TAO's #44 market ranking with $5.6 billion market capitalization versus ENJ's #488 ranking with $51 million indicates significantly broader institutional adoption and market participation. This liquidity differential directly impacts trading execution efficiency, bid-ask spreads, and the feasibility of position entry and exit without substantial price slippage. ENJ's constrained trading activity creates practical challenges for investors seeking to adjust positions during market volatility periods.
Q2: What does the circulation ratio discrepancy between TAO (45.70%) and ENJ (191.27%) indicate about tokenomic structures?
A: TAO's lower circulation ratio of 45.70% indicates that approximately 55% of maximum supply remains unlocked, creating potential supply expansion as token vesting schedules complete. Conversely, ENJ's circulation ratio exceeding 100% at 191.27% suggests circulating supply exceeds the stated total supply, indicating complex tokenomic structures possibly involving wrapped tokens, derivative instruments, or prior supply restructuring events. TAO's lower circulation ratio generally implies greater scarcity relative to maximum supply, potentially supporting longer-term price appreciation scenarios as unlock schedules near completion and market demand stabilizes.
II. Price Performance and Risk Assessment
Q3: Why has ENJ experienced a 90.64% one-year decline compared to TAO's 52.41% decline?
A: ENJ's more severe depreciation reflects multiple compounding factors including reduced gaming sector blockchain adoption rates, historical flash crash incidents creating regulatory concerns, lower institutional capital inflow, and depressed market sentiment toward NFT and gaming tokens. TAO's relative resilience reflects emerging institutional recognition of decentralized machine learning infrastructure potential and capital reallocation from underperforming gaming tokens toward AI-focused blockchain projects. Additionally, TAO's recent market entry (2023-2024) captured cryptocurrency sector capital flows toward artificial intelligence applications, while ENJ's 2021 all-time high established elevated valuation expectations that proved unsustainable through subsequent market cycles.
Q4: What current market conditions warrant caution for both TAO and ENJ investors?
A: The Crypto Fear & Greed Index currently stands at 16, indicating "Extreme Fear" market sentiment as of December 15, 2025. Both assets demonstrate negative price momentum across all timeframes (1-hour, 24-hour, 7-day, and 30-day periods), suggesting broad-based bearish pressure. ENJ's historical involvement in exchange flash crashes where prices collapsed to zero creates heightened counterparty and platform risk concerns. TAO's recent 66.5% decline from April 2024 peak indicates potential continuation of correction dynamics. Both assets represent elevated-risk positions during periods of extreme market fear, necessitating defensive portfolio positioning and increased stablecoin allocation (20-30% of portfolio weight recommended).
III. Technology and Ecosystem Fundamentals
Q5: How do TAO's decentralized machine learning network capabilities differentiate from ENJ's gaming infrastructure focus?
A: TAO operates as a Substrate-based blockchain enabling collaborative training and deployment of machine learning models, with token utility derived from rewarding network participants for computational contributions and model validation. The ecosystem directly addresses artificial intelligence infrastructure demands within decentralized networks. Conversely, ENJ provides foundational infrastructure for gaming community management encompassing 250,000 active gaming communities with 18.7 million registered players, generating revenue through virtual goods monetization. TAO targets enterprise and research institution adoption for AI model development, while ENJ targets gaming studios and content creators for in-game NFT functionality. This fundamental difference creates distinct risk profiles: TAO depends on AI infrastructure adoption scaling, while ENJ depends on gaming industry blockchain integration maturation.
Q6: What technological risks should investors consider regarding ENJ's ERC-1155 standard implementation?
A: ENJ's reliance on Ethereum's ERC-1155 standard for non-fungible token creation creates dependency risks regarding Ethereum network evolution, gas optimization developments, and competing NFT standards. ERC-1155 standard implementation requires continuous maintenance compatibility with emerging Ethereum specifications such as Dencun upgrade changes and future scaling solutions. Competing standards including ERC-721 and proprietary gaming-chain solutions (such as Immutable's Layer 2 solution addressing zero gas costs for NFT minting) create technological commoditization risks. ENJ's value proposition faces erosion if alternative platforms address identical gaming use cases more efficiently. Additionally, Ethereum network congestion during market volatility periods historically increases transaction costs, potentially reducing competitive attractiveness of ENJ-based virtual goods solutions compared to gaming-specific blockchain platforms.
IV. Investment Suitability and Strategic Deployment
Q7: Which asset alignment matches different investor risk profiles - conservative, moderate, or aggressive?
A: Conservative Investors should prioritize TAO (70% allocation) supplemented with stablecoin reserves (30%), avoiding meaningful ENJ exposure given liquidity constraints and 90.64% one-year depreciation. Moderate Investors may employ 60% TAO allocation with 20% ENJ representing tactical recovery positioning and 20% stablecoin hedging during extreme fear market conditions. Aggressive Investors may increase ENJ tactical trading positions to 40% with corresponding TAO reduction to 60%, actively trading ENJ around identified technical support and resistance levels while maintaining TAO as core systematic exposure to AI infrastructure. All investor profiles should implement disciplined stop-loss mechanisms at 15-20% below entry prices given demonstrated price volatility across assets and current extreme fear market sentiment.
Q8: What 2025-2030 price prediction models suggest regarding relative return potential?
A: TAO price predictions indicate conservative 2025 range of $218.61-$266.60 with optimistic scenario reaching $381.24, implying 42.96% upside to mid-point projections. Extended projection through 2030 suggests base case range of $337.09-$518.59 with optimistic scenario reaching $700.10, indicating significant long-term appreciation potential if AI infrastructure adoption accelerates. ENJ price predictions model more modest trajectory with 2025 conservative range of $0.0244-$0.0281 and optimistic scenario at $0.0326, implying limited near-term upside but 60% cumulative appreciation potential through 2030 under base case scenarios. However, these algorithmic projections represent historical pattern extrapolations and cannot predict regulatory changes, technological disruptions, or macroeconomic shifts that fundamentally alter cryptocurrency market dynamics. Price predictions do not constitute investment advice; investors should prioritize capital preservation during elevated market uncertainty periods.
Report Date: December 16, 2025
Disclaimer: This analysis is based on historical market data and predictive algorithms. Cryptocurrency markets remain highly volatile and subject to rapid regulatory, technological, and sentiment-driven changes. Price predictions and investment recommendations do not constitute financial advice. Past performance does not guarantee future results. Investors must conduct independent research and assess individual risk tolerance before making investment decisions.
Share
Content
Introduction: TAO vs ENJ Investment Comparison
I. Historical Price Comparison and Current Market Status
II. Market Capitalization and Valuation Analysis
III. Price Performance and Market Volatility
IV. Project Overview and Ecosystem Context
V. Ecosystem Participants and Holder Distribution
VI. Network Architecture and Technical Foundation
VII. Community Engagement and Information Resources
VIII. Key Observations and Market Context
II. Core Factors Influencing Investment Value of TAO vs ENJ
III. 2025–2030 Year Price Prediction: TAO vs ENJ
IV. Investment Strategy Comparison: TAO vs ENJ
V. Comparative Risk Analysis
VI. Conclusion: Which Is the Better Buy?
I. Market Position and Liquidity
II. Price Performance and Risk Assessment
III. Technology and Ecosystem Fundamentals
IV. Investment Suitability and Strategic Deployment
How to Buy Cryptocurrency


Trending Cryptocurrencies


XZXX: A Comprehensive Guide to the BRC-20 Meme Token in 2025

Bitcoin Fear and Greed Index: Market Sentiment Analysis for 2025

Top Crypto ETFs to Watch in 2025: Navigating the Digital Asset Boom

5 ways to get Bitcoin for free in 2025: Newbie Guide
Bitcoin Market Cap in 2025: Analysis and Trends for Investors

2025 Bitcoin Price Prediction: Trump's Tariffs' Impact on BTC

Gate Pay Crypto Payment Solution: A Guide to Secure Global Payments and Web3 Integration
What Is Gate Pay? A Complete Guide to the Crypto Payment Tool

How to Stake ETH? A Complete Guide to ETH Staking in 2026

How to Mine ETH? A New Guide to ETH Mining in 2026

Is Raydium (RAY) a good investment?: A Comprehensive Analysis of the DEX Protocol's Potential Returns and Risk Factors