Futures
Access hundreds of perpetual contracts
TradFi
Gold
One platform for global traditional assets
Options
Hot
Trade European-style vanilla options
Unified Account
Maximize your capital efficiency
Demo Trading
Introduction to Futures Trading
Learn the basics of futures trading
Futures Events
Join events to earn rewards
Demo Trading
Use virtual funds to practice risk-free trading
Launch
CandyDrop
Collect candies to earn airdrops
Launchpool
Quick staking, earn potential new tokens
HODLer Airdrop
Hold GT and get massive airdrops for free
Pre-IPOs
Unlock full access to global stock IPOs
Alpha Points
Trade on-chain assets and earn airdrops
Futures Points
Earn futures points and claim airdrop rewards
Is BTC's strong rebound a false breakout? Hidden dangers above 77,800, the ultimate battle between bulls and bears has already begun!
Current Price: 77815.12
From the dip near 74400 to around 78000 today, BTC’s recent move is very typical—rapid sell-off + a strong retracement. Many people will instinctively think the market has turned bullish again, but the real key is: is this a reversal, or a bull trap?
Break down the structure directly.
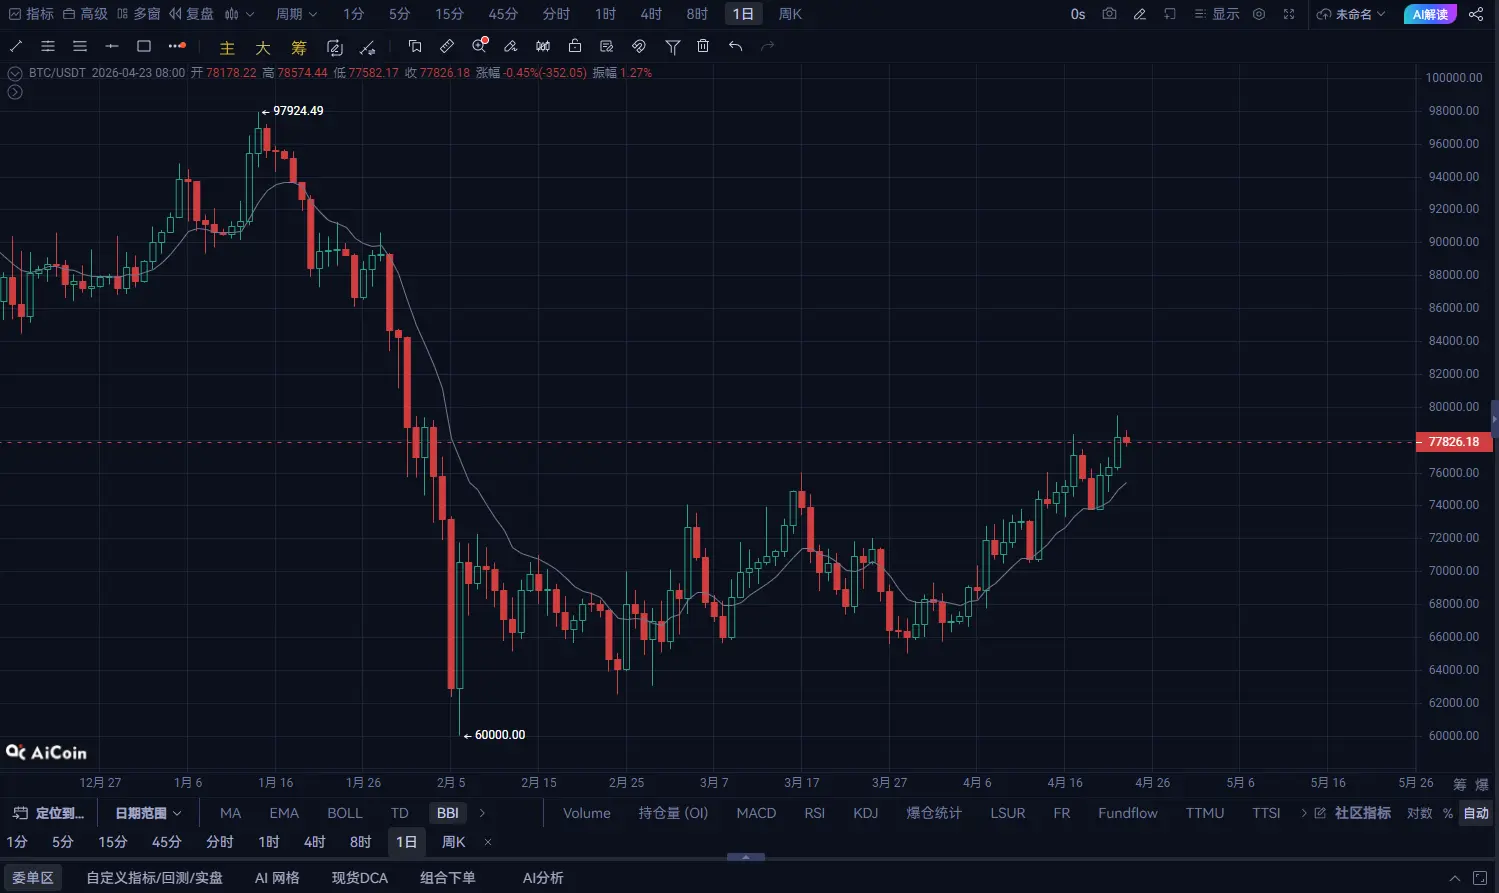
The signals shown on the daily chart are “repairs,” not “confirmed trend strengthening”:
Clear lower wicks → strong buying/support underneath
Reclaim the previous consolidation range (above 75000)
Although MACD has started to turn, it has not fully formed a second wave of increased volume
RSI has returned above 60, but it has not entered the strong zone
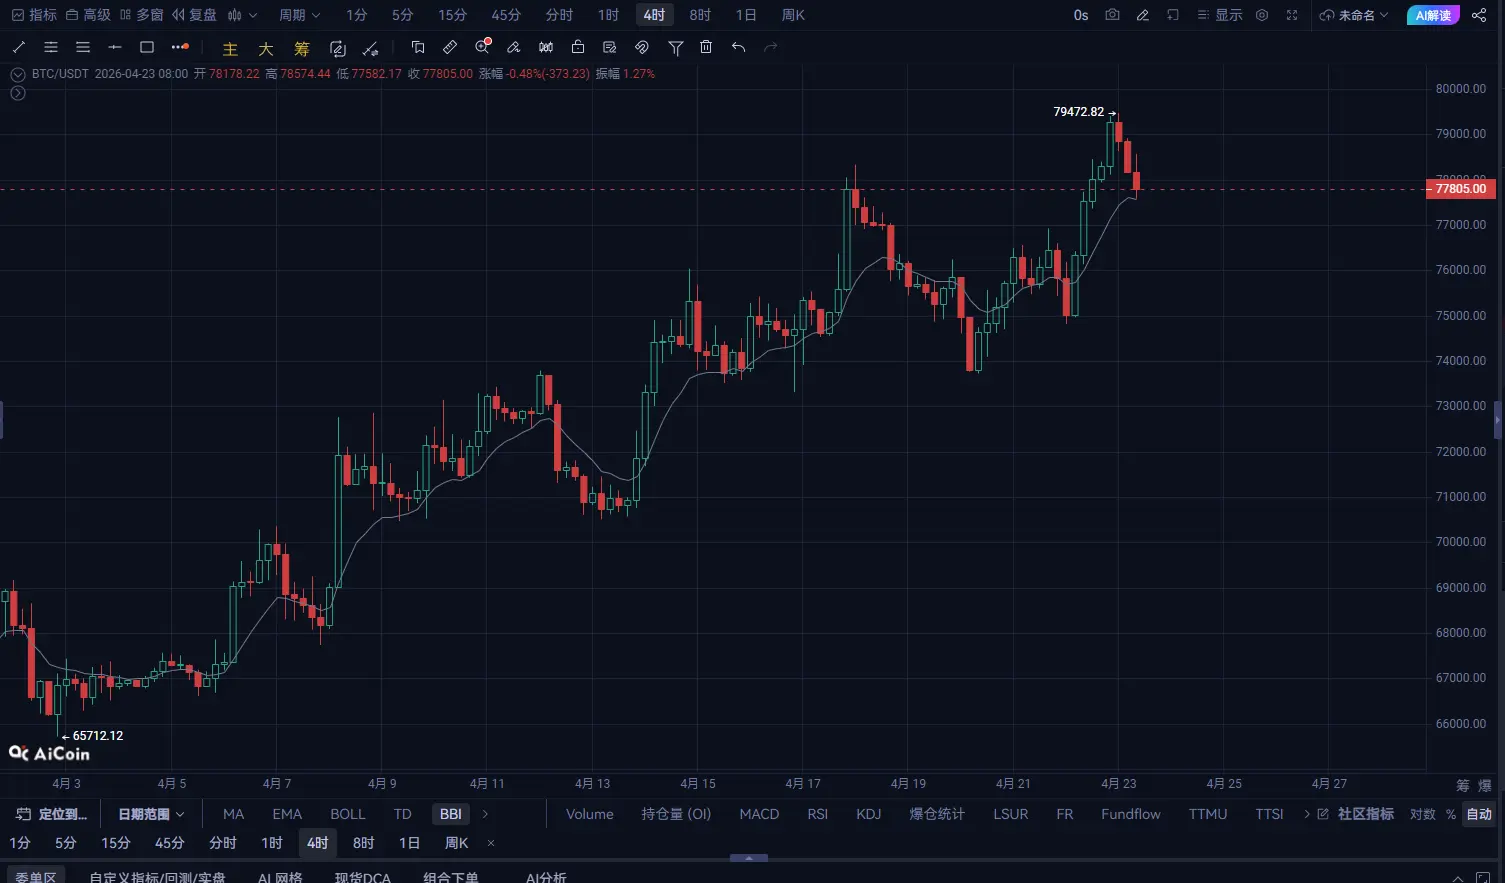
The 4-hour chart is currently the most critical cycle:
A rapid rise from the bottom forms a V-shaped reversal
Consecutive bullish candles push forward, and momentum release is obvious
But price is already nearing the dense pressure area from the prior highs (78000–80000)
Technical indicators:
MACD shows a strong bullish golden cross with volume expanding
The Bollinger Bands open upward, and the price is running along the upper band
After a surge in trading volume, it begins to stabilize
The issue is:
Upward momentum is strong, but it has already reached the “area that should be realized”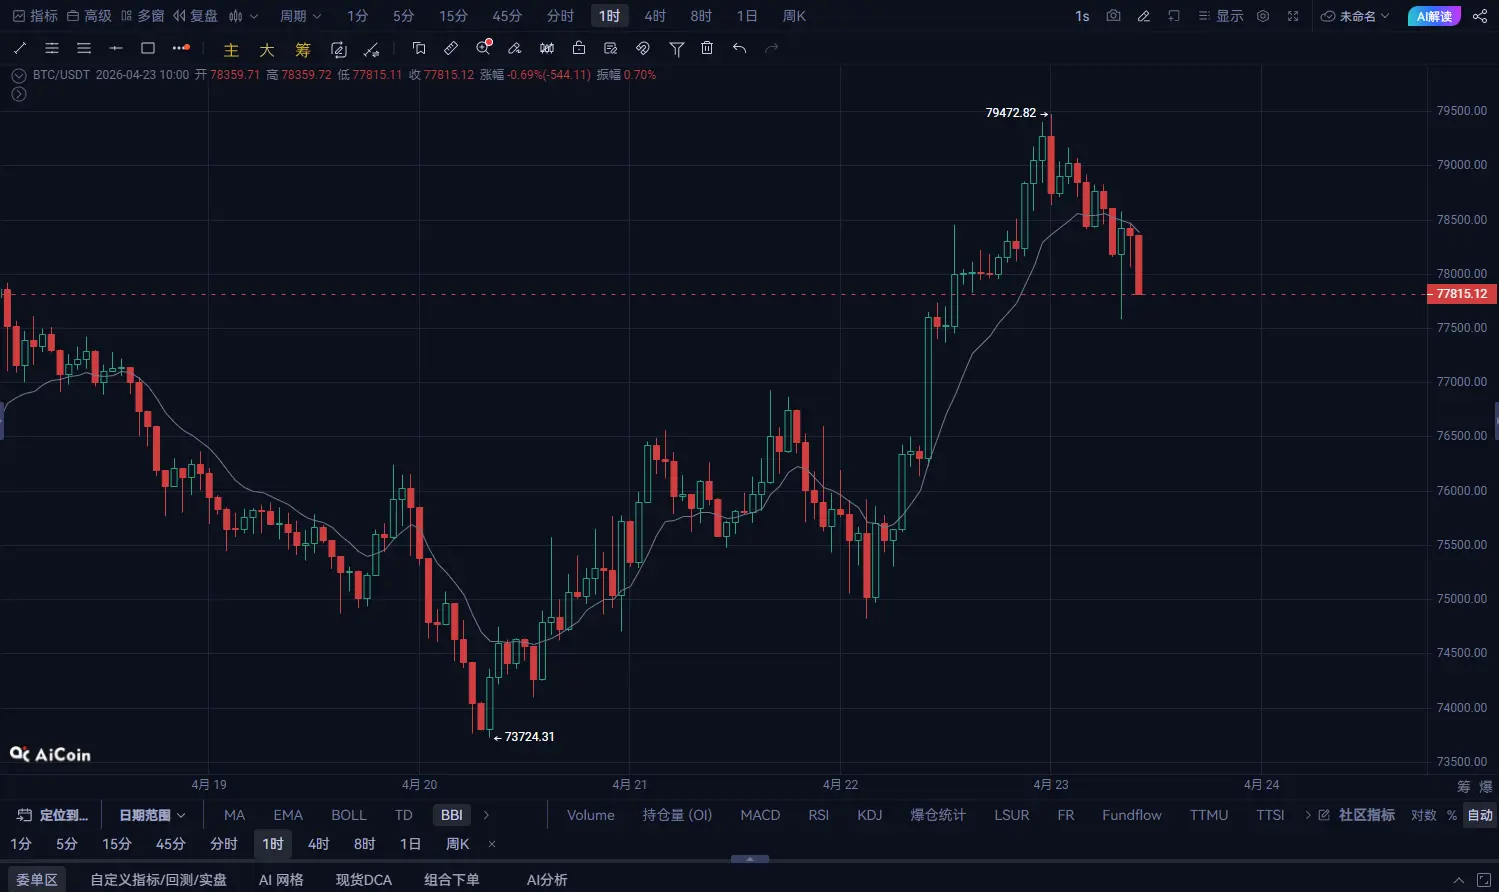
In the short cycle, “overheating signals” have already appeared:
After a continuous rally, it starts to move sideways
K-line body size shrinks → momentum weakens
MACD at high levels shows signs of flattening, with hints of a bearish divergence at the top
Structure shows:
Rally → consolidation/sideways → possible pullback
BTC’s core situation right now:
Daily chart: in repair phase
4-hour chart: a strong rebound to the resistance level
1-hour chart: short-term overheating
This indicates:
The market has finished the “emotional repair phase,” and is entering the “true vs. false breakout validation stage”
【BTC Today Short Strategy】
Entry position: 77815
First take-profit: 77025
Second take-profit: 76184
Stop-loss position: 78984