Futures
Access hundreds of perpetual contracts
TradFi
Gold
One platform for global traditional assets
Options
Hot
Trade European-style vanilla options
Unified Account
Maximize your capital efficiency
Demo Trading
Introduction to Futures Trading
Learn the basics of futures trading
Futures Events
Join events to earn rewards
Demo Trading
Use virtual funds to practice risk-free trading
Launch
CandyDrop
Collect candies to earn airdrops
Launchpool
Quick staking, earn potential new tokens
HODLer Airdrop
Hold GT and get massive airdrops for free
Pre-IPOs
Unlock full access to global stock IPOs
Alpha Points
Trade on-chain assets and earn airdrops
Futures Points
Earn futures points and claim airdrop rewards
RAVE experiences a violent surge followed by the ultimate test! Above 0.91 is it the main upward wave, or the starting point of a high-level harvest?
Current Price: 0.91811
The current trend of RAVE is no longer a “normal rise,” but a typical emotion-driven acceleration pattern. The characteristic of this structure is simple: the faster the rise, the more intense the divergence. The current position is no longer a low-level opportunity but the core battlefield in the high-level game.
Directly analyze the multi-cycle structure.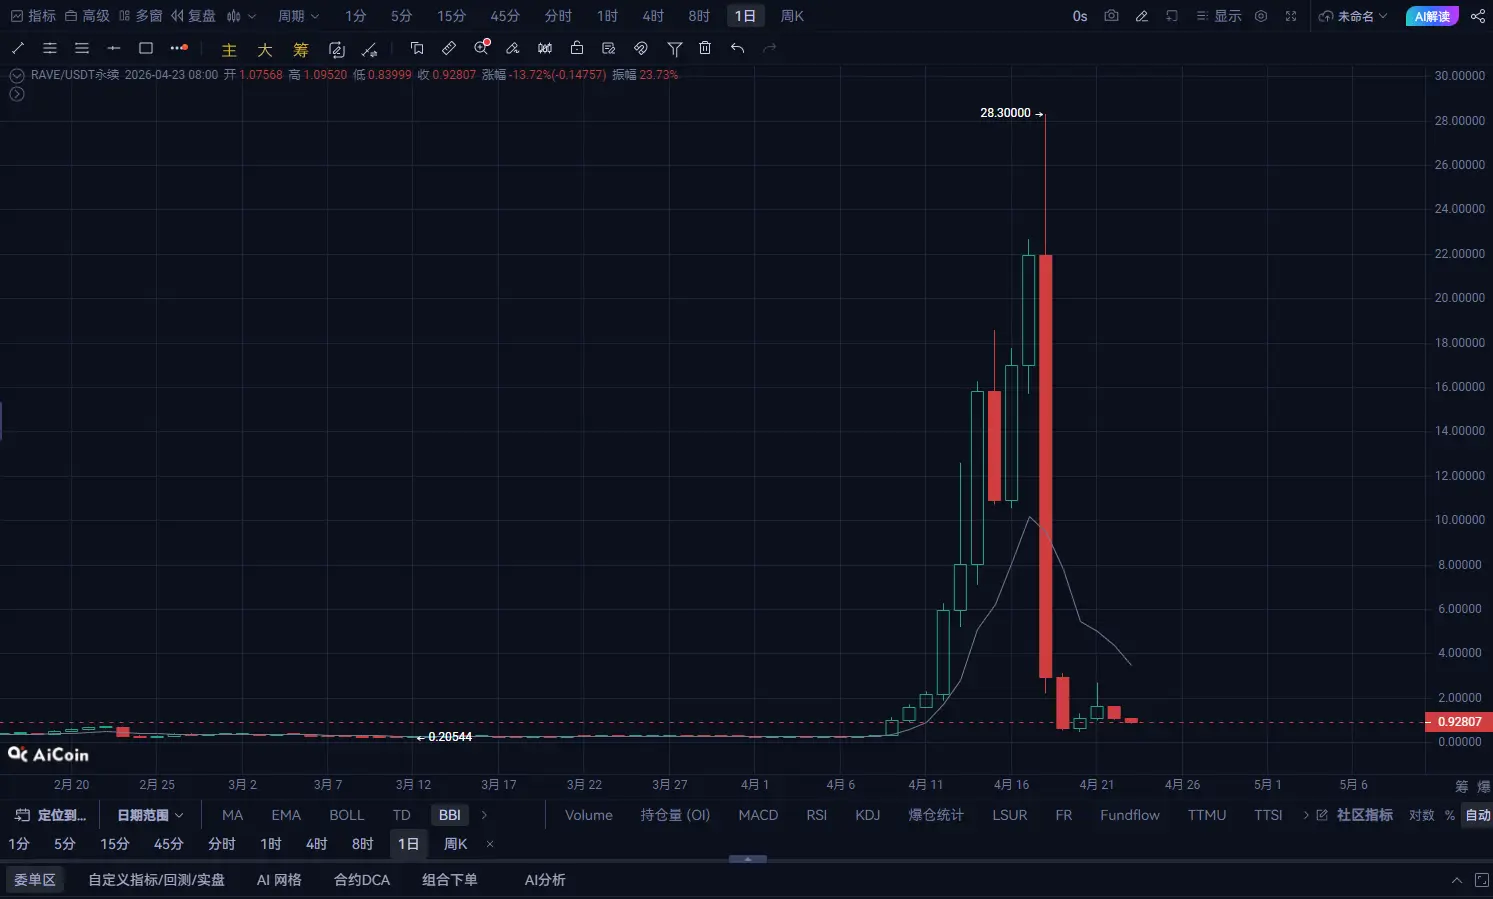
The daily chart currently shows typical strong upward momentum:
Continuous large bullish candles driving up, trend extremely steep
Almost no effective pullbacks → Bullish sentiment erupts
MACD continues to expand, bullish momentum very strong
RSI enters overbought zone (high-level fatigue)
But note:
Acceleration often indicates approaching the top
Upper shadow begins to appear → Initial selling pressure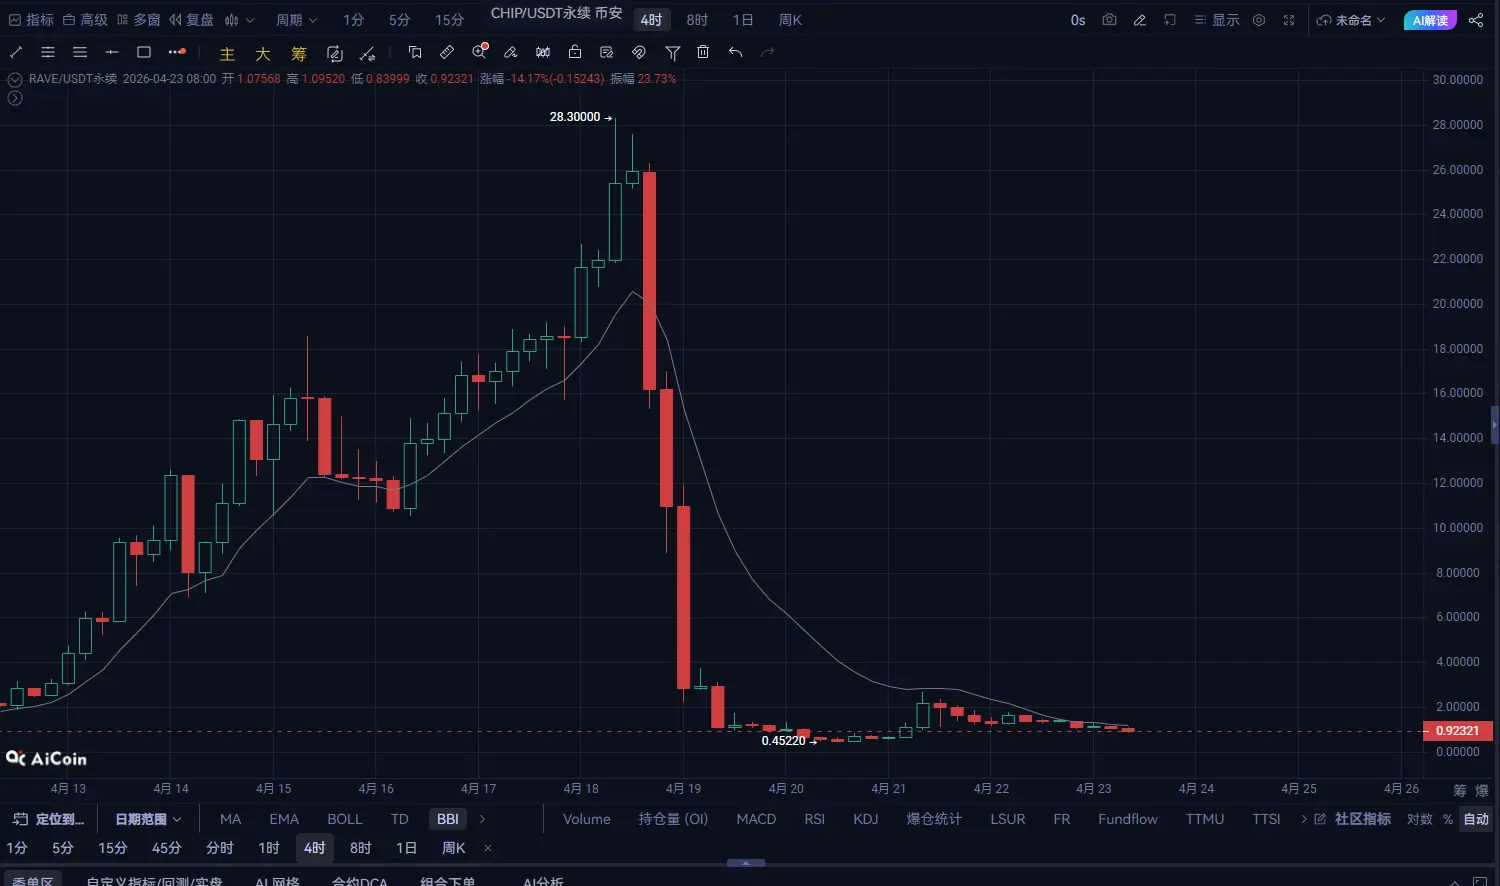
The 4-hour structure is very critical:
Rapid rise followed by consolidation
High-level candlestick bodies shrink → Increasing bullish-bearish divergence
Local upper shadows appear → Funds are taking profits
Technical aspects:
MACD remains high but momentum begins to weaken
Bollinger Bands are widely open → Volatility has been released
Volume spikes but does not continue to expand
This means:
Main force transitions from “rising phase” to “divergence battle phase”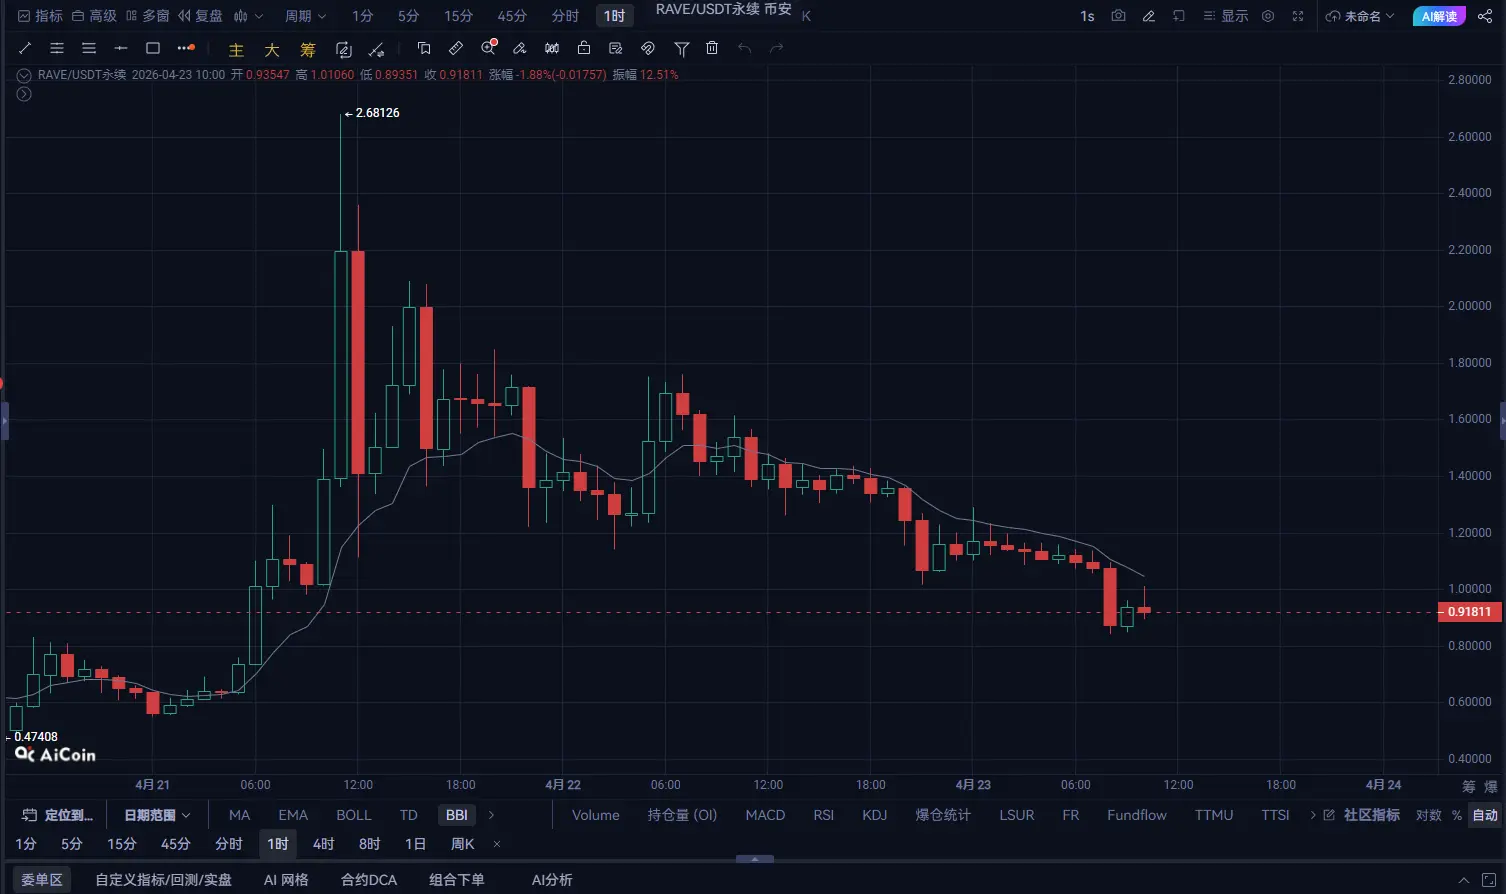
Short-term cycle shows obvious changes:
No longer continuously hitting new highs
Forming sideways or slight pullback structure
MACD shows signs of a death cross at high levels
Structural features:
Rise → Sideways → Waiting for direction choice
Current three-cycle resonance state:
Daily: Strong trend (but overheated)
4-hour: Divergence after acceleration
1-hour: High-level consolidation
This indicates a core issue:
The rally is not over, but the phase most prone to losses has already begun
【RAVE Today’s Trading Strategy】
Entry position: 0.91811
First target: 0.93728
Second target: 0.96407
Stop-loss position: 0.88657