Date: Wed, Dec 31, 2025 | 03:40 PM GMT
As the final hours of 2025 approach, the broader cryptocurrency market is showing modest strength. Both Bitcoin (BTC) and Ethereum (ETH) are trading slightly in the green, helping ease recent volatility and stabilize overall market sentiment. This calmer environment has allowed select altcoins — including Plasma (XPL) — to begin forming constructive technical setups after extended periods of downside pressure.
XPL is starting to attract attention with an impressive 11% daily jump, trimming its 60-day decline to roughly 43%. While the broader trend still reflects recovery mode, the more important signal is emerging on the daily chart, where price action is beginning to suggest a meaningful structural shift. If confirmed, this setup could mark the early stages of a bullish continuation heading into the new year.
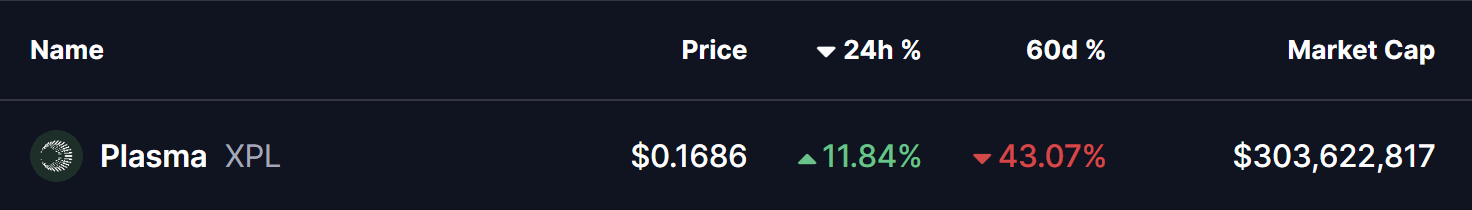
Source: Coinmarketcap
Rounding Bottom in Play
On the daily timeframe, XPL appears to be forming a textbook rounding bottom pattern — a classic bullish reversal structure that typically develops after a prolonged downtrend. This pattern reflects a slow but steady transition from selling dominance to accumulation, as bearish momentum fades and buyers gradually regain control.
Earlier in the trend, XPL faced strong rejection near the $0.3321 neckline zone, triggering a sharp decline that extended through November and December. That sell-off ultimately found a floor near the $0.1152 level, which has since proven to be a critical demand zone. Repeated defenses of this area prevented further downside and laid the foundation for a potential trend reversal.
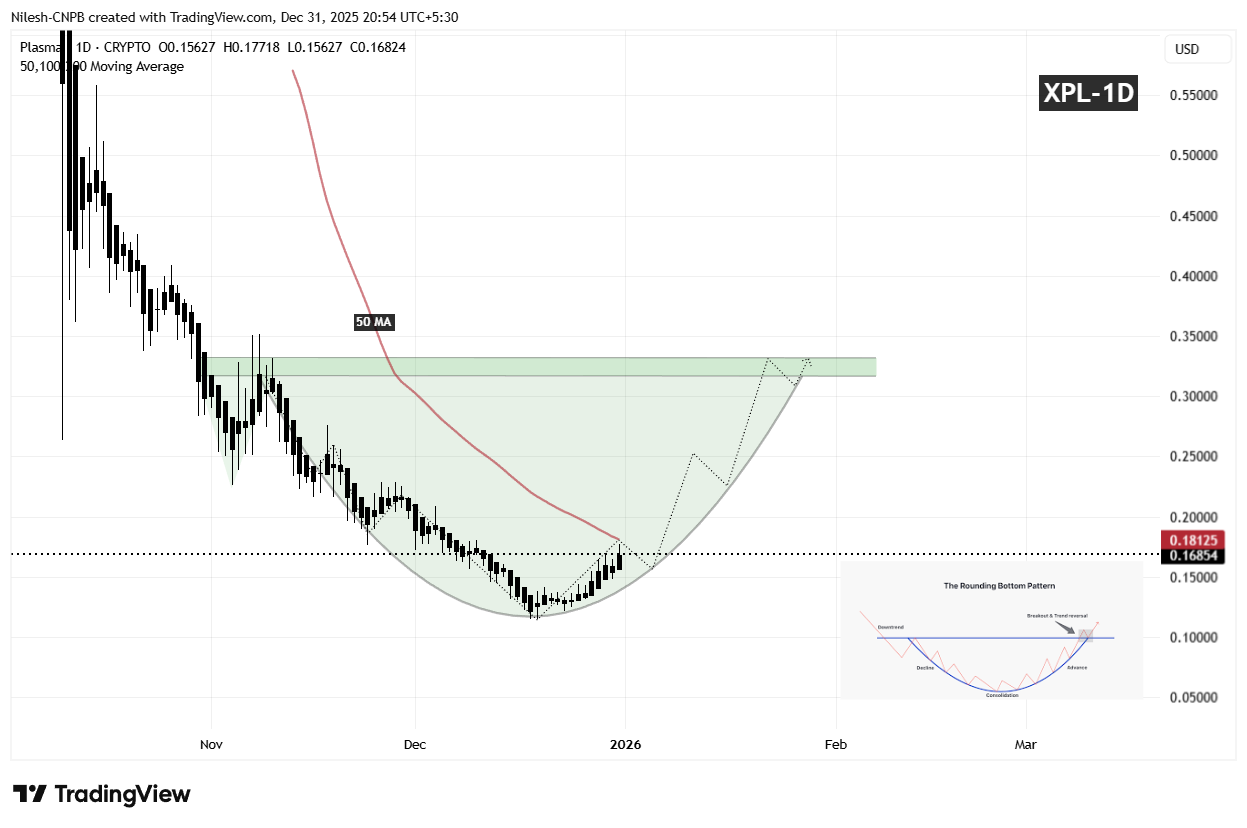
XPL Daily Chart/Coinsprobe (Source: Tradingview)
Since establishing that base, XPL has begun to curve higher in a rounded fashion, mirroring the classic structure of a developing bottom. This gradual recovery suggests that selling pressure is no longer aggressive, and that accumulation is taking place beneath the surface. The recent push back above the $0.16 region further reinforces the idea that buyers are positioning ahead of a larger directional move.
What’s Next for XPL?
For the rounding bottom pattern to gain confirmation, XPL needs to reclaim the 50-day moving average, currently positioned near the $0.1812 level. A sustained move above this area would signal a clear momentum shift and indicate that bulls are regaining control after months of corrective price action.
Looking higher, the most significant technical barrier remains the neckline resistance around $0.3321, highlighted by the prior distribution zone on the chart. A clean breakout above this region would validate the entire reversal structure and could open the door for a broader bullish expansion phase, with momentum traders and sidelined participants likely re-entering the market.
Until those levels are reclaimed, the pattern remains in its development phase. Short-term consolidation or minor pullbacks remain possible if price struggles near the 50-day moving average. However, as long as XPL continues to hold higher lows above the $0.1152 base, the broader bottoming structure remains intact.
Overall, XPL is approaching a technically important inflection point. The emerging rounding bottom formation, improving price structure, and proximity to key resistance levels suggest the coming sessions could prove decisive for Plasma’s next major directional move as the market transitions into 2026.
Disclaimer: The views and analysis presented in this article are for informational purposes only and reflect the author’s perspective, not financial advice. Technical patterns and indicators discussed are subject to market volatility and may or may not yield the anticipated results. Investors are advised to exercise caution, conduct independent research, and make decisions aligned with their individual risk tolerance.
About Author: Nilesh Hembade is the Founder and Lead Author of Coinsprobe, with over 5 years of experience in the cryptocurrency and blockchain industry. Since launching Coinsprobe in 2023, he has been providing daily, research-driven insights through in-depth market analysis, on-chain data, and technical research.
Disclaimer: The information on this page may come from third parties and does not represent the views or opinions of Gate. The content displayed on this page is for reference only and does not constitute any financial, investment, or legal advice. Gate does not guarantee the accuracy or completeness of the information and shall not be liable for any losses arising from the use of this information. Virtual asset investments carry high risks and are subject to significant price volatility. You may lose all of your invested principal. Please fully understand the relevant risks and make prudent decisions based on your own financial situation and risk tolerance. For details, please refer to
Disclaimer.
Related Articles
Stablecoins aren’t just for cross-border payments—they’re for going local too! a16z’s latest report: Asia supports two-thirds of transaction volume
Crypto VC giant a16z’s latest report, “9 charts on what stablecoins are becoming,” uses nine key charts to depict the structural changes underway in stablecoins. The report’s central takeaway is not new tokens or new narratives, but stablecoins’ role shifting from “trading tools” and “savings vehicles” to “core financial infrastructure,” along with an increasingly strong degree of localization—creating a clear gap between what the market originally expected and the reality of cross-border payments.
**GENIUS Act in the U.S. boosts stablecoin trading volume to $4.5 trillion in Q4**
For years, regulatory uncertainty has been the ceiling for institutional participation in stablecoins. The turning point came from the U.S. GENIUS Act establishing the first federal-level stablecoin issuance framework. a16z data shows that, prior to the bill’s passage, the adjusted stablecoin trading volume had already been rising for several consecutive quarters.
ChainNewsAbmedia33m ago
Humanity Protocol Rallies 80% From April Lows, But Is the Momentum Fading?
Humanity Protocol surged 80% from April lows, breaking into top 100 crypto assets.
Whale activity and network growth rose, but trading volume dropped sharply by 46%.
Bullish structure remains intact, with key resistance and support levels defining the next move.
Humanity Protocol — H, ha
CryptoNewsLand1h ago
PENGU Eyes 30% Rally as Analyst Flags Crucial Breakout Level
PENGU consolidates near $0.009 resistance after a long 90% decline from highs.
Analysts expect a 30% rally if breakout above key resistance level confirms strength.
ETF speculation and ecosystem growth could fuel volatility and upside momentum.
Pudgy Penguins — PENGU, is sitting at a
CryptoNewsLand4h ago
Analyst: $80K Emerges as Bitcoin's Key Resistance Level, Breakout Could Trigger Increased Volatility
Gate News message, April 26 — On-chain analyst Murphy identified $80,000 as Bitcoin's primary resistance level above the current price, citing a combination of options Gamma exposure, open interest (OI), and implied volatility (IV) data. The level represents a critical checkpoint for May's price
GateNews4h ago
Crypto Fear and Greed Index Falls to 32, Indicating Panic State
Gate News message, April 26 — The Crypto Fear and Greed Index currently stands at 32, up 2 points from the previous day, according to Coinglass data. The index is in a panic state.
The seven-day average is 34, while the 30-day average is 19, indicating elevated market anxiety over the past
GateNews5h ago
PLA Plummets 47.8% in 30 Minutes, Dropping Below $0.12
Gate News message, April 26 — PLA (PlayDapp) price crashed 47.8% in just 30 minutes today, falling to $0.1225. The token, which hit a day high of $0.2347, now trades at $0.122512 with a market cap of approximately $305 million. Trading volume remains notably low, reflecting reduced investor
GateNews5h ago