


#BTC
## BTC Current Status
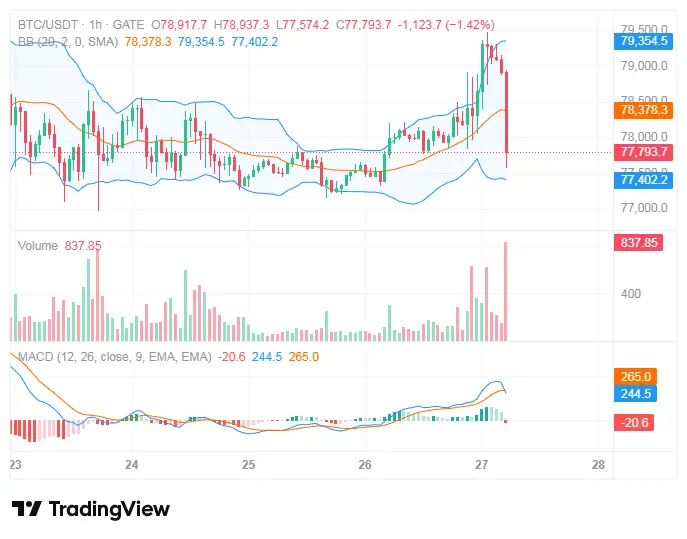
Bitcoin is trading at $78,054.40 with a 24-hour gain of 0.45%. Over the past week, it has risen 2.92%, and the monthly performance shows an impressive 17.59% increase. The price has broken above $78K and is consolidating near four-week highs. The market structure presents mixed signals: short-term momentum appears bullish with a double bottom formation visible on the charts, but daily indicators including CCI, Williams %R, and MACD suggest overbought conditions that could trigger a pullback.
US. IRAN Situation: Latest Updates
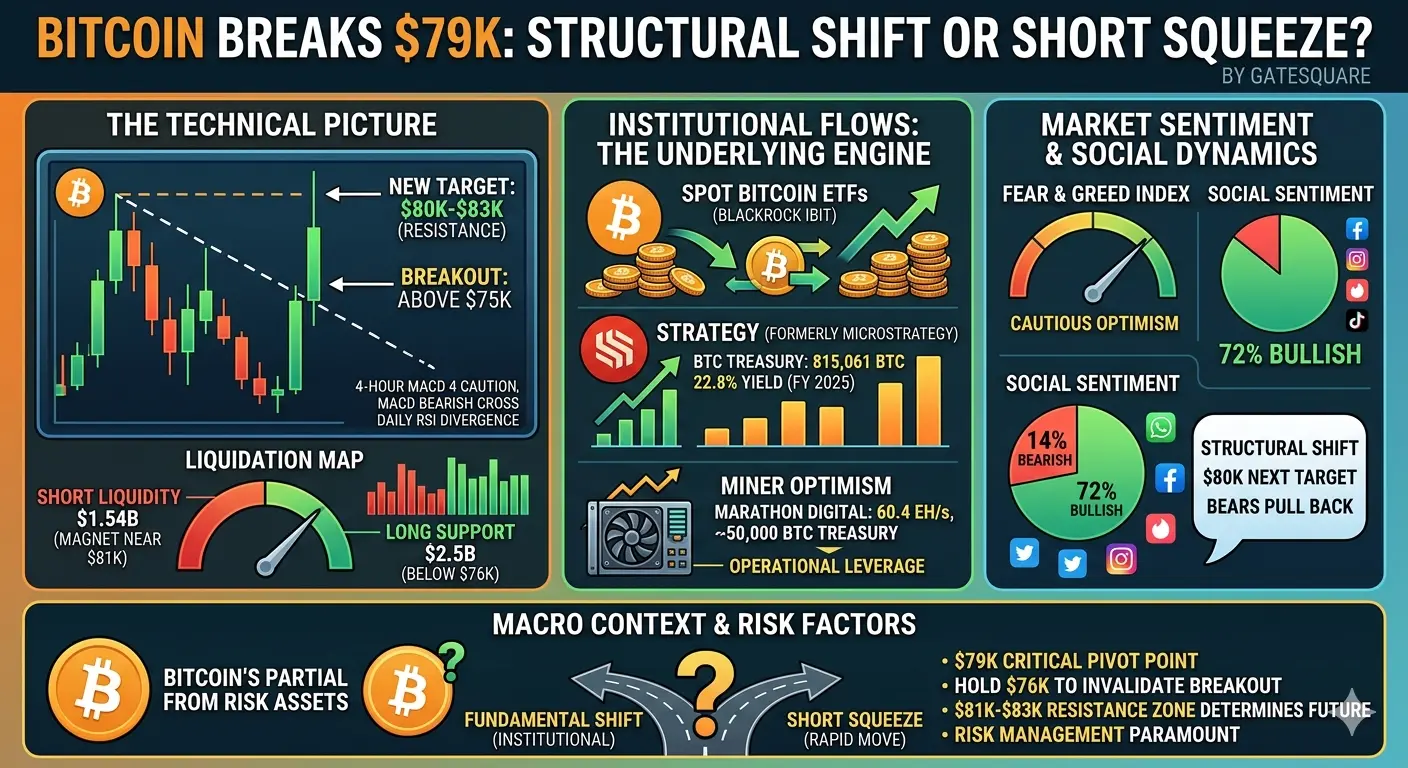
Tensions between the US and Iran remain elevated, though ceasefire talks are ongoing. Recent reports indicate that extended US-Iran ceasefire talks have lifted overall market risk appetite, pushing Bitcoin to monthly highs near $78,922. Iran reimposed controls over the Strait of Hormuz during the weekend, causing Brent crude oil to jump 5.7% while Bitcoin only experienced a modest 1.6% pullback, demonstrating crypto's relative resilience compared to traditional markets. BlackRock and Strategy (formerly MicroStrategy) appear to be in an arms race for Bitcoin supply accumulation. BlackRock's IBIT ETF recorded $612 million in inflows last week, while Strategy now holds 815,061 BTC, surpassing BlackRock's 802,823 BTC holdings. Each Iran-related shock is producing smaller Bitcoin sell-offs than the previous one, suggesting that geopolitical risk is largely priced into the market. Crypto is increasingly acting as a geopolitical shock absorber.
BULLISH Scenario (Probability: 55-60%)
The bullish case rests on several catalysts. Institutional accumulation continues with ETF inflows averaging $1.9 billion weekly. The $80,000 level represents key resistance, and breaking above it would trigger approximately $619 million in short liquidations. The Coinbase premium index has remained positive for 18 consecutive days, indicating strong US buying pressure. Additionally, the SEC under Chairman Paul Atkins is taking a noticeably friendlier stance toward crypto regulation compared to the previous administration. Near-term price targets include $80,000 to $82,000, which forms a significant resistance cluster. If $82,000 breaks with strong volume, mid-term targets of $85,000 to $88,000 become achievable. Technical confirmation would come from a daily close above $79,000 with the lagging span clearing the Kumo cloud on the Ichimoku indicator.
BEARISH Scenario (Probability: 40-45%)
The bearish case presents several risks worth monitoring. Daily MACD is showing bearish divergence, with price making higher highs while momentum indicators decline. Overbought conditions on both CCI and Williams %R suggest potential exhaustion. If US-Iran talks collapse unexpectedly, risk-off sentiment could trigger a cascade of selling. A breakdown below $76,000 support would trigger approximately $645 million in long liquidations, potentially accelerating the decline. Support levels to watch include $76,000 as critical support, followed by $73,000 to $74,000 in the previous accumulation zone, and $71,000 as a major structural level.
Trading Strategy Recommendations
For short-term traders focusing on the 1-7 day timeframe, there are two primary scenarios to consider. In the breakout play scenario, enter long positions above $79,500 with confirmation, targeting $81,500 to $82,000, with a stop loss placed at $78,200 below recent support, offering a risk-to-reward ratio of approximately 1 to 2.5. Alternatively, for range-bound conditions, the current trading range sits between $77,000 and $78,200, where traders can buy dips toward $77,500 and sell rallies toward $78,000 and above, maintaining tight stops on both sides.
For swing traders with a 1-4 week horizon, a conservative approach would involve waiting for a daily close above $80,000 before adding to long positions, scaling in with 25% position sizes on confirmed breaks, while keeping 50% of capital available for dip-buying opportunities below $76,000. More aggressive traders might consider holding current longs with a trailing stop at $77,000, adding to positions on any dips into the $76,000 to $77,000 zone, with a target of $85,000 or higher over the next two to four weeks.
Risk management remains paramount in the current environment. Given the 17.5% run over the past 30 days, consider reducing position sizes by 20-30% from normal levels. For futures trading, use maximum leverage of 3-5x as volatility is likely to expand near the $80,000 level. Monitor correlations with oil prices and the US Dollar Index, as simultaneous spikes in both could cause crypto to lag traditional markets. Be aware that $80,000 represents a magnet for short liquidations while $76,000 serves the same function for long liquidations.
Key levels to watch include $82,000 as major resistance in the negative gamma zone, $80,000 as key resistance with high call open interest, $78,000 as current psychological support, $76,000 as critical support and a long liquidation trigger, and $74,000 as a strong demand zone where buyers have historically stepped in.
Bottom Line: The path of least resistance remains upward while institutional flows continue, but exercise caution near $80K resistance. The US-Iran situation is a known risk that markets have largely adapted to. Your edge lies in waiting for clean breaks rather than anticipating them.
## BTC Current Status
Bitcoin is trading at $78,054.40 with a 24-hour gain of 0.45%. Over the past week, it has risen 2.92%, and the monthly performance shows an impressive 17.59% increase. The price has broken above $78K and is consolidating near four-week highs. The market structure presents mixed signals: short-term momentum appears bullish with a double bottom formation visible on the charts, but daily indicators including CCI, Williams %R, and MACD suggest overbought conditions that could trigger a pullback.
US. IRAN Situation: Latest Updates
Tensions between the US and Iran remain elevated, though ceasefire talks are ongoing. Recent reports indicate that extended US-Iran ceasefire talks have lifted overall market risk appetite, pushing Bitcoin to monthly highs near $78,922. Iran reimposed controls over the Strait of Hormuz during the weekend, causing Brent crude oil to jump 5.7% while Bitcoin only experienced a modest 1.6% pullback, demonstrating crypto's relative resilience compared to traditional markets. BlackRock and Strategy (formerly MicroStrategy) appear to be in an arms race for Bitcoin supply accumulation. BlackRock's IBIT ETF recorded $612 million in inflows last week, while Strategy now holds 815,061 BTC, surpassing BlackRock's 802,823 BTC holdings. Each Iran-related shock is producing smaller Bitcoin sell-offs than the previous one, suggesting that geopolitical risk is largely priced into the market. Crypto is increasingly acting as a geopolitical shock absorber.
BULLISH Scenario (Probability: 55-60%)
The bullish case rests on several catalysts. Institutional accumulation continues with ETF inflows averaging $1.9 billion weekly. The $80,000 level represents key resistance, and breaking above it would trigger approximately $619 million in short liquidations. The Coinbase premium index has remained positive for 18 consecutive days, indicating strong US buying pressure. Additionally, the SEC under Chairman Paul Atkins is taking a noticeably friendlier stance toward crypto regulation compared to the previous administration. Near-term price targets include $80,000 to $82,000, which forms a significant resistance cluster. If $82,000 breaks with strong volume, mid-term targets of $85,000 to $88,000 become achievable. Technical confirmation would come from a daily close above $79,000 with the lagging span clearing the Kumo cloud on the Ichimoku indicator.
BEARISH Scenario (Probability: 40-45%)
The bearish case presents several risks worth monitoring. Daily MACD is showing bearish divergence, with price making higher highs while momentum indicators decline. Overbought conditions on both CCI and Williams %R suggest potential exhaustion. If US-Iran talks collapse unexpectedly, risk-off sentiment could trigger a cascade of selling. A breakdown below $76,000 support would trigger approximately $645 million in long liquidations, potentially accelerating the decline. Support levels to watch include $76,000 as critical support, followed by $73,000 to $74,000 in the previous accumulation zone, and $71,000 as a major structural level.
Trading Strategy Recommendations
For short-term traders focusing on the 1-7 day timeframe, there are two primary scenarios to consider. In the breakout play scenario, enter long positions above $79,500 with confirmation, targeting $81,500 to $82,000, with a stop loss placed at $78,200 below recent support, offering a risk-to-reward ratio of approximately 1 to 2.5. Alternatively, for range-bound conditions, the current trading range sits between $77,000 and $78,200, where traders can buy dips toward $77,500 and sell rallies toward $78,000 and above, maintaining tight stops on both sides.
For swing traders with a 1-4 week horizon, a conservative approach would involve waiting for a daily close above $80,000 before adding to long positions, scaling in with 25% position sizes on confirmed breaks, while keeping 50% of capital available for dip-buying opportunities below $76,000. More aggressive traders might consider holding current longs with a trailing stop at $77,000, adding to positions on any dips into the $76,000 to $77,000 zone, with a target of $85,000 or higher over the next two to four weeks.
Risk management remains paramount in the current environment. Given the 17.5% run over the past 30 days, consider reducing position sizes by 20-30% from normal levels. For futures trading, use maximum leverage of 3-5x as volatility is likely to expand near the $80,000 level. Monitor correlations with oil prices and the US Dollar Index, as simultaneous spikes in both could cause crypto to lag traditional markets. Be aware that $80,000 represents a magnet for short liquidations while $76,000 serves the same function for long liquidations.
Key levels to watch include $82,000 as major resistance in the negative gamma zone, $80,000 as key resistance with high call open interest, $78,000 as current psychological support, $76,000 as critical support and a long liquidation trigger, and $74,000 as a strong demand zone where buyers have historically stepped in.
Bottom Line: The path of least resistance remains upward while institutional flows continue, but exercise caution near $80K resistance. The US-Iran situation is a known risk that markets have largely adapted to. Your edge lies in waiting for clean breaks rather than anticipating them.