


#AltcoinsRallyStrong
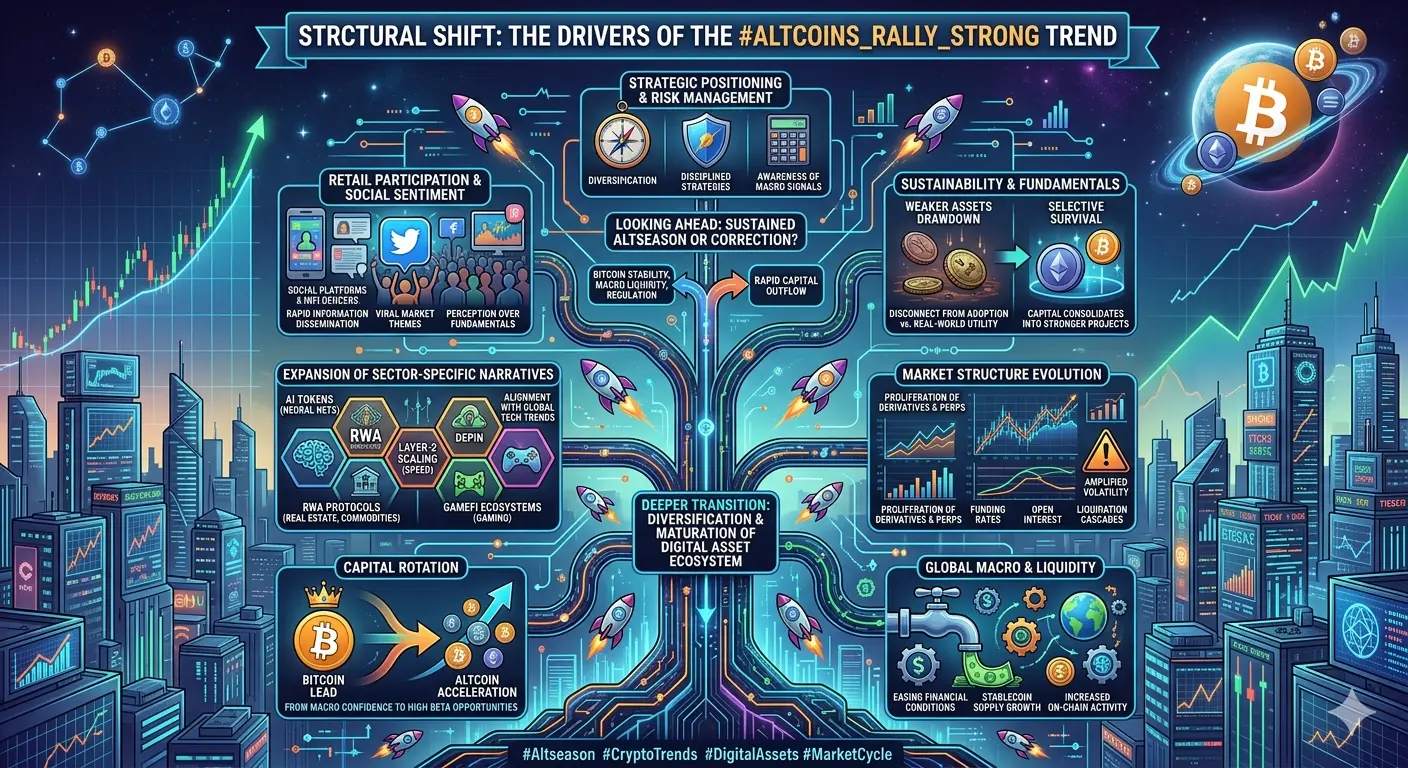
The crypto market is going through an important change right now. Altcoins are starting to move on their own and show fresh strength. They are not just copying Bitcoin's price anymore. Bitcoin is still the main leader of the whole market, but money is slowly moving from Bitcoin into some selected altcoins. This movement is helped by better liquidity (easier buying and selling), higher trading volumes in certain areas, and strong interest in popular stories like AI, DeFi, real-world assets (RWAs), and fast blockchains.
This is not a full altseason yet. The Altcoin Season Index is currently around 41 — much lower than the 75 level needed for a real broad altseason. Bitcoin dominance is still high at about 59.3%. So we are in a selective rally. Only the stronger projects with real use cases, support from big institutions, and good trading volume are performing well.
1. What Are Altcoins and Why Do They Matter?
Altcoins mean every cryptocurrency except Bitcoin. They are the part of crypto that brings new ideas and real-world uses. Here are the main types:
Smart Contracts and DeFi — Ethereum (ETH) and Solana (SOL) help build decentralized finance apps.
Payments — XRP is used for fast and cheap cross-border money transfers.
Data Oracles — Chainlink (LINK) connects blockchains to real-world data.
AI and Compute — Bittensor (TAO) and Render (RENDER) work on decentralized artificial intelligence and computing power.
Real-World Assets (RWAs) — Ondo (ONDO) brings traditional finance assets onto blockchain.
Fast Layer-1 Blockchains and Scaling — Sui (SUI), Hyperliquid (HYPE), and Arbitrum (ARB) offer high speed and lower fees.
Altcoins are very sensitive to liquidity. When new money comes in and trading volume goes up, they can grow very fast — sometimes 2 times to 10 times in a good rotation. But when liquidity leaves, prices can drop quickly. Their success depends on new inflows, rising volume, and people feeling more willing to take risk.
2. Current Market Situation (as of April 19, 2026)
Bitcoin (BTC): Trading around $75,600 – $76,200 (recent price near $75,700).
Total Crypto Market Cap: Between $2.55 trillion and $2.65 trillion.
Bitcoin Dominance: ~59.3% (this high level means most money is still in Bitcoin, so altcoins cannot all rise together easily).
Altcoin Season Index: ~41 (this shows we are still mostly in Bitcoin season, not full altseason).
24-Hour Trading Volume: Around $118 billion to $123 billion (volume is growing, but only in selected narrative coins).
Prices of some altcoins are rising, but the move is not strong everywhere. Liquidity and volume are coming first into big, trusted coins and hot topics like AI and DeFi. This makes the current rally selective instead of a big wave that lifts everything.
3. How Major Altcoins Are Behaving (Updated Prices + Liquidity View)
Large Caps — More Stable with Institutional Support
These coins have deeper order books, so buying or selling does not move the price too much.
Ethereum (ETH): ~$2,350
ETF inflows are giving steady liquidity. Volume often increases when price dips — this is usually a sign that smart money is buying. Short-term price moves are normally +3% to +5%.
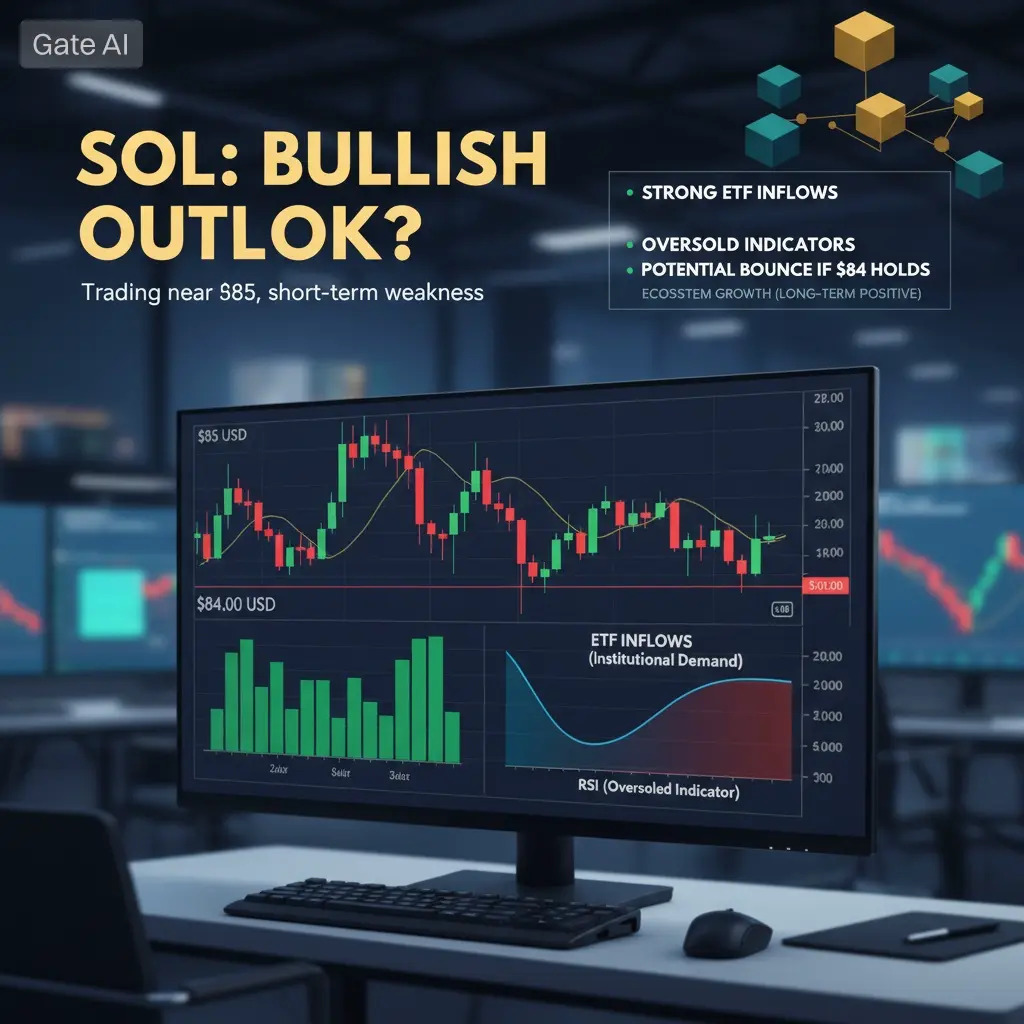
Solana (SOL): ~$86
On-chain activity is healthy and the ecosystem is growing (including new integrations). Liquidity is getting better in DeFi. Weekly price swings are around 5–10%.
XRP: ~$1.43
Price momentum comes from new utility features and growing institutional interest. Volume jumps during upward moves, backed by big holders.
BNB: ~$630
Very deep liquidity and low daily volatility (around 2–4%).
DOGE: ~$0.095
Moves are driven by retail traders and occasional big whale activity, so volatility is high.
Mid Caps — Volume Starts to Speed Up Here
When conviction grows, liquidity builds faster and percentage gains can be bigger.
Chainlink (LINK): ~$9.30 – $9.64
Volume is rising steadily because of real partnerships; liquidity is getting stronger.
Bittensor (TAO): ~$242 – $245
The AI story is pulling in serious money. Order books are thinner, so price swings are larger.
Render (RENDER): ~$1.77 – $1.80
Volume follows demand for decentralized GPU rendering and AI compute.
Ondo (ONDO): ~$0.26
RWA narrative is bringing more professional, institutional liquidity.
Sui (SUI): ~$0.95
Liquidity flows in quickly during ecosystem news and momentum.
High-Momentum Trending Coins (Higher Risk)
Hyperliquid (HYPE): ~$44
This decentralized perpetuals platform is seeing very strong trading volume growth.
Other coins showing selective strength:
Arbitrum (ARB ~$0.13), Sei (SEI), and Toncoin
(TON ~$1.35).
Simple Key Point:
Big percentage jumps happen when lots of liquidity rushes in suddenly. But when that volume disappears, prices can fall sharply. Always look at real trading volume before you buy.
4. What Drives the Market? (Simple Breakdown)
Institutional Money: ETF inflows, especially for ETH, create a strong base of liquidity and stop big price crashes.
Trading Volume: When volume rises, it proves real buyers are interested. Rallies without volume are usually weak and do not last.
Liquidity Rotation: Money moves step by step — first from BTC to large caps (ETH, SOL, XRP), then to mid-caps and hot narratives (AI, RWA, DeFi). This step-by-step flow is normal in every bull cycle.
5. Important Risks You Should Know
Bitcoin dominance is still high (~59.3%), so it limits how much altcoins can rise overall.
When RSI is very high (overbought) and volume starts falling, a correction often comes.
Some breakouts look good but have no volume behind them — these usually fail and reverse.
Big news events or sudden profit-taking can pull liquidity out fast and cause sharp drops.
Clear Reality:
This market is driven by liquidity more than anything else. Price follows volume and how easy it is to trade, not just hype.
6. Realistic Price Targets (They Depend on Liquidity)
These targets can only be reached if volume keeps growing and Bitcoin stays stable:
ETH ($86): Conservative $110 | Aggressive $150 (28–74% upside)
XRP (~$1.43): Conservative $2.00 | Aggressive $3.00 (40–110% upside)
AI coins like TAO and RENDER: 30–80%+ upside if the narrative and liquidity stay strong
HYPE and ONDO: 25–70% potential during selective rotation
Must-Watch Condition: Bitcoin needs to hold support around $72,000 – $74,000. If it breaks lower, overall liquidity can weaken.
7. Simple and Professional Trading Strategy
Main Rule: Always trade based on liquidity and volume — do not chase hype or price alone.
Buy when volume is increasing and order books are getting deeper.
Never buy coins that are pumping with very low volume.
Sell or reduce position when volume starts to drop.
Buy good projects during dips that still have high volume.
Take profits step by step — for example, sell 25% of your position at every target level.
Always set stop-losses to protect your capital.
Easy Conservative Portfolio Suggestion:
40% in BTC + ETH
30% in large altcoins (SOL, XRP, LINK)
20% in stablecoins (USDT or USDC) — keep this ready to buy dips
10% in narrative mid-caps (TAO, ONDO, RENDER)
Risk rule: Never put more than 5–10% of your total portfolio in one altcoin. Keep total altcoin exposure under 30–50%.
8. What Will Signal a Real Full Altseason?
A true broad altseason will appear when:
Bitcoin dominance falls clearly below 55%
Volume grows strongly across many mid-cap coins (not only the biggest ones)
Liquidity spreads out to more coins instead of staying in just a few narratives
Right now, we stay in selective mode. Focus only on solid projects that have real utility, good inflows, and volume support.
Final Simple Takeaway
The crypto market in 2026 is becoming more mature and smarter. Good altcoins with actual use cases and real money behind them are attracting serious capital. Remember this one important idea: Price follows liquidity, and liquidity follows real conviction.
Stay patient. Watch fundamentals and volume signals closely. Manage your risk carefully every time. The current selective rally still has potential to grow — but only the right altcoins with strong demand will benefit.
The crypto market is going through an important change right now. Altcoins are starting to move on their own and show fresh strength. They are not just copying Bitcoin's price anymore. Bitcoin is still the main leader of the whole market, but money is slowly moving from Bitcoin into some selected altcoins. This movement is helped by better liquidity (easier buying and selling), higher trading volumes in certain areas, and strong interest in popular stories like AI, DeFi, real-world assets (RWAs), and fast blockchains.
This is not a full altseason yet. The Altcoin Season Index is currently around 41 — much lower than the 75 level needed for a real broad altseason. Bitcoin dominance is still high at about 59.3%. So we are in a selective rally. Only the stronger projects with real use cases, support from big institutions, and good trading volume are performing well.
1. What Are Altcoins and Why Do They Matter?
Altcoins mean every cryptocurrency except Bitcoin. They are the part of crypto that brings new ideas and real-world uses. Here are the main types:
Smart Contracts and DeFi — Ethereum (ETH) and Solana (SOL) help build decentralized finance apps.
Payments — XRP is used for fast and cheap cross-border money transfers.
Data Oracles — Chainlink (LINK) connects blockchains to real-world data.
AI and Compute — Bittensor (TAO) and Render (RENDER) work on decentralized artificial intelligence and computing power.
Real-World Assets (RWAs) — Ondo (ONDO) brings traditional finance assets onto blockchain.
Fast Layer-1 Blockchains and Scaling — Sui (SUI), Hyperliquid (HYPE), and Arbitrum (ARB) offer high speed and lower fees.
Altcoins are very sensitive to liquidity. When new money comes in and trading volume goes up, they can grow very fast — sometimes 2 times to 10 times in a good rotation. But when liquidity leaves, prices can drop quickly. Their success depends on new inflows, rising volume, and people feeling more willing to take risk.
2. Current Market Situation (as of April 19, 2026)
Bitcoin (BTC): Trading around $75,600 – $76,200 (recent price near $75,700).
Total Crypto Market Cap: Between $2.55 trillion and $2.65 trillion.
Bitcoin Dominance: ~59.3% (this high level means most money is still in Bitcoin, so altcoins cannot all rise together easily).
Altcoin Season Index: ~41 (this shows we are still mostly in Bitcoin season, not full altseason).
24-Hour Trading Volume: Around $118 billion to $123 billion (volume is growing, but only in selected narrative coins).
Prices of some altcoins are rising, but the move is not strong everywhere. Liquidity and volume are coming first into big, trusted coins and hot topics like AI and DeFi. This makes the current rally selective instead of a big wave that lifts everything.
3. How Major Altcoins Are Behaving (Updated Prices + Liquidity View)
Large Caps — More Stable with Institutional Support
These coins have deeper order books, so buying or selling does not move the price too much.
Ethereum (ETH): ~$2,350
ETF inflows are giving steady liquidity. Volume often increases when price dips — this is usually a sign that smart money is buying. Short-term price moves are normally +3% to +5%.
Solana (SOL): ~$86
On-chain activity is healthy and the ecosystem is growing (including new integrations). Liquidity is getting better in DeFi. Weekly price swings are around 5–10%.
XRP: ~$1.43
Price momentum comes from new utility features and growing institutional interest. Volume jumps during upward moves, backed by big holders.
BNB: ~$630
Very deep liquidity and low daily volatility (around 2–4%).
DOGE: ~$0.095
Moves are driven by retail traders and occasional big whale activity, so volatility is high.
Mid Caps — Volume Starts to Speed Up Here
When conviction grows, liquidity builds faster and percentage gains can be bigger.
Chainlink (LINK): ~$9.30 – $9.64
Volume is rising steadily because of real partnerships; liquidity is getting stronger.
Bittensor (TAO): ~$242 – $245
The AI story is pulling in serious money. Order books are thinner, so price swings are larger.
Render (RENDER): ~$1.77 – $1.80
Volume follows demand for decentralized GPU rendering and AI compute.
Ondo (ONDO): ~$0.26
RWA narrative is bringing more professional, institutional liquidity.
Sui (SUI): ~$0.95
Liquidity flows in quickly during ecosystem news and momentum.
High-Momentum Trending Coins (Higher Risk)
Hyperliquid (HYPE): ~$44
This decentralized perpetuals platform is seeing very strong trading volume growth.
Other coins showing selective strength:
Arbitrum (ARB ~$0.13), Sei (SEI), and Toncoin
(TON ~$1.35).
Simple Key Point:
Big percentage jumps happen when lots of liquidity rushes in suddenly. But when that volume disappears, prices can fall sharply. Always look at real trading volume before you buy.
4. What Drives the Market? (Simple Breakdown)
Institutional Money: ETF inflows, especially for ETH, create a strong base of liquidity and stop big price crashes.
Trading Volume: When volume rises, it proves real buyers are interested. Rallies without volume are usually weak and do not last.
Liquidity Rotation: Money moves step by step — first from BTC to large caps (ETH, SOL, XRP), then to mid-caps and hot narratives (AI, RWA, DeFi). This step-by-step flow is normal in every bull cycle.
5. Important Risks You Should Know
Bitcoin dominance is still high (~59.3%), so it limits how much altcoins can rise overall.
When RSI is very high (overbought) and volume starts falling, a correction often comes.
Some breakouts look good but have no volume behind them — these usually fail and reverse.
Big news events or sudden profit-taking can pull liquidity out fast and cause sharp drops.
Clear Reality:
This market is driven by liquidity more than anything else. Price follows volume and how easy it is to trade, not just hype.
6. Realistic Price Targets (They Depend on Liquidity)
These targets can only be reached if volume keeps growing and Bitcoin stays stable:
ETH ($86): Conservative $110 | Aggressive $150 (28–74% upside)
XRP (~$1.43): Conservative $2.00 | Aggressive $3.00 (40–110% upside)
AI coins like TAO and RENDER: 30–80%+ upside if the narrative and liquidity stay strong
HYPE and ONDO: 25–70% potential during selective rotation
Must-Watch Condition: Bitcoin needs to hold support around $72,000 – $74,000. If it breaks lower, overall liquidity can weaken.
7. Simple and Professional Trading Strategy
Main Rule: Always trade based on liquidity and volume — do not chase hype or price alone.
Buy when volume is increasing and order books are getting deeper.
Never buy coins that are pumping with very low volume.
Sell or reduce position when volume starts to drop.
Buy good projects during dips that still have high volume.
Take profits step by step — for example, sell 25% of your position at every target level.
Always set stop-losses to protect your capital.
Easy Conservative Portfolio Suggestion:
40% in BTC + ETH
30% in large altcoins (SOL, XRP, LINK)
20% in stablecoins (USDT or USDC) — keep this ready to buy dips
10% in narrative mid-caps (TAO, ONDO, RENDER)
Risk rule: Never put more than 5–10% of your total portfolio in one altcoin. Keep total altcoin exposure under 30–50%.
8. What Will Signal a Real Full Altseason?
A true broad altseason will appear when:
Bitcoin dominance falls clearly below 55%
Volume grows strongly across many mid-cap coins (not only the biggest ones)
Liquidity spreads out to more coins instead of staying in just a few narratives
Right now, we stay in selective mode. Focus only on solid projects that have real utility, good inflows, and volume support.
Final Simple Takeaway
The crypto market in 2026 is becoming more mature and smarter. Good altcoins with actual use cases and real money behind them are attracting serious capital. Remember this one important idea: Price follows liquidity, and liquidity follows real conviction.
Stay patient. Watch fundamentals and volume signals closely. Manage your risk carefully every time. The current selective rally still has potential to grow — but only the right altcoins with strong demand will benefit.