


#加密市场上涨
🚀 Bitcoin & Ethereum — Will the Market Move Higher?
Current Situation
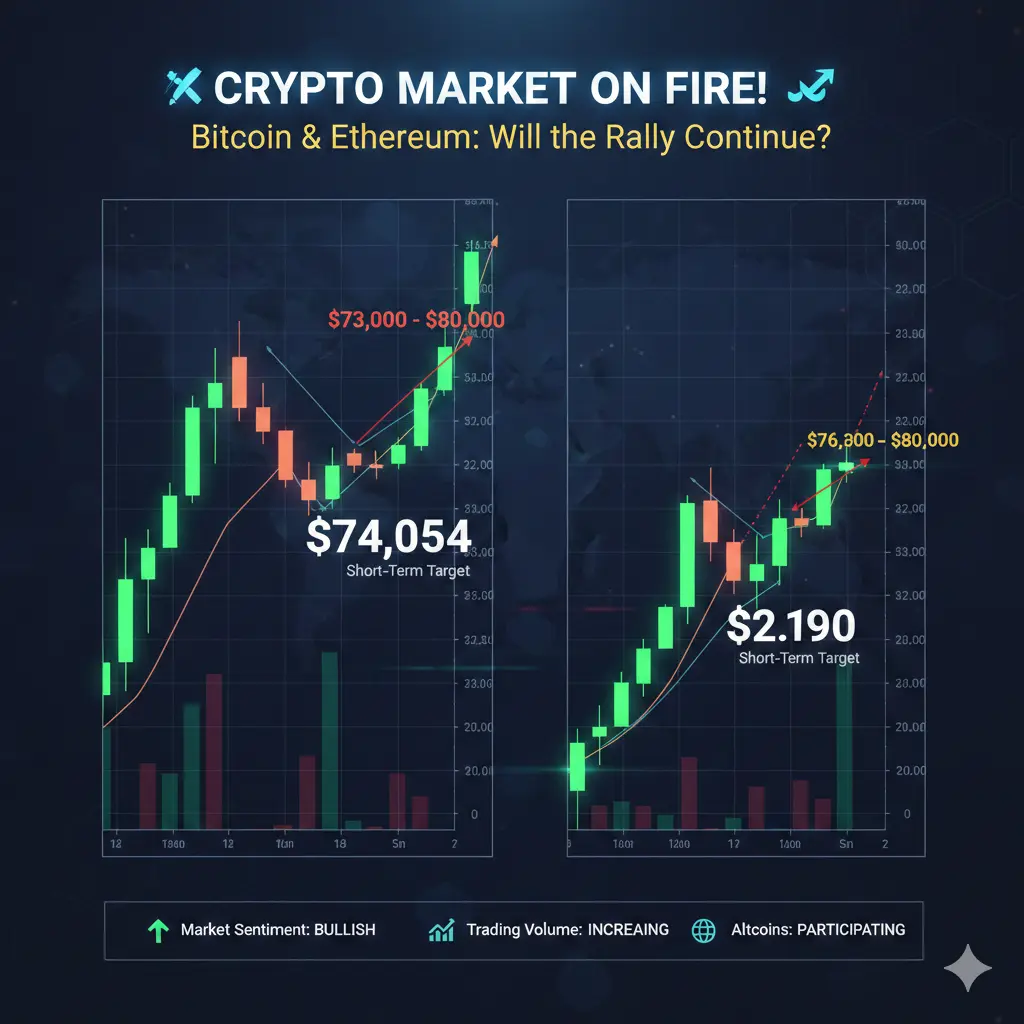
Right now, Bitcoin is at $74,054 and Ethereum at $2,190, showing strong gains in the last 24 hours. The rally is broad-based, with altcoins participating, trading volumes increasing, and market sentiment swinging decisively bullish. From my perspective, the market is already riding significant momentum, but there are several factors that can determine whether this upswing continues.
Why the Market Could Go Higher
1️⃣ Technical Momentum
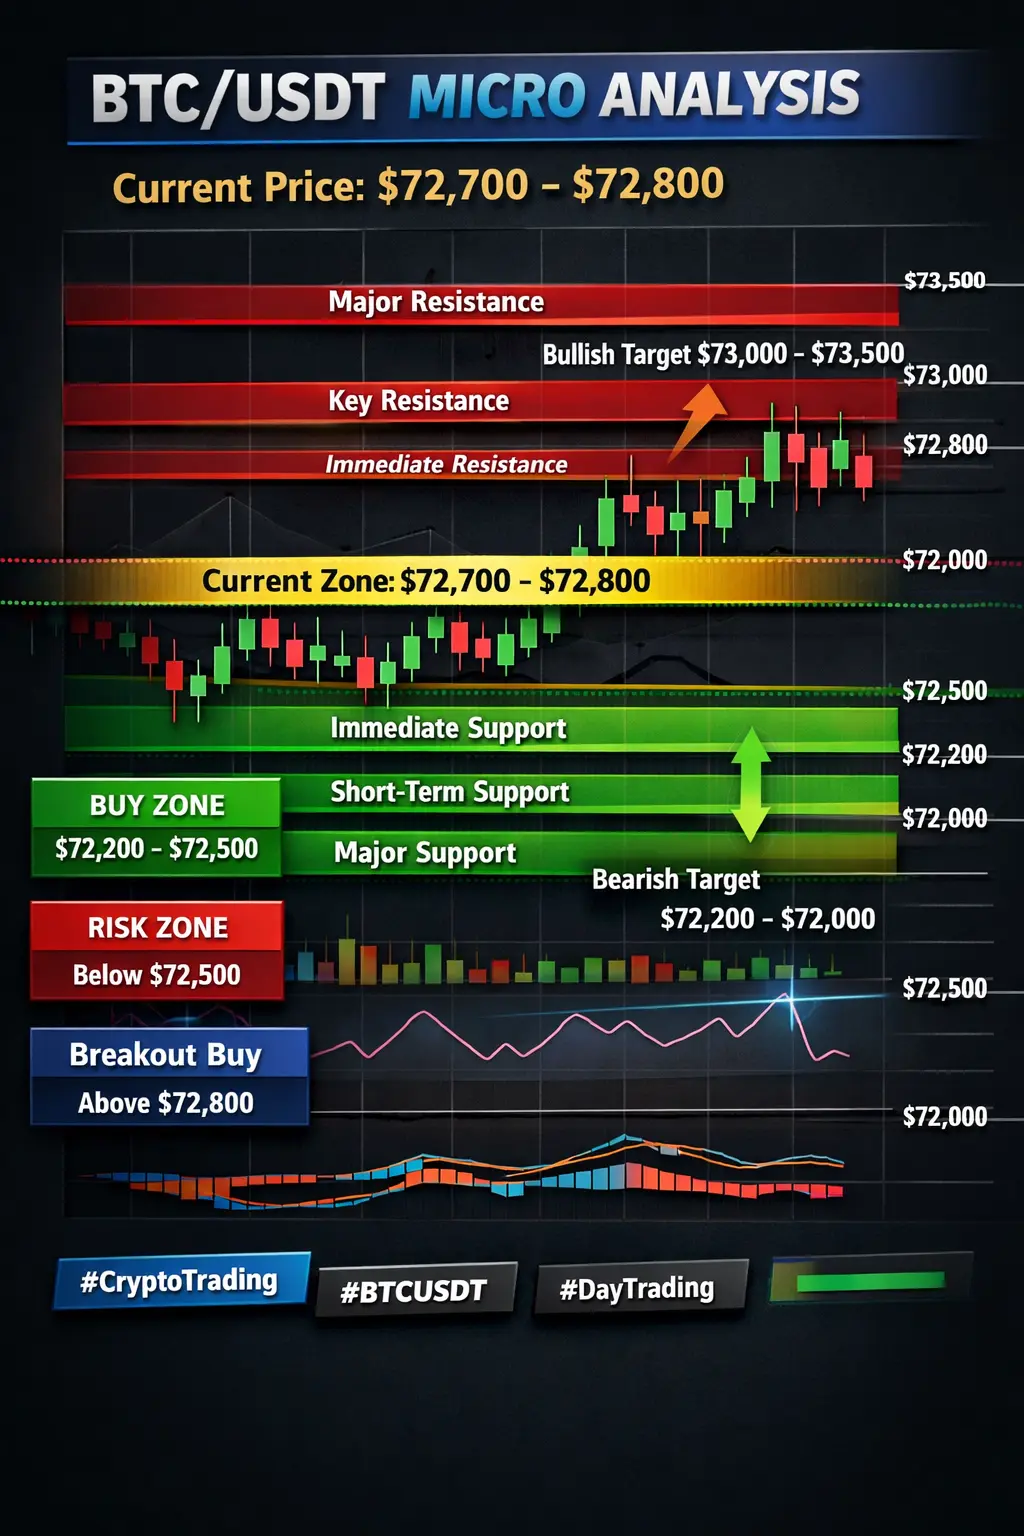
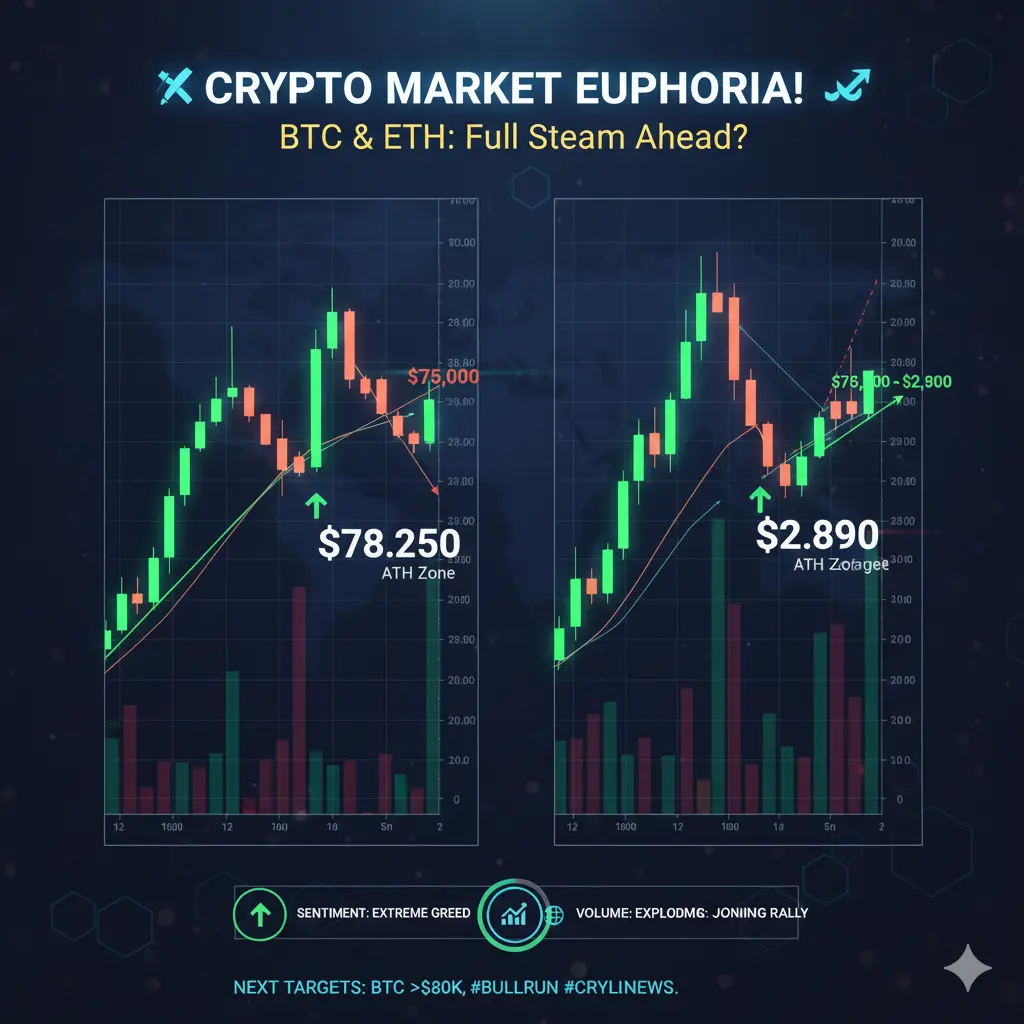
Bitcoin has broken through short-term resistance around $72,500–$73,000. Historically, when BTC breaks such levels with strong volume, the next psychological targets often appear around $75,000–$76,000, and if momentum persists, even $78,000–$80,000 could be within reach.
Ethereum is following closely, maintaining a tight correlation with Bitcoin. Its breakout above $2,150 strengthens the bullish narrative for the overall crypto market.
2️⃣ Investor Sentiment & FOMO
The market is full of energy, with retail traders and institutional participants increasingly entering positions.
Positive news, such as renewed interest in crypto, macro signals from central banks, or easing geopolitical tensions, tends to accelerate momentum.
Fear-of-missing-out (FOMO) can drive price beyond technical projections in short bursts, pushing Bitcoin and Ethereum higher.
3️⃣ Altcoin & Market Breadth
Altcoins are heating up alongside BTC and ETH, which confirms that the rally is broad-based. Markets that move in coordination are usually stronger and more sustainable than isolated spikes.
Healthy altcoin performance supports liquidity inflows, which can indirectly lift Bitcoin higher as new capital enters the crypto ecosystem.
Factors That Could Limit Upside
1️⃣ Volatility & Short-Term Corrections
Rapid price surges often trigger pullbacks. Short-term corrections between $72,500–$73,500 are normal and should be expected as traders take profits.
High volatility means that while the overall trend is bullish, intraday swings can be sharp.
2️⃣ Macro & Regulatory Risks
Sudden regulatory announcements, Fed commentary, or global macro shocks (like geopolitical tensions) can temporarily dampen momentum.
If any negative news triggers panic selling, prices may retest lower support levels before continuing upward.
3️⃣ Psychological Resistance Zones
Bitcoin has strong psychological resistance at $75,000–$76,000. Market behavior near these zones can determine if the rally sustains or stalls.
Ethereum faces similar resistance at $2,250–$2,300, which may slow momentum if buyers hesitate.
My Personal Outlook
From my analysis:
Short-term (next 24–48 hours): Momentum is strong; BTC could touch $75k–$76k if volume remains high and no sudden macro shocks occur. ETH is likely to follow proportionally.
Medium-term (weeks ahead): A sustainable trend higher depends on continued investor confidence, market breadth, and positive sentiment from both retail and institutional players.
Strategy: Maintain core positions in BTC and ETH, consider scaling into high-conviction altcoins during small pullbacks, and keep some capital in stable positions to hedge against volatility.
Bottom Line:
The market is well-positioned for further upward movement, but it’s crucial to respect volatility and psychological resistance zones. Strong technical momentum, broad market participation, and positive sentiment all point toward the possibility of higher prices, yet short-term pullbacks are natural and healthy.
If you want, I can also make a fully annotated chart/visual showing:
BTC price at $74,054
ETH at $2,190
🚀 Bitcoin & Ethereum — Will the Market Move Higher?
Current Situation
Right now, Bitcoin is at $74,054 and Ethereum at $2,190, showing strong gains in the last 24 hours. The rally is broad-based, with altcoins participating, trading volumes increasing, and market sentiment swinging decisively bullish. From my perspective, the market is already riding significant momentum, but there are several factors that can determine whether this upswing continues.
Why the Market Could Go Higher
1️⃣ Technical Momentum
Bitcoin has broken through short-term resistance around $72,500–$73,000. Historically, when BTC breaks such levels with strong volume, the next psychological targets often appear around $75,000–$76,000, and if momentum persists, even $78,000–$80,000 could be within reach.
Ethereum is following closely, maintaining a tight correlation with Bitcoin. Its breakout above $2,150 strengthens the bullish narrative for the overall crypto market.
2️⃣ Investor Sentiment & FOMO
The market is full of energy, with retail traders and institutional participants increasingly entering positions.
Positive news, such as renewed interest in crypto, macro signals from central banks, or easing geopolitical tensions, tends to accelerate momentum.
Fear-of-missing-out (FOMO) can drive price beyond technical projections in short bursts, pushing Bitcoin and Ethereum higher.
3️⃣ Altcoin & Market Breadth
Altcoins are heating up alongside BTC and ETH, which confirms that the rally is broad-based. Markets that move in coordination are usually stronger and more sustainable than isolated spikes.
Healthy altcoin performance supports liquidity inflows, which can indirectly lift Bitcoin higher as new capital enters the crypto ecosystem.
Factors That Could Limit Upside
1️⃣ Volatility & Short-Term Corrections
Rapid price surges often trigger pullbacks. Short-term corrections between $72,500–$73,500 are normal and should be expected as traders take profits.
High volatility means that while the overall trend is bullish, intraday swings can be sharp.
2️⃣ Macro & Regulatory Risks
Sudden regulatory announcements, Fed commentary, or global macro shocks (like geopolitical tensions) can temporarily dampen momentum.
If any negative news triggers panic selling, prices may retest lower support levels before continuing upward.
3️⃣ Psychological Resistance Zones
Bitcoin has strong psychological resistance at $75,000–$76,000. Market behavior near these zones can determine if the rally sustains or stalls.
Ethereum faces similar resistance at $2,250–$2,300, which may slow momentum if buyers hesitate.
My Personal Outlook
From my analysis:
Short-term (next 24–48 hours): Momentum is strong; BTC could touch $75k–$76k if volume remains high and no sudden macro shocks occur. ETH is likely to follow proportionally.
Medium-term (weeks ahead): A sustainable trend higher depends on continued investor confidence, market breadth, and positive sentiment from both retail and institutional players.
Strategy: Maintain core positions in BTC and ETH, consider scaling into high-conviction altcoins during small pullbacks, and keep some capital in stable positions to hedge against volatility.
Bottom Line:
The market is well-positioned for further upward movement, but it’s crucial to respect volatility and psychological resistance zones. Strong technical momentum, broad market participation, and positive sentiment all point toward the possibility of higher prices, yet short-term pullbacks are natural and healthy.
If you want, I can also make a fully annotated chart/visual showing:
BTC price at $74,054
ETH at $2,190