TianyaAcademy
Today is December 12, 2025. Here's a brief analysis of Bitcoin, Ethereum, and various indicators. Please do not criticize if you disagree. For reference only, not investment advice.
1. First, let's look at the Bollinger Bands. Currently, on the daily chart, it appears to be moving in a narrow range with a sideways oscillation. It is also operating above the middle band. This is a relatively healthy bullish trend.
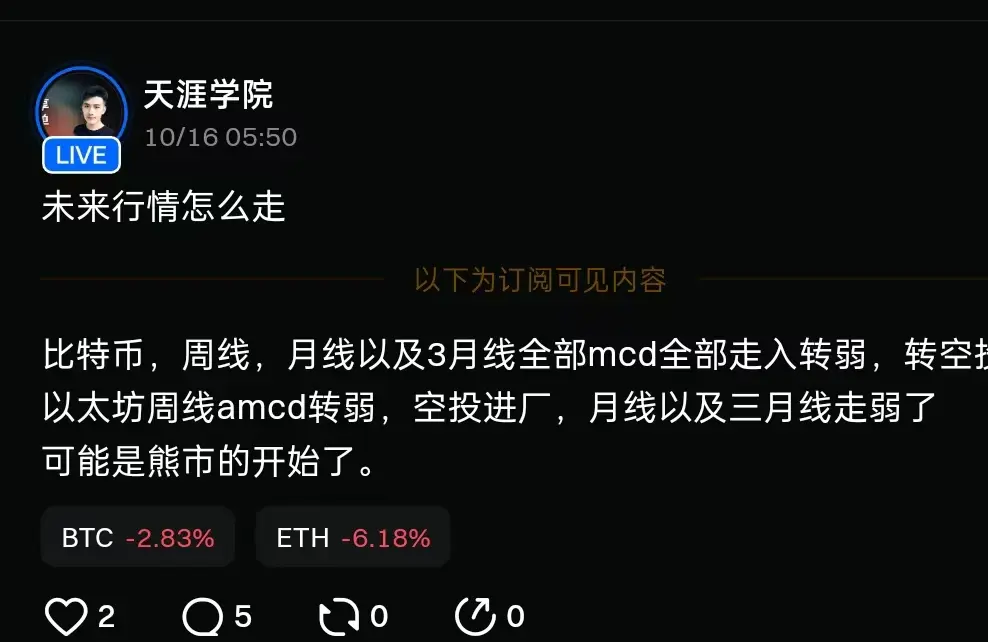
2. Looking at the weekly chart through the AMC D indicator, the airdrop volume is gradually decreasing. If we observe the weekly AMC D on Sesame's side, a golden cross has already for
View Original1. First, let's look at the Bollinger Bands. Currently, on the daily chart, it appears to be moving in a narrow range with a sideways oscillation. It is also operating above the middle band. This is a relatively healthy bullish trend.
2. Looking at the weekly chart through the AMC D indicator, the airdrop volume is gradually decreasing. If we observe the weekly AMC D on Sesame's side, a golden cross has already for