Yusfirah

vip
Age 1.3 Yıl
Peak Tier 5
No content yet
market analysis BTC
gate liveLIVE
880
live-coin
  • Reward
  • Comment
  • Repost
  • Share
Gate is currently holding the UP futures trading competition. Trade futures for the first time and receive an 880 INX reward, and invite friends to earn even more — up to 880 INX. Don’t miss out, join right now and share the 2,019,709 INX prize pool. https://www.gate.com/campaigns/4603?ch=2160&ref=VLJNBLTXUG&ref_type=132
post-image
  • Reward
  • Comment
  • Repost
  • Share
Gate 13 Anniversary Celebration Continues to Blow Up the Scene!
Board the spaceship to the feast, enjoy endless prizes✨
Answer questions daily to win boarding passes, gold, and peripherals are drawn nonstop!
Collect 13 time capsules to unlock the mysterious and heavy anniversary gift pack
Early bird benefits limited-time抢:4.9 17:00-4.17 12:00 (UTC+8)
Hurry up 👉 https://www.gate.com/activities/13th-anniversary
post-image
  • Reward
  • 5
  • Repost
  • Share
MasterChuTheOldDemonMasterChu:
Just charge it 👊
View More
🚀 SpaceX (SPCX) Pre-IPOs subscriptions have reached $225,000,000
📊 Live progress is still building—It’s not too late to secure a stronger allocation.
🔹 Distribution: Apr 22, 14:00 (UTC)
🔹 Pre-market trading: Apr 24, 10:00 (UTC)
🔹 VIP 5+ users and Affiliate Ultras can enjoy additional free airdrops
🔹 New users can earn up to 200% APR via Simple Earn
Subscribe now: https://www.gate.com/ipos/2
More info: https://www.gate.com/announcements/article/50724
Gate_Square
🚀 SpaceX (SPCX) Pre-IPOs subscriptions have reached $225,000,000
📊 Live progress is still building—It’s not too late to secure a stronger allocation.
🔹 Distribution: Apr 22, 14:00 (UTC)
🔹 Pre-market trading: Apr 24, 10:00 (UTC)
🔹 VIP 5+ users and Affiliate Ultras can enjoy additional free airdrops
🔹 New users can earn up to 200% APR via Simple Earn
Subscribe now: https://www.gate.com/ipos/2
More info: https://www.gate.com/announcements/article/50724
repost-content-media
  • Reward
  • 5
  • 1
  • Share
MasterChuTheOldDemonMasterChu:
Just charge and you're done 👊
View More
#USIranTensionsShakeMarkets
The current global market structure is transitioning into a high-volatility, headline-driven regime where geopolitical shocks are now the dominant pricing mechanism across energy, crypto, and broader risk assets. The latest escalation in US–Iran tensions, combined with renewed uncertainty around ceasefire stability, has effectively reset short-term market expectations and forced a rapid repricing of risk across multiple asset classes.
At this stage, the key shift is not just direction—it is regime change in behavior. Markets are no longer responding to clean techni
BTC-0,36%
post-image
[The user has shared his/her trading data. Go to the App to view more.]
  • Reward
  • 6
  • Repost
  • Share
ShainingMoon:
To The Moon 🌕
View More
#Gate13周年现场直击
SaylorReleasesBitcoinTrackerUpdate
THE WORLD'S LARGEST CORPORATE BITCOIN TREASURY KEEPS GROWING | APRIL 20, 2026
Michael Saylor, Executive Chairman and co-founder of Strategy, formerly known as MicroStrategy, has once again released his Bitcoin Tracker update the weekly post on social media that the entire crypto market has learned to treat as a leading indicator of the next major institutional Bitcoin purchase. The pattern is now so well established that crypto analysts, traders, and institutional observers track these posts with the same attention they give to Federal Reserve
Falcon_Official
#Gate13周年现场直击
SaylorReleasesBitcoinTrackerUpdate
THE WORLD'S LARGEST CORPORATE BITCOIN TREASURY KEEPS GROWING | APRIL 20, 2026
Michael Saylor, Executive Chairman and co-founder of Strategy, formerly known as MicroStrategy, has once again released his Bitcoin Tracker update the weekly post on social media that the entire crypto market has learned to treat as a leading indicator of the next major institutional Bitcoin purchase. The pattern is now so well established that crypto analysts, traders, and institutional observers track these posts with the same attention they give to Federal Reserve statements. When Saylor posts the tracker, a filing confirming a nine-figure or ten-figure Bitcoin buy typically follows within twenty-four hours. April 2026 has been no different.
The Bitcoin Tracker is a visual dashboard that Strategy publishes to document its ongoing accumulation history. It displays every purchase the company has made since August 2020, plotted as orange dots against Bitcoin's price chart over time. The chart has become one of the most recognized images in institutional crypto investment. Each new dot added to the chart represents another tranche of Bitcoin removed from exchange supply and placed into long-term corporate custody. Saylor has routinely accompanied these tracker posts with short phrases that have become signals in their own right. This month he posted "Think Bigger" ahead of the latest acquisition and the market responded exactly as it has dozens of times before.
On April 13, 2026, Strategy filed an 8-K with the Securities and Exchange Commission confirming the purchase of 13,927 Bitcoin between April 6 and April 12 at an average price of approximately 71,902 dollars per coin, for a total cost of roughly one billion dollars. This was the company's fourth-largest weekly purchase of the year. The entire buy was funded through sales of STRC, Strategy's Variable Rate Series A Perpetual Stretch Preferred Stock, without a single share of MSTR common stock being issued. That distinction matters enormously to existing Strategy shareholders because it means the Bitcoin-per-share ratio, which Saylor calls BTC Yield, increased with zero dilution to common equity holders.
In the week prior, Strategy had added 4,871 Bitcoin for approximately 330 million dollars during the first week of April. Combined, these two purchases brought total holdings to 780,897 Bitcoin, acquired at a cumulative cost of approximately 59.02 billion dollars at an average cost basis of 75,577 dollars per coin. That holding represents more than 3.7 percent of Bitcoin's entire 21 million coin maximum supply the largest concentration of Bitcoin in the custody of any single publicly traded corporate entity in the world.
The quarter-to-date Bitcoin Gain metric, which Saylor describes as the closest measure to net income under Strategy's Bitcoin Standard framework, stood at 17,585 BTC for the first two weeks of April alone a dollar gain of approximately 1.309 billion dollars. Year-to-date BTC Gain reached 37,339 BTC, translating to 2.779 billion dollars. BTC Yield, the metric that measures how much Bitcoin exposure each share of MSTR now represents relative to the start of the year, stood at 5.6 percent year-to-date and 22.8 percent for the full year 2025.
The funding mechanism behind these purchases deserves careful attention because it is genuinely novel in corporate finance history. Strategy's STRC preferred stock pays an 11.5 percent variable annual dividend as of April 2026. Investors who want high-yield fixed-income exposure buy STRC. Strategy takes those proceeds and converts them directly into Bitcoin. The math that Saylor has repeatedly highlighted is this: Bitcoin only needs to appreciate at approximately 2.05 percent per year for Strategy to cover its STRC dividend obligations indefinitely without issuing new shares or drawing down the Bitcoin treasury. Given that Bitcoin's compound annual growth rate over any extended historical period has substantially exceeded 2 percent, Saylor argues the structure is sustainable across virtually any reasonable long-term scenario.
Since its launch in July 2025, STRC alone has financed the purchase of 50,792 Bitcoin. The remaining authorized capacity under Strategy's various ATM programs is substantial approximately 21.6 billion dollars in STRC shares and 27.1 billion dollars in MSTR common stock remain available, representing nearly 49 billion dollars in total buying power at current prices. Strategy has publicly signaled a target of reaching one million Bitcoin by the end of 2026. At 780,897, it still needs approximately 219,000 more coins. At the pace Strategy maintained in March 2026 when it purchased 46,233 Bitcoin in a single month, absorbing nearly three times the entire global mining output for the period the one million coin target is mathematically achievable before year-end if market conditions permit continued accumulation.
Strategy's pace of accumulation versus new Bitcoin supply is one of the most discussed dynamics in the institutional crypto market. In March 2026, miners collectively produced approximately 16,200 new Bitcoin while Strategy alone purchased 46,233. That means a single corporate buyer was absorbing roughly three times the planet's new Bitcoin supply during that period. This supply absorption dynamic, combined with the structural demand created by spot Bitcoin ETFs, is what analysts point to when explaining why Bitcoin's exchange reserves have fallen to seven-year lows despite the price being significantly below the October 2025 all-time high.
The first quarter of 2026 was not without pain.
Strategy reported approximately 14.5 billion dollars in unrealized losses on its Bitcoin position for Q1, a direct consequence of Bitcoin declining from its 126,021 dollar all-time high in October 2025 to levels below Strategy's 75,577 dollar average cost basis during February and early March. By April 17, however, when Bitcoin pushed back above 77,000 dollars for the first time since early February, Strategy's position returned to unrealized profit. MSTR shares surged 8 percent on that day, rising above the 200-week moving average for the first time since before the February selloff.
Saylor's response to the unrealized loss period was consistent with every prior period of drawdown in the company's six-year Bitcoin accumulation history. He did not sell. He did not pause. He bought more. At the end of March, Strategy paused briefly after a multi-week buying run, and Saylor revived his orange dot tracker with the phrase "Back to work" which was followed exactly as expected by the resumption of purchases. The predictability of the pattern has become a feature, not a bug. Institutions, ETF managers, and retail investors now factor Strategy's weekly acquisition cadence into their understanding of Bitcoin's demand structure.
Beyond the mechanics, Saylor also used the April period to address two narratives that had gained traction in crypto discussions. He stated publicly that Bitcoin had likely bottomed around 60,000 dollars, pointing to a familiar historical pattern where downturns end not with sentiment improving but with forced sellers becoming exhausted. He also dismissed quantum computing risks to Bitcoin as theoretical and solvable over time a position that contrasts with some academic concerns but aligns with the broad consensus among Bitcoin developers. He also proposed moving STRC dividend payments from monthly to semi-monthly frequency, a structural change designed to dampen price volatility in the preferred stock without altering the total annual yield or increasing the company's obligations.
As of April 20, 2026, Strategy holds 780,897 Bitcoin worth approximately 57 to 58 billion dollars at current market prices. The company has spent 59.02 billion dollars on this position at an average cost of 75,577 dollars per coin. With Bitcoin currently trading near 74,000 to 76,000 dollars, the position is approximately at breakeven or slightly under water depending on the day. The next Bitcoin Tracker post from Saylor is anticipated within days, and based on the historical pattern, a new filing confirming the next purchase will almost certainly follow shortly after.
One metric worth watching alongside these tracker updates is how Strategy's accumulation rate compares to the wider institutional inflow picture. Bitcoin spot ETFs attracted approximately one billion dollars in weekly inflows during the week ending April 19 the strongest ETF performance in over three months. Combined with Strategy's continued buying, the structural demand picture for Bitcoin remains substantially more robust than the current price level might suggest to observers focused only on short-term geopolitical volatility.
#CreatorCarvinal
#SaylorReleasesBitcoinTrackerUpdate
repost-content-media
  • Reward
  • 6
  • Repost
  • Share
ShainingMoon:
To The Moon 🌕
View More
#美伊冲突再起引发市场动荡
April 20, 2026 The current market phase can be best defined as a global macro liquidity stress test, where geopolitical escalation, leverage positioning, and tightening risk appetite are converging into a single synchronized market reaction. The renewed tensions between the United States and Iran have not initiated the underlying trend but have acted as an accelerant to a structural transition already forming beneath the surface of global risk assets.
What is unfolding is not a random sell-off, but a positioning reset inside a late-expansion market cycle where liquidity sensitiv
BTC-0,36%
post-image
post-image
[The user has shared his/her trading data. Go to the App to view more.]
  • Reward
  • 8
  • Repost
  • Share
ShainingMoon:
To The Moon 🌕
View More
market analysis BTC
1.461 views
2026-04-20 11:10
  • Reward
  • 4
  • Repost
  • Share
ShainingMoon:
To The Moon 🌕
View More
[The user has shared his/her trading data. Go to the App to view more.]
  • Reward
  • 4
  • Repost
  • Share
ShainingMoon:
To The Moon 🌕
View More
#FirstTradeOfTheWeek
Bitcoin (BTC) Weekly Trading Plan | April 2026
As of today, Bitcoin continues to trade around the $74,900 region, but the price itself is only a small part of the story. What truly matters right now is where we are in the market cycle — and in my view, we are at one of the most psychologically and structurally important phases: post-expansion consolidation before a decisive move.
This is the phase where amateurs get trapped, and professionals prepare.
Deep Market Context — What Is Really Happening
After a strong bullish expansion, markets do not continue moving in a strai
BTC-0,36%
post-image
  • Reward
  • 8
  • Repost
  • Share
ShainingMoon:
To The Moon 🌕
View More
#布伦特原油持续走强
The global oil market has been thrown back into extreme volatility, and what we are witnessing right now is not just a price rally—it is a full-scale repricing of geopolitical risk.
At the opening of Monday’s Asian session, crude oil didn’t simply rise—it gapped aggressively. Both WTI and Brent surged close to 7% within moments, with WTI pushing toward the high $80s and Brent rapidly approaching the $100 psychological barrier. This kind of move is not driven by normal supply-demand mechanics; it reflects fear, uncertainty, and the sudden collapse of market confidence in stability.
post-image
post-image
  • Reward
  • 7
  • Repost
  • Share
ShainingMoon:
To The Moon 🌕
View More
📢 Gate Square | Apr 20 Discussion: #USIranTensionsShakeMarkets
🚨 Middle East Tensions Spike: Risk-Off Sentiment Hits Markets
On Apr 20, Iran accused the U.S. of attacking its commercial vessel and vowed retaliation, crushing ceasefire hopes. Geopolitical risks surged, triggering risk-off sentiment. BTC fell below $74,000, while WTI crude gapped up 5%.
🎁 Share your insights and 5 winners will split $1,000 trading vouchers!
💬 Discussion:
1️⃣ With ceasefire hopes fading, what’s next for the situation?
2️⃣ WTI jumps—chasing highs or catching opportunity?
3️⃣ BTC breaks $74K—how are you adjust
BTC-0,36%
Gate_Square
📢 Gate Square | Apr 20 Discussion: #USIranTensionsShakeMarkets
🚨 Middle East Tensions Spike: Risk-Off Sentiment Hits Markets
On Apr 20, Iran accused the U.S. of attacking its commercial vessel and vowed retaliation, crushing ceasefire hopes. Geopolitical risks surged, triggering risk-off sentiment. BTC fell below $74,000, while WTI crude gapped up 5%.
🎁 Share your insights and 5 winners will split $1,000 trading vouchers!
💬 Discussion:
1️⃣ With ceasefire hopes fading, what’s next for the situation?
2️⃣ WTI jumps—chasing highs or catching opportunity?
3️⃣ BTC breaks $74K—how are you adjusting your strategy?
Share your thoughts 👉 https://www.gate.com/post
Explore global assets 👉 https://www.gate.com/tradfi
📅 Apr 20 12:00 – Apr 22 18:00 (UTC+8)
repost-content-media
  • Reward
  • 7
  • Repost
  • Share
ShainingMoon:
To The Moon 🌕
View More
WHEN GEOPOLITICS GOES TO WAR WITH YOUR PORTFOLIO
FULL CROSS-ASSET ANALYSIS | APRIL 20, 2026
╔══════════════════════════════════════════════════════════╗
║ 🛢 BRENT CRUDE → $101–$104 ▲ WAR PREMIUM ║
║ 🥇 GOLD → $4,800 ▲ +10% YTD ║
║ ₿ BTC → $74,026 ▼ −2.36% ║
║ 😰 FEAR & GREED → 27 / 100 FEAR ZONE ║
║ 📊 VIX → 20.13+ ELEVATED ║
║ 💵 TOTAL MCAP → $2.59T ▼ Shrinking ║
╚══════════════════════════════════════════════════════════╝
◈ 01 — GEOPOLITICA
Falcon_Official
WHEN GEOPOLITICS GOES TO WAR WITH YOUR PORTFOLIO
FULL CROSS-ASSET ANALYSIS | APRIL 20, 2026
╔══════════════════════════════════════════════════════════╗
║ 🛢 BRENT CRUDE → $101–$104 ▲ WAR PREMIUM ║
║ 🥇 GOLD → $4,800 ▲ +10% YTD ║
║ ₿ BTC → $74,026 ▼ −2.36% ║
║ 😰 FEAR & GREED → 27 / 100 FEAR ZONE ║
║ 📊 VIX → 20.13+ ELEVATED ║
║ 💵 TOTAL MCAP → $2.59T ▼ Shrinking ║
╚══════════════════════════════════════════════════════════╝
◈ 01 — GEOPOLITICAL HEADLINES: WHERE THINGS STAND TODAY
The 2026 Iran War remains the single most consequential geopolitical event shaping every global financial market right now. What began on February 28, 2026, when the US and Israel launched coordinated strikes under Operation Epic Fury assassinating Supreme Leader Khamenei and triggering Iran's closure of the Strait of Hormuz has evolved into a complex diplomatic standoff that swings markets on every headline.
📅 FEB 28 → Operation Epic Fury launched. Hormuz CLOSED.
Markets enter sustained risk-off mode.
📅 APR 8 → Pakistan brokers 2-week ceasefire.
Markets rally. Oil crashes 15%. BTC bounces.
📅 APR 12 → Islamabad talks COLLAPSE after 21 hours.
US announces naval blockade on Iran ports.
Oil spikes back above $100. BTC drops.
📅 APR 17 → Iran reopens Hormuz briefly. Markets surge.
$762M in crypto short liquidations triggered.
📅 APR 18 → Iran RECLOSES Hormuz. Rally fully reversed.
$306M in crypto LONG liquidations in 24h.
📅 APR 20 → Ceasefire expires in 2 days. No extension
confirmed. Pakistani delegation still in
Tehran. Second round talks unconfirmed.
Secretary Rubio urges EU sanctions on Iran.
US naval blockade FULLY ENFORCED.
23 vessels intercepted. $400M/day loss to Iran.
The key tension today: the ceasefire expires April 22. There is no confirmed extension. No second peace deal. Iran's parliament speaker declared Hormuz is under full Iranian military control. The US 5th Fleet and USS George H.W. Bush carrier strike group are fully positioned. The military pressure and diplomatic pressure are running simultaneously and markets are caught between both.
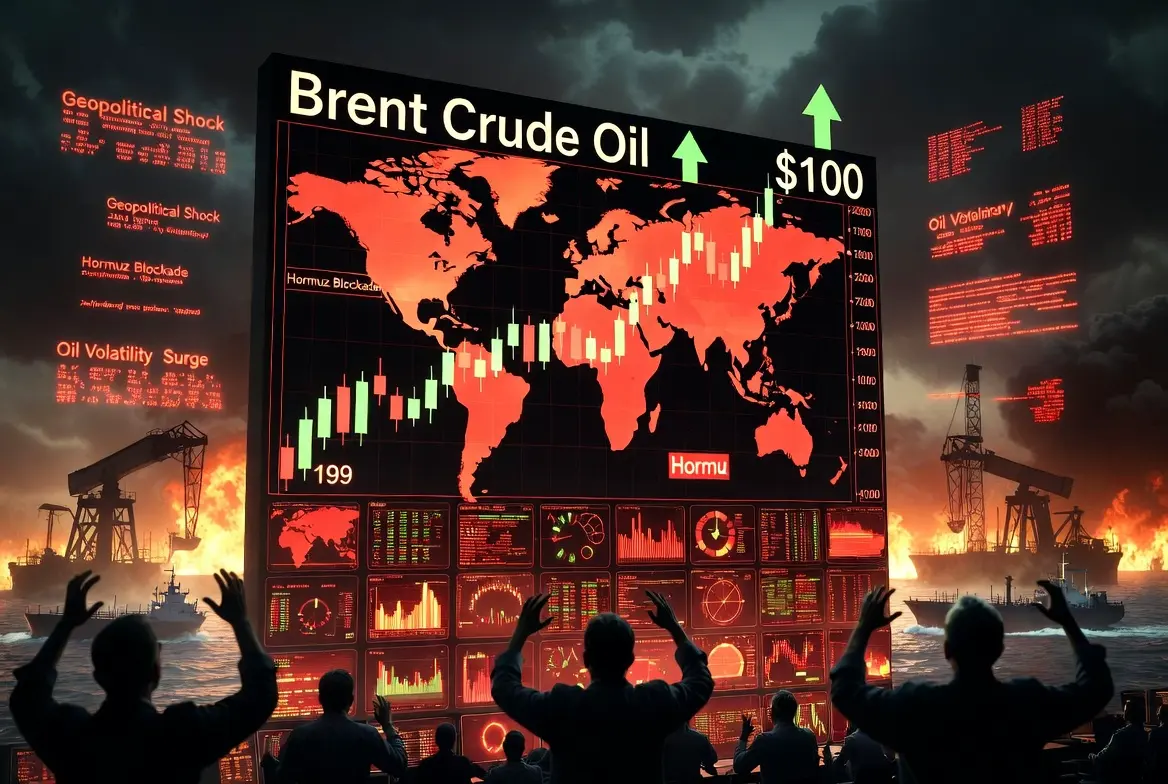
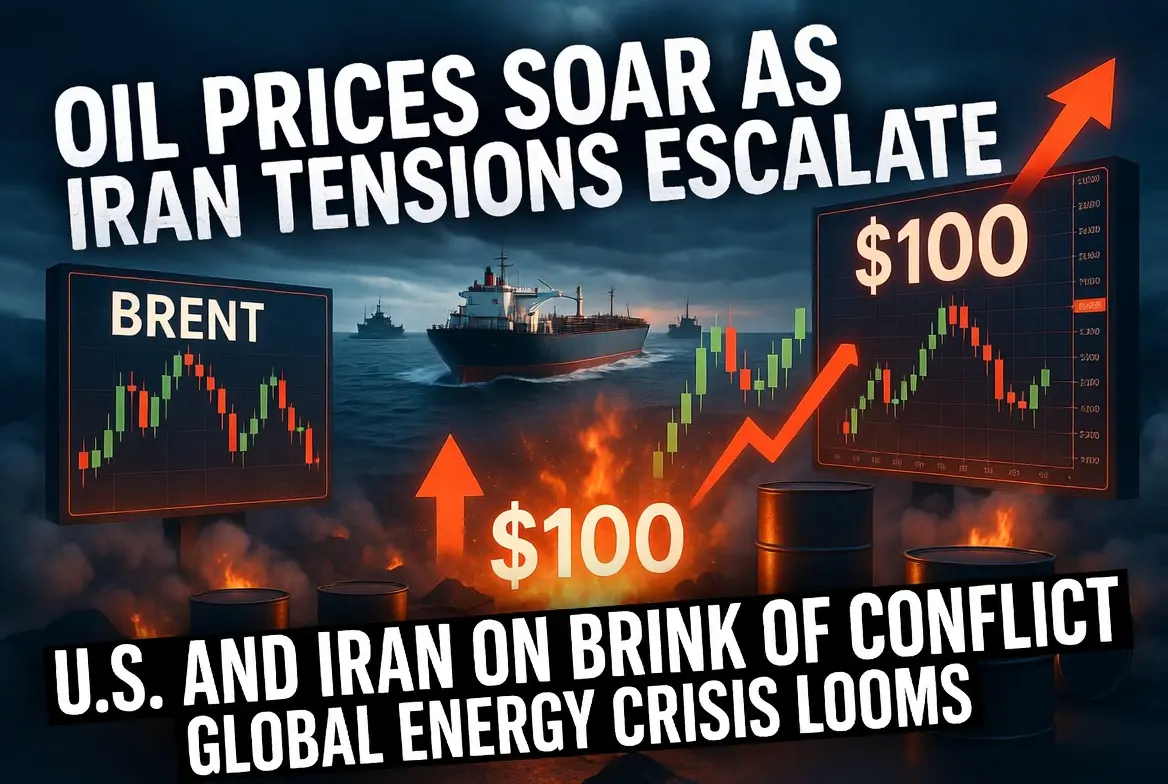
◈ 02 — OIL PRICE: THE FIRST CASUALTY OF EVERY HEADLINE
Oil has been the cleanest and most direct expression of this conflict. Every escalation sends it higher. Every peace signal crashes it. The pattern has repeated six times since February 28.
🛢 PRE-WAR PRICE → ~$70/barrel (Jan 2026)
🛢 WAR OPEN (Mar 2) → Brent +13% → $82/barrel (single session)
🛢 PEAK WAR PRICE → $126/barrel (March 2026 peak)
🛢 CEASEFIRE DROP → Brent −15% to sub-$90 (April 8)
🛢 POST-COLLAPSE → WTI $104.23 / Brent $101.82 (April 13)
🛢 CURRENT (APR 20) → ~$95-$101 range — WAR PREMIUM INTACT
📊 EIA ESTIMATE → 7.5M bpd production outage in March
Rising to 9.1M bpd in April
🚢 HORMUZ IMPACT → 20% of global seaborne oil disrupted
⛽ US GASOLINE → $4+ per gallon — highest since 2023
🌍 LNG ASIA SPIKE → +140% since conflict began
🧪 FERTILIZER RISK → 30% of global urea exports disrupted
The current oil price around $95 to $101 reflects a structural war premium that will not disappear until a genuine, verified peace agreement is reached. Every fake ceasefire has been followed by a reversal. The market has learned to be skeptical of every peace headline until Hormuz stays open for more than 48 hours.
◈ 03 — GOLD: THE ULTIMATE SAFE HAVEN IS WINNING THIS CYCLE
Gold has been the clearest winner of the entire 2026 geopolitical shock though its path has been volatile.
🥇 JAN 29 ATH → $5,594.82/oz — All-Time High
🥇 WAR SURGE → $5,100 → $5,390 in single session (Mar 2)
🥇 CEASEFIRE DIP → Pulled back to ~$4,643 (April 13 low)
🥇 RECOVERY → $4,800/oz — +10% YTD (April 15)
🥇 CURRENT → ~$4,800 — holding above key support
🏦 J.P. MORGAN TARGET → $6,300/oz by year-end 2026
🏦 DEUTSCHE BANK TARGET → $6,000/oz by year-end 2026
🏛️ CENTRAL BANKS → Net buyers for 23 consecutive months
💰 WGC Q3 2025 DEMAND → Record 1,313 tonnes — strongest EVER
Gold is not failing as a safe haven. It is being priced against two competing forces simultaneously safe haven demand pulling it up, and a stronger dollar plus delayed rate cuts pushing it down. When the Iran war fully resolves, the safe haven pressure removes and the rate cut narrative returns, setting up gold for its next leg higher. J.P. Morgan's $6,300 year-end target reflects exactly this thesis.
◈ 04 — CRYPTO: RISK ASSET REALITY CHECK
The 2026 Iran War ended the myth that Bitcoin is "digital gold" during a geopolitical crisis. The data proved Bitcoin is a high-beta risk asset it crashes with equities when fear spikes and rallies with equities when fear eases.
₿ JAN 31 PRICE → $78,719 (pre-conflict high)
₿ FEB 5 CRASH → $63,295 — 20% decline in days
₿ APR 8 BOUNCE → Recovered above $71,000 on ceasefire
₿ APR 18 SHORT SQ → $74K → $78K / $762M SHORT liquidations
₿ APR 20 CURRENT → $74,026 — −2.36% (24H)
💥 LONG LIQUIDATIONS → $248.78M (81% of total)
💥 SHORT LIQUIDATIONS → $58.04M (19% of total)
💥 TOTAL 24H LIQD → $306.82M across 105,374 accounts
📊 BTC DOMINANCE → 57.4% — Rising = Altcoin underperformance
📉 ETH vs BTC → ETH/BTC at 0.0308 — year-to-date low
🏦 ETF WEEKLY INFLOWS → ~$1 Billion — 3-month high
Institutions buying. Retail selling.
The only structural bullish signal inside this dip is institutional behavior. Bitcoin spot ETFs absorbed nearly $1 billion in weekly inflows the strongest performance in over three months even as retail sentiment deteriorated. Whales net-bought 270,000 BTC over 30 days. Exchange reserves sit at 7-year lows. The smart money is not selling. The nervous money is.
◈ 05 — STOCK MARKETS AND VIX
📈 S&P 500 → Recovered to record highs after ceasefire
Two-week recovery erased all war losses
Now re-entering pressure zone post-Hormuz
📉 NASDAQ → Same pattern — recovered, now re-testing
⚡ VIX → Dropped to 20.13 on ceasefire (pre-war low)
Now rising again as ceasefire expires
Elevated above 20 = institutional hedging active
🛡️ DEFENSE STOCKS → Outperformed throughout entire conflict
⛽ ENERGY STOCKS → Surged with oil — now profit-taking zone
🏦 TREASURY YIELDS → 10Y at 4.253% — fell on ceasefire relief
Rising again as rate cut hopes fade
Fed FOMC April 29 — hold expected
◈ 06 — RISK SENTIMENT DASHBOARD
┌──────────────────────────────────────────────────┐
│ FEAR & GREED INDEX → 27 / 100 FEAR │
│ VIX LEVEL → 20.13+ ELEVATED │
│ BTC FUNDING RATES → NEGATIVE BEARISH │
│ ETH FUNDING RATES → NEGATIVE BEARISH │
│ OPEN INTEREST (BTC) → DECLINING DE-LEVERING │
│ WHALE ACTIVITY → BUYING BULLISH │
│ ETF FLOWS → +$1B WEEK BULLISH │
│ RETAIL SENTIMENT → FEARFUL BEARISH │
│ DOLLAR STRENGTH → STRONG PRESSURE │
└──────────────────────────────────────────────────┘
The VIX at 20.13+ signals institutional investors are actively hedging they are not fully in risk-off mode, but they are not removing protection either. "Relief and hedging can coexist" is the dominant strategy across Wall Street right now tactical risk exposure on bullish days, defensive positioning maintained as a baseline.
◈ 07 — SCENARIO OUTLOOK: ESCALATION VS DE-ESCALATION
🔴 ESCALATION SCENARIO (35% probability)
━━━━━━━━━━━━━━━━━━━━━━━━━━━━━━━━━━━━━━━━
Ceasefire expires April 22 without extension
US-Iran conflict resumes active hostilities
Hormuz fully closed oil toward $120-$130
BTC tests $68,000-$65,000 support
Gold surges toward $5,200-$5,500
VIX spikes above 30 full risk-off mode
S&P 500 drops 5-8% in days
Fed rate cuts pushed to 2027
🟢 DE-ESCALATION SCENARIO (65% probability)
━━━━━━━━━━━━━━━━━━━━━━━━━━━━━━━━━━━━━━━━
Second Islamabad talks succeed before April 22
Ceasefire extended Hormuz reopens
Oil crashes back below $90
BTC short squeeze toward $80,000-$83,843
Gold consolidates at $4,800-$5,000
VIX drops back to 17-18
Crypto Fear & Greed bounces toward 45
Rate cut narrative returns for Q3/Q4 2026
◈ FINAL VERDICT
━━━━━━━━━━━━━━━━━━━━━━━━━━━━━━━━━━━━━━━━━━━━━
VERDICT: TEMPORARY VOLATILITY — NOT A MAJOR
RISK-OFF CYCLE BEGINNING
━━━━━━━━━━━━━━━━━━━━━━━━━━━━━━━━━━━━━━━━━━━━━
The structural data does not support a major new risk-off cycle beginning today. Institutions are buying Bitcoin at $1B weekly ETF inflow pace. Whales accumulated 270,000 BTC in 30 days. Gold's year-end targets remain $6,000-$6,300. Central banks have been net gold buyers for 23 consecutive months. The underlying bid under risk assets is real and institutional.
What IS happening is geopolitical volatility amplifying normal market mechanics into sharper, faster swings. Every Iran headline moves markets 2-4% in hours. That volatility is not a structural bear market it is the price of trading in a world where war news has become the primary market catalyst.
The next 48 hours around the ceasefire expiry on April 22 will define the trajectory for the rest of April and potentially May. A peace deal triggers a relief rally across all risk assets simultaneously. A breakdown triggers a cascade that the structural bids will eventually absorb but not before significant short-term pain.
Position for volatility. Wait for clarity. The data says this market is not broken. It is just geopolitically confused.
#Gate13周年现场直击
#Gate13周年
#CreatorCarvinal
#USIranTensionsShakeMarkets
repost-content-media
  • Reward
  • 9
  • Repost
  • Share
ShainingMoon:
To The Moon 🌕
View More
#USIranTensionsShakeMarkets
Market Turmoil Deep Analysis - Where Do We Go From Here?
I. The Geopolitical Flashpoint: From Ceasefire Hopes to Escalation Reality
The Middle East situation took a dramatic turn on April 20, 2026, when Iran accused the United States of firing on its merchant vessels and vowed retaliation. What began as tentative ceasefire expectations quickly evaporated into a renewed crisis that has sent shockwaves through global markets. The Strait of Hormuz, through which approximately 20% of global oil flows, has become a flashpoint once again as Iran reversed its decision to
BTC-0,36%
ETH-0,92%
Luna_Star
#USIranTensionsShakeMarkets
Market Turmoil Deep Analysis - Where Do We Go From Here?
I. The Geopolitical Flashpoint: From Ceasefire Hopes to Escalation Reality
The Middle East situation took a dramatic turn on April 20, 2026, when Iran accused the United States of firing on its merchant vessels and vowed retaliation. What began as tentative ceasefire expectations quickly evaporated into a renewed crisis that has sent shockwaves through global markets. The Strait of Hormuz, through which approximately 20% of global oil flows, has become a flashpoint once again as Iran reversed its decision to reopen the critical waterway following threats of US naval blockade continuation.
President Trump's announcement that the US Navy blockade of Iranian ports remains in effect has intensified the standoff. American forces reportedly seized an Iranian-flagged cargo ship attempting to bypass the blockade in the Gulf of Oman - the first such seizure since the blockade went into effect. This marks a significant escalation in the ongoing conflict that began on February 28, 2026, transforming what was hoped to be a de-escalation into a potential prolonged confrontation.
**II. Oil Markets: The Supply Shock Premium**
WTI crude oil has experienced a dramatic gap-up opening, surging over 5% as traders price in the risk of major supply disruptions. The psychological $80 per barrel level has been breached for the first time since 2024, with some analysts warning that prices could spike significantly higher if the Strait of Hormuz remains closed for an extended period.
The market is caught between two competing narratives: the immediate supply shock premium versus the potential for diplomatic resolution. Energy Secretary Chris Wright has indicated that US gasoline prices, currently hovering around $4.05 per gallon after reaching $4.16 earlier this month, may not return to pre-conflict levels under $3 until next year. This inflationary pressure has immediate implications for consumer spending and central bank policy decisions globally.
For traders contemplating whether to chase the rally or wait for a pullback, the answer lies in monitoring diplomatic channels. Reports suggest US representatives are heading to Pakistan for what are being described as "last-chance" talks. Any breakthrough could trigger a rapid unwind of the risk premium, potentially sending oil prices tumbling toward $60 per barrel. Conversely, further escalation or actual military confrontation could drive prices substantially higher.
**III. Bitcoin and Crypto: The Digital Gold Thesis Tested**
Bitcoin's price action has been particularly revealing during this crisis. After dipping below the $74,000 level under initial selling pressure, BTC has demonstrated remarkable resilience as a hedge asset. The cryptocurrency has traded in a volatile range between approximately $63,000 and $78,000, with weekend escalations triggering significant liquidations exceeding $300 million.
Several factors are supporting Bitcoin's hedge narrative during this geopolitical turmoil:
First, institutional adoption continues unabated. Recent data shows Bitcoin ETF inflows reaching $663.9 million in a single day - the largest daily inflow of 2026. Major financial institutions including Charles Schwab and Morgan Stanley have launched or expanded their cryptocurrency trading services, with Schwab announcing just 0.75% fees for Bitcoin purchases and Morgan Stanley's spot Bitcoin ETF attracting over $100 million in its first week.
Second, corporate treasury adoption remains strong. MicroStrategy, under CEO Michael Saylor, continues aggressive accumulation with holdings approaching 800,000 BTC. Tether has also been actively adding to its Bitcoin reserves, recently transferring 951 BTC worth approximately $70.5 million to its treasury.
Third, the "digital gold" narrative is gaining traction as traditional safe havens face their own challenges. While gold has rallied 18% from its March lows to trade around $4,824, Bitcoin offers 24/7 liquidity and portability that physical gold cannot match - particularly relevant when geopolitical events unfold over weekends when traditional markets are closed.
**IV. Technical Analysis: Key Levels to Watch**
From a technical perspective, Bitcoin is displaying mixed signals. The 4-hour timeframe shows CCI and WR indicators in oversold territory, suggesting potential for a bounce. However, the price has broken below the 15-minute MA20, indicating short-term weakness. The RSI divergence on the daily timeframe suggests that selling pressure may be exhausting, though the overall trend remains vulnerable to macro headlines.
Critical support levels to monitor include the $72,000-$74,000 range, which has served as a consolidation zone. A sustained break below this area could open the door to a retest of $65,000 or lower. On the upside, resistance is expected around $78,000-$80,000, with a breakout above this zone potentially accelerating the rally toward new highs if geopolitical tensions ease.
**V. Strategic Adjustments for Volatile Markets**
For traders navigating this environment, several strategies merit consideration:
**Risk Management:** Position sizing becomes paramount during periods of elevated volatility. The VIX-equivalent fear and greed index for crypto currently reads 29, indicating elevated fear that often precedes market bottoms. Consider reducing overall exposure or implementing hedges through options strategies.
**Diversification:** While Bitcoin has shown resilience, altcoins like Ethereum have underperformed, with ETH down 2.6% versus BTC's 1.6% decline over 24 hours. The ETH/BTC ratio continues to face pressure amid concerns about DeFi protocol security following recent exploits.
**Event-Driven Trading:** Monitor diplomatic developments closely. Any announcement of US-Iran talks or de-escalation could trigger rapid risk-on flows. Conversely, reports of military action or further vessel seizures could drive safe-haven buying in both gold and Bitcoin while crushing risk assets.
**Dollar-Cost Averaging:** For long-term investors, the current volatility presents accumulation opportunities. The confluence of institutional adoption, corporate treasury demand, and Bitcoin's emerging role as a geopolitical hedge suggests that pullbacks may be temporary.
**VI. The Week Ahead: Critical Dates**
Wednesday represents a pivotal moment as diplomatic efforts may yield clarity on the conflict's trajectory. Traders should watch for:
- Updates on US-Pakistan-Iran negotiations
- Any announcements regarding Strait of Hormuz reopening
- Federal Reserve commentary on inflation implications
- Weekend developments (when traditional markets are closed but crypto trades 24/7)
**VII. Conclusion: Navigating Uncertainty**
The US-Iran conflict has created a complex trading environment where geopolitical headlines can override technical patterns in minutes. Bitcoin's ability to hold above $74,000 despite the risk-off sentiment suggests underlying strength in institutional demand. However, the path forward depends heavily on diplomatic developments.
For those considering entry points, the current environment favors patience over FOMO. Oil's 5% gap may offer short-term trading opportunities but carries substantial downside risk if talks succeed. Bitcoin, meanwhile, is testing its digital gold thesis in real-time - and so far, the results are encouraging for believers in cryptocurrency as a geopolitical hedge.
The key is to remain nimble, keep position sizes appropriate for the volatility, and remember that in times of geopolitical crisis, cash and flexibility are often the most valuable assets of all.
repost-content-media
  • Reward
  • 7
  • Repost
  • Share
ShainingMoon:
To The Moon 🌕
View More
#CryptoMarketsDipSlightly
#Gate13thAnniversaryLive
Currently, Bitcoin is showing a controlled pullback, not a crash. Key clues:
1) The decline is not aggressive
* The price is sliding downwards instead of crashing
* There is no excessive increase in volatility
This is a typical indication of profit-taking, not panic selling
2) The structure is still solid (this is very important)
In an uptrend, BTC typically follows:
* Higher highs
* Higher lows
Currently, the price is testing a higher low area, not breaching it.
Until this pattern is broken, the trend is technically still bullish.
3) There
BTC-0,36%
GT-0,13%
ETH-0,92%
ybaser
#CryptoMarketsDipSlightly
#Gate13thAnniversaryLive
Currently, Bitcoin is showing a controlled pullback, not a crash. Key clues:
1) The decline is not aggressive
* The price is sliding downwards instead of crashing
* There is no excessive increase in volatility
This is a typical indication of profit-taking, not panic selling
2) The structure is still solid (this is very important)
In an uptrend, BTC typically follows:
* Higher highs
* Higher lows
Currently, the price is testing a higher low area, not breaching it.
Until this pattern is broken, the trend is technically still bullish.
3) There is no strong “triggering event”
There is no major negative catalyst (exchange failure, major regulatory shock, etc.)
This strongly suggests:
This move is momentum-driven, not structural
So… is this a buying opportunity or a deeper correction?
BUYING OPPORTUNITY SITUATION
* Price remains above recent support zones
* Decline is gradual (not panic-driven)
* Market sentiment shifts from neutral to bullish
This scenario = healthy consolidation before continuation
A DEEPER CORRECTION SITUATION
Note this change:
* Strong red candlestick patterns + increased volume
* Clear break below the support level (daily close)
* Continued selling pressure the next day
This means:
Transition from pullback → trend weakening
Practical levels approach (no need for exact numbers)
Think in zones:
* Upper zone → continuation of momentum (breakouts)
* Middle zone (current area) → decision zone
* Lower zone → danger (trend structure at risk)
Currently:
BTC is in a decision zone, not a danger zone.
This is not acting like the beginning of a collapse.
It behaves like this:
Unless proven otherwise, a pause within an uptrend
BTC Market Map (Current)
1. Upper Zone (Ongoing)
~76K – 78K
* Previous local peaks / breakout area
* This is where momentum traders are re-entering the scene
If the price accepts above this zone:
* Expansion expected → continuation of the trend
* Targets opening towards 80K+
2. Middle Zone (Decision Area — Current)
~72K – 76K
The price is currently here.
* Wavy structure
* Liquidity outflows likely
* Both sides will get stuck here
This area is not for definitive decisions, but for:
* Confirmation
* Patience
* Reaction
3. Sub-Zone (Invalidation / Risk Zone)
~68K – 70K
* Previous high low zone
* Strong demand zone
If BTC:
* Wicks enter this zone and recover → uptrend
* Closes below (especially on the daily chart) → structural damage
Continuation of the Uptrend
Watch out for:
* Outflow towards below ~72K → rapid recovery
* Strong push towards the range
* Formation of a higher low
Liquidity capture → accumulation → Continuation
Distribution → Decline
Watch out for:
* Weak bounces (lower peaks forming)
* Slow decline (already started 👀)
* Then:
* Expansion towards below ~70K Movement
Exit from Liquidity → Breakout
Trading Plans (Net + Applicable)
Safer (Confirmation Trade)
* Entry: Breakout and hold above 76K
* Stop: Below 73.5K
* Target: 80K → 83K
You're not guessing, you're trading with force
Dispersive Buy (Requires Higher Skill)
* Entry: 69K – 71K region
* Only if:
* Strong reaction/rejection candles
* Stop: Below 67K
* Target: Retracement to 75,000 → 78,000
This is where "smart money" typically comes into play
Breakout Trade
* Entry: Daily close below 70,000
* Stop: Above 72,000
* Target: 65,000 → 62,000
This, This confirms the weakening of the structure.
The Most Important Fact Here
Right now:
You're not at the front of the train
You're not at a clear bottom
You're in a trap zone
* Aggressive investors → assess reactions
* Conservative investors → wait for confirmation
Conclusion
This looks like a controlled pullback
But it's one step away from turning into something deeper
So the real thought is:
"Bullish expectation... but only if buyers prove it."
Liquidity Map (Locations of Stop Orders)
Consider not only the levels, but also the problem areas.
Above Price (Liquidity Targets Upward)
~76K – 78K
* Equal peaks / previous rejection zone
* Breakout traders' entries + short stops
What happens here:
* Price usually forms an upward wick → traps long positions → pulls back
* Or a clean breakout → quick squeeze
Below Price (Liquidity Targets Downward)
~71K – 70K
* Recent higher lows
* Clearly "drop-buying" entries
* Clustered stop losses
What happens here:
* High probability:
* Stop sweep (quick clearing)
* Then either:
* Immediate recovery (bullish)
* Or continuation (bearish slippage)
High Probability False Breakout Zones
These are trap zones, not breakout zones.
False Breakout (Upward Trap)
Region: 76K – 78K
Watchout:
* Breakout above resistance
* Low volume follow-through
* Rapid return to the range
Trading Idea:
* Take advantage of the failed breakout with a short position
* Target: mid-range (~73–74K)
False Drop (Downward Trap)
Region: 70K – 71K
Watchout:
* Sharp drop below support
* Long wicks (absorption)
* Rapid recovery
Trading Idea:
* Take advantage of the recovery with a long position
* Target: 74K → 76K
Intraday Setups (4-Hour / 1-Hour Application)
Now we're getting more sensitive.
Liquidity Sweep Long Position (High Probability)
Context: Price falls to 70-71kJ
Entry Trigger (1-hour chart):
* Sweep below the support level
* Strong bullish candle close above the level
Entry: After recovery
Stop: Below the sweep low
Target:
* 73.5K
* 75-76K
This is a classic scenario:
“Stop hunt → reversal”
Lower Peak Short Position (Trend Weakening)
Context: Price fails to recover the 75-76kJ level
Entry Trigger:
* Bounce → forming a lower peak
* Formation of a bearish engulfing pattern on the 1-hour chart
Entry: At the moment of rejection
Stop: Above the lower peak
Target:
* 72K
* Then 70K liquidity
This implies: Catches:
Distribution before the breakout
Breakout Retest (Momentum Game)
Context: Clean breakout above 76K
Entry Trigger:
* Breakout + hold
* Retracement to 76K (support reversal)
Entry: Successful retest
Stop: Below 75K
Target:
* 79K
* 82K
This prevents false breakouts and trades on confirmed strength
Trading Rules (This is the Most Important)
* Do not trade in the middle (72-75K volatility zone)
* Only trade on:
* Edges (liquidity zones)
* Or confirmed breakouts
Currently the market:
Does not show a clean trend
Does not break downwards
Does not break upwards
This means:
This is a rigged market designed to trap both sides
Advantage (Simple but (Strong)
Instead of asking:
“Where is the price going?”
Ask:
“Where are investors going wrong?”
Then trade on that move.
$BTC $GT $ETH
repost-content-media
  • Reward
  • 6
  • Repost
  • Share
ShainingMoon:
To The Moon 🌕
View More
Gate 13th Anniversary Is Live — Share the Million-Dollar Prize Pool!
Want to win more? Here are two easy ways to boost on Gate Square:
1️⃣ Extra Draw: Visit the event page and share it to Gate Square to unlock one additional draw
2️⃣ Message Board Post: Share your wishes with #Gate13thAnniversary—your post will be synced on Square
Win prizes Gate 13th Anniversary gift box, Red Bull model, and high-value trading vouchers!
13 years of growth—thanks for being with us. Share your anniversary wishes on Gate Square now!
👉 https://www.gate.com/zh/activities/13th-anniversary
Details: https://www.gat
Gate_Square
Gate 13th Anniversary Is Live — Share the Million-Dollar Prize Pool!
Want to win more? Here are two easy ways to boost on Gate Square:
1️⃣ Extra Draw: Visit the event page and share it to Gate Square to unlock one additional draw
2️⃣ Message Board Post: Share your wishes with #Gate13thAnniversary—your post will be synced on Square
Win prizes Gate 13th Anniversary gift box, Red Bull model, and high-value trading vouchers!
13 years of growth—thanks for being with us. Share your anniversary wishes on Gate Square now!
👉 https://www.gate.com/zh/activities/13th-anniversary
Details: https://www.gate.com/announcements/article/50694
repost-content-media
  • Reward
  • 5
  • Repost
  • Share
ShainingMoon:
To The Moon 🌕
View More
#AnthropicvsOpenAIHeatsUp
The competition between OpenAI and Anthropic has entered a more intense phase, marking a clear shift from early-stage AI model rivalry to a full-scale ecosystem battle over enterprise adoption, developer control, and long-term AI infrastructure dominance. What was once a technology race centered on model capability has now evolved into a strategic competition involving safety frameworks, API ecosystems, enterprise contracts, and integration into global productivity systems.
OpenAI continues to push aggressively on scaling its model ecosystem, focusing on multimodal i
post-image
[The user has shared his/her trading data. Go to the App to view more.]
  • Reward
  • 2
  • Repost
  • Share
ybaser:
2026 GOGOGO 👊
View More
#SaylorReleasesBitcoinTrackerUpdate
The latest update from Michael Saylor has once again captured the market’s full attention, reinforcing his position as one of the most influential institutional voices in the Bitcoin ecosystem. His Bitcoin Tracker update arrives at a time when the market is navigating a delicate balance between macroeconomic uncertainty and sustained institutional accumulation.
As of today, Bitcoin is trading in a consolidation range around the mid-$70,000 region, reflecting a pause after the aggressive upside momentum seen earlier this quarter. Price action is currently dr
BTC-0,36%
post-image
  • Reward
  • 6
  • Repost
  • Share
SoominStar:
To The Moon 🌕
View More
#RAVECrashes90%
The collapse of RAVE by nearly 90% is not just another altcoin drawdown—it is a clear reminder of how fragile liquidity and sentiment remain in the current crypto market environment as of April 20, 2026.
RAVE’s crash appears to be driven by a combination of low market depth, concentrated holdings, and a sudden wave of sell pressure that the order books simply could not absorb. In thinly traded ecosystems, once key support levels break, price discovery becomes violent and unforgiving. Early signs suggest that a few large wallets or coordinated exits triggered cascading liquidat
RAVE-9,3%
BTC-0,36%
ETH-0,92%
post-image
post-image
  • Reward
  • 6
  • Repost
  • Share
SoominStar:
To The Moon 🌕
View More
#WCTCTradingChallengeShare8MUSDT
WCTC Season 8 Global Trading Competition Officially Opens Registration
Gate 13th Anniversary Main Event
Gate marks its 13th anniversary with the launch of the World Crypto Trading Competition Season 8, bringing together traders from around the globe to compete for a prize pool that can reach up to 8 million USDT. This year's competition introduces multiple competition tracks designed to accommodate different trading styles and experience levels.
Competition Timeline
The event runs in two phases. Pre-registration is open from April 14, 2026 at 16:00 UTC+8 throu
GUSD0,04%
USD1-0,04%
post-image
  • Reward
  • 7
  • 1
  • Share
SoominStar:
To The Moon 🌕
View More
  • Pin