

#AreYouBullishOrBearishToday? $RLS 1. Price & Momentum
· Current price: 0.00415 (+22.42% today, +75.85% in the last 24h).
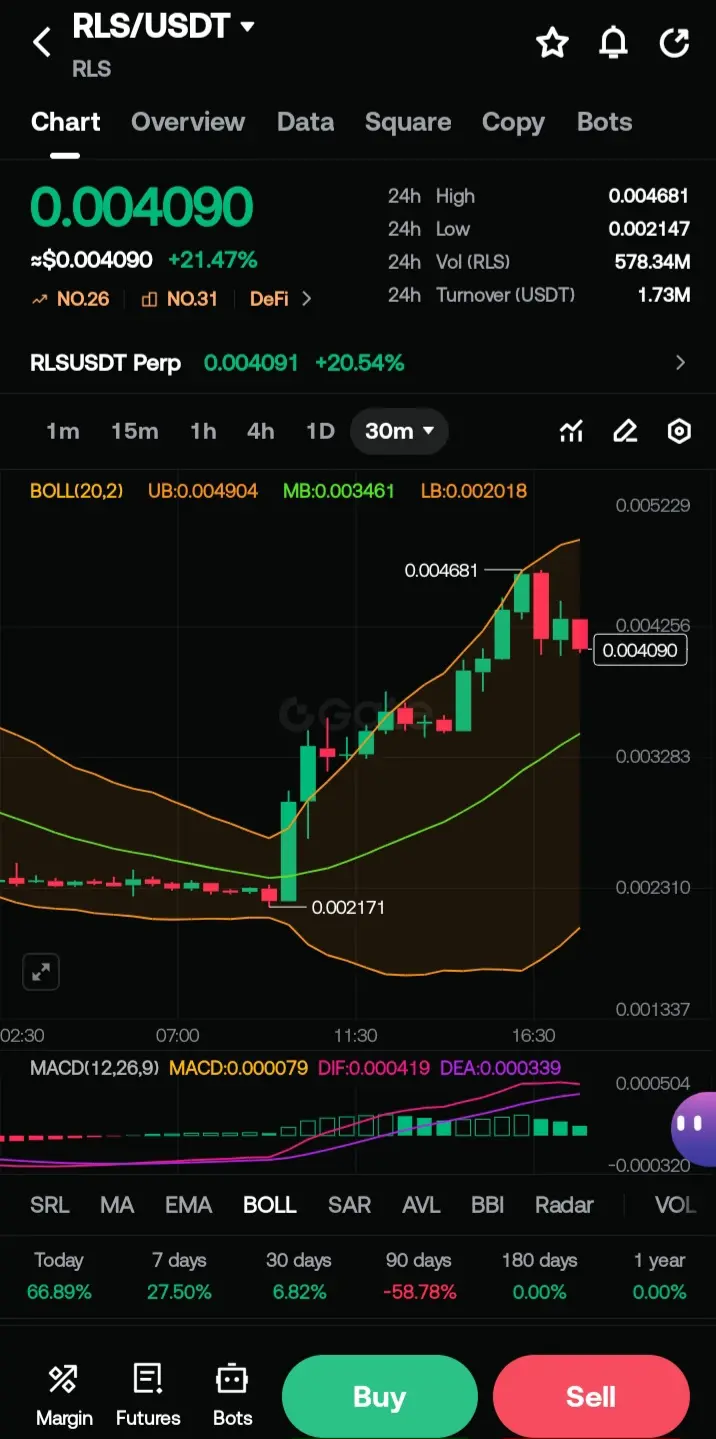
· The 24h range is 0.00216 – 0.00482, showing high volatility.
2. Bollinger Bands (BOLL)
· Price is trading near the upper band (UB: 0.00445), suggesting possible overextension.
· Middle band (basis) is at 0.00298 – price is well above it, indicating strong bullish momentum.
3. Volume
· 24h volume: 724.89M RLS, with 2.27M USDT turnover.
· Current VOL: 22.95M, below MA(5) of 39.29M – buying pressure may be cooling after the spike.
4. Timeframe Performance
· +75.85% (today), +18.91% (7 days), but -62.48% (90 days) → short-term pump within a longer-term downtrend.
5. Key Levels
· Resistance near 0.00482 (24h high).
· Support around 0.00333 and 0.00234 (visible on chart).
· Order book shows ask at 0.00416, bid at 0.00414 – tight spread, but thin depth implied.
Cautious take:
This looks like a sharp short-term rally on low/medium volume relative to earlier spikes. If you’re trading, watch for rejection near 0.00445–0.00482. A break below 0.00333 would weaken the bullish case.
· Current price: 0.00415 (+22.42% today, +75.85% in the last 24h).
· The 24h range is 0.00216 – 0.00482, showing high volatility.
2. Bollinger Bands (BOLL)
· Price is trading near the upper band (UB: 0.00445), suggesting possible overextension.
· Middle band (basis) is at 0.00298 – price is well above it, indicating strong bullish momentum.
3. Volume
· 24h volume: 724.89M RLS, with 2.27M USDT turnover.
· Current VOL: 22.95M, below MA(5) of 39.29M – buying pressure may be cooling after the spike.
4. Timeframe Performance
· +75.85% (today), +18.91% (7 days), but -62.48% (90 days) → short-term pump within a longer-term downtrend.
5. Key Levels
· Resistance near 0.00482 (24h high).
· Support around 0.00333 and 0.00234 (visible on chart).
· Order book shows ask at 0.00416, bid at 0.00414 – tight spread, but thin depth implied.
Cautious take:
This looks like a sharp short-term rally on low/medium volume relative to earlier spikes. If you’re trading, watch for rejection near 0.00445–0.00482. A break below 0.00333 would weaken the bullish case.