#BTCANALYSIS
#Bitcoin (BTC) Market Analysis — Structural Outlook, Liquidity Dynamics & Key Scenarios
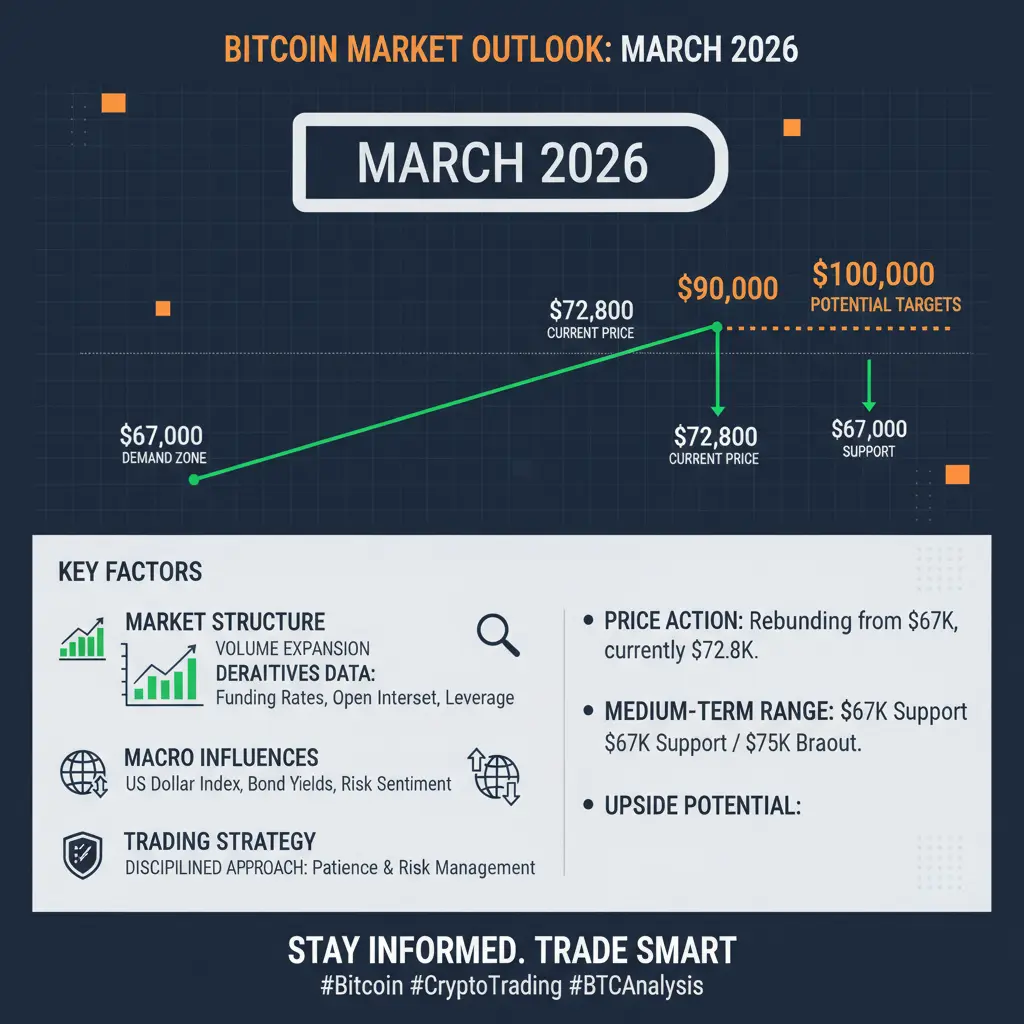
Bitcoin is currently navigating a critical phase where market structure, liquidity conditions, and macro sentiment are interacting to define its next directional move. After a period of strong volatility cycles, BTC is showing signs of consolidation rather than clear trend continuation, suggesting that participants are waiting for a decisive catalyst before committing to larger directional exposure.
At the core of the current structure, Bitcoin is trading within a broad range where both accumulation and distribution behaviors are visible. On higher timeframes, the market still reflects a long-term bullish structure, supported by institutional participation, ETF-driven inflows, and expanding global adoption narratives. However, short-term price action is increasingly reactive, driven by liquidity grabs and leverage resets across derivatives markets.
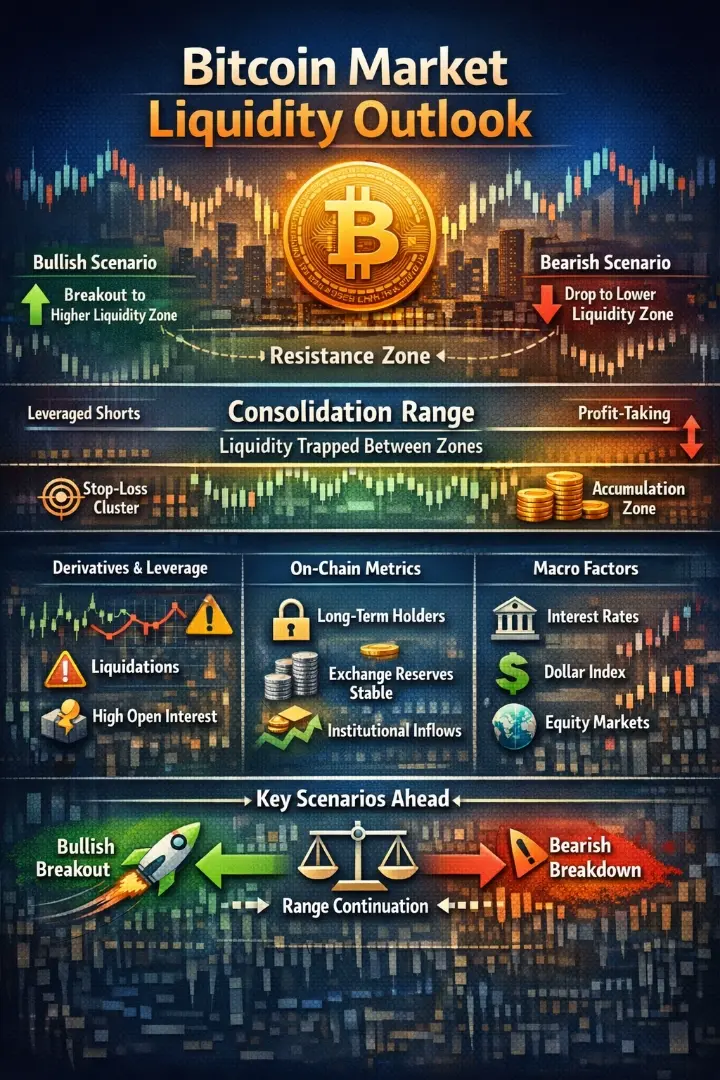
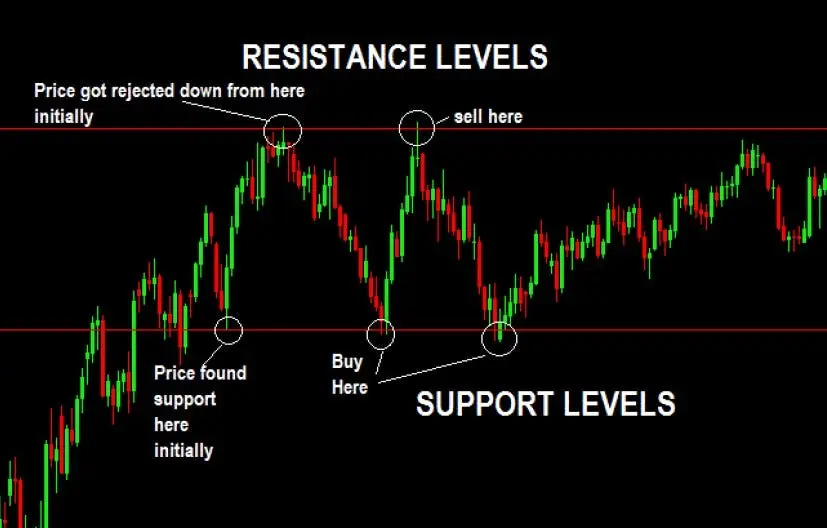
Market Structure Overview BTC continues to respect major support zones established during prior accumulation phases. These regions are repeatedly tested, indicating strong buyer interest, but also revealing absorption of selling pressure rather than clean breakout momentum. Resistance zones above current price levels remain equally important, as multiple rejection events suggest profit-taking and liquidity distribution by larger participants.
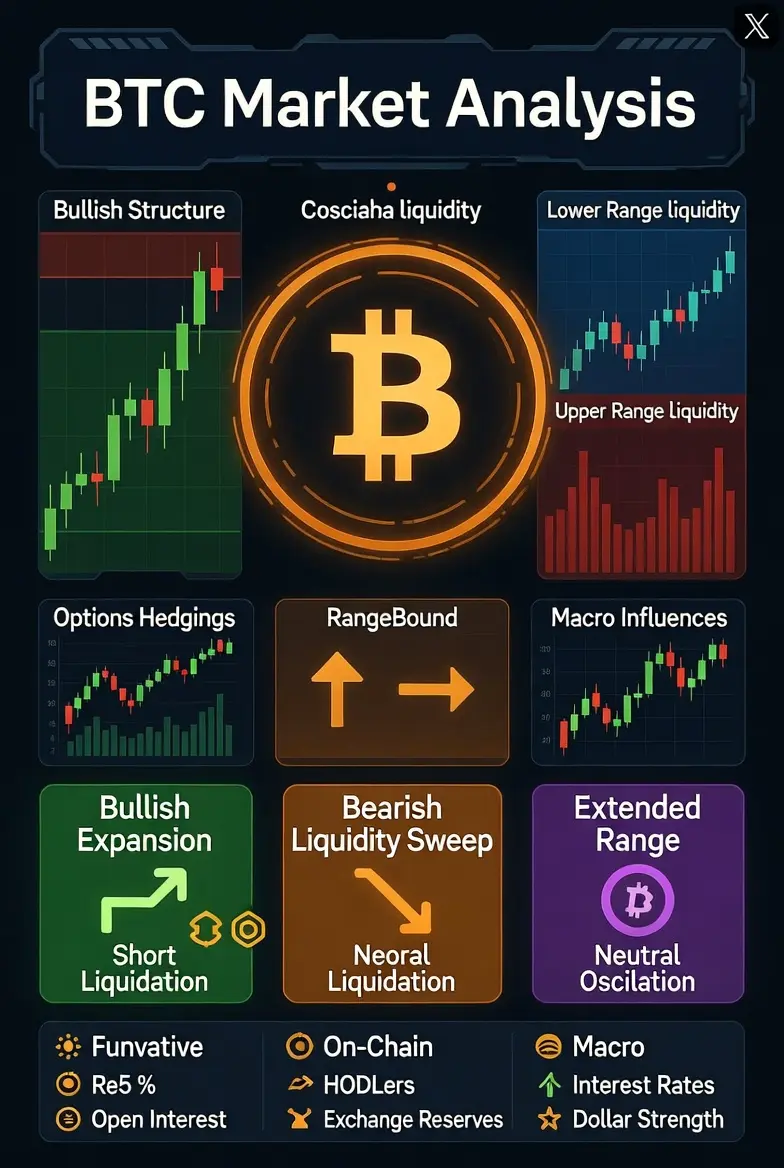
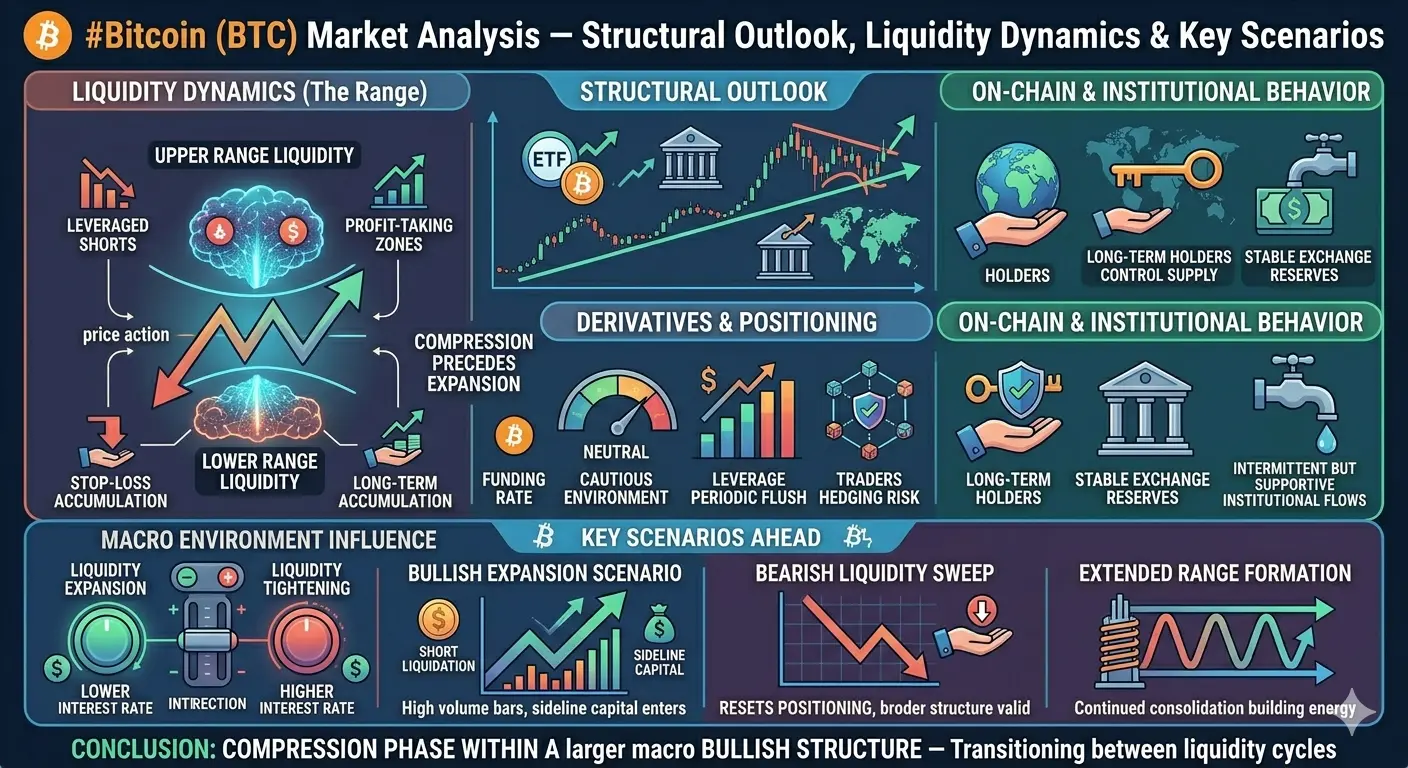
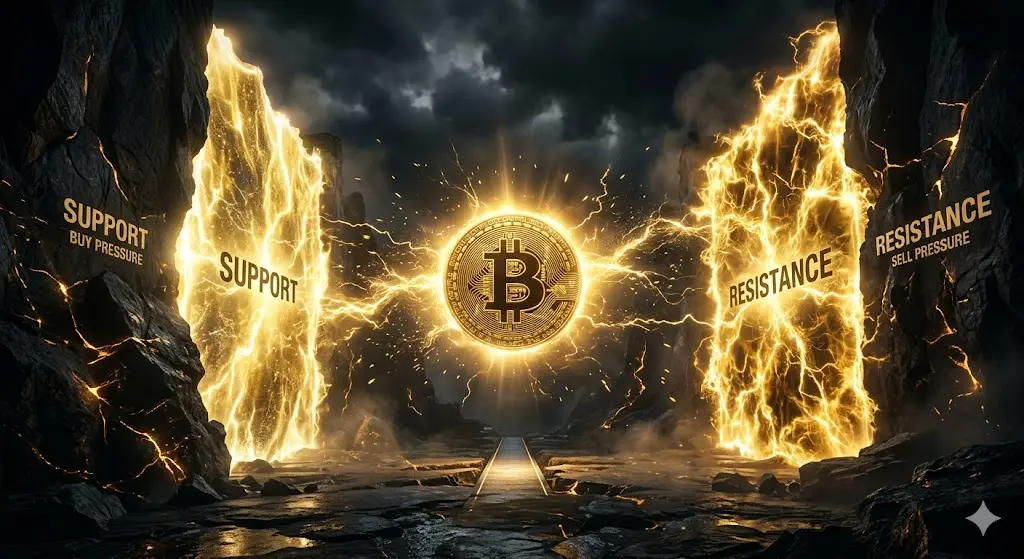
The market is essentially trapped between liquidity clusters:
Lower range liquidity: stop-loss accumulation and long-term accumulation interest
Upper range liquidity: leveraged shorts and profit-taking zones
This compression often precedes expansion, but direction depends on which liquidity side is consumed first.
Derivatives & Leverage Conditions Funding rates and open interest behavior indicate a cautious environment. Excessive leverage has been periodically flushed out, reducing systemic risk but also limiting aggressive upside momentum. Each liquidation event has reset positioning, creating temporary stability but not yet establishing a strong trend continuation phase.
Options market positioning also suggests uncertainty, with traders hedging both downside risk and breakout potential. This dual hedging behavior typically reflects anticipation of volatility expansion rather than directional conviction.
On-Chain & Institutional Behavior On-chain metrics continue to show long-term holders maintaining dominant supply control, with limited distribution from high-conviction wallets. Meanwhile, exchange reserves remain relatively stable, indicating no aggressive sell-side panic.
Institutional flows remain a key variable. Periodic inflows support structural demand, but they are not yet consistent enough to trigger sustained parabolic continuation. This creates a scenario where BTC is fundamentally supported but not aggressively bid in the short term.
Macro Environment Influence Bitcoin remains highly sensitive to macro liquidity conditions, particularly interest rate expectations, dollar strength, and risk-on sentiment across equities. Any shift toward liquidity expansion environments historically benefits BTC, while tightening phases suppress breakout momentum.
Correlation with risk assets remains moderate, meaning BTC is still acting as a hybrid asset—part macro hedge, part risk-on growth instrument.
Key Scenarios Ahead
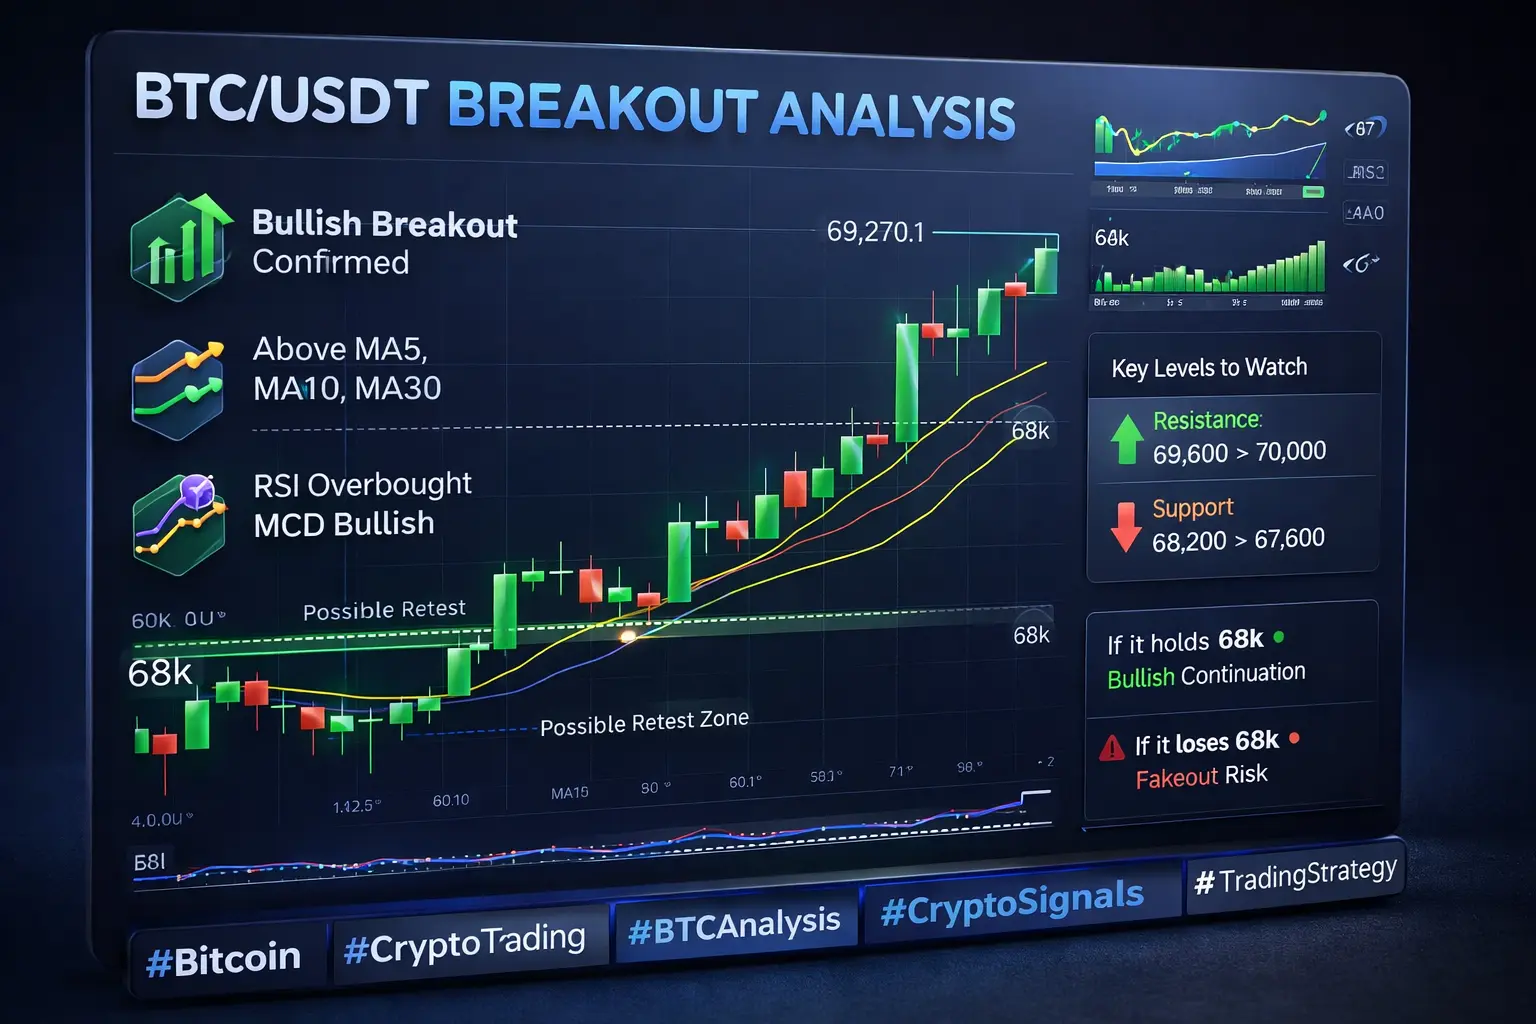
Bullish Expansion Scenario If BTC breaks above the upper liquidity band with volume confirmation, the market could enter a momentum-driven expansion phase. This would likely trigger short liquidations and attract sidelined capital, accelerating trend continuation.
Bearish Liquidity Sweep Failure to hold current support zones could result in a liquidity sweep toward lower accumulation regions. This would not necessarily invalidate the broader bullish structure but would reset positioning and delay upside continuation.
Extended Range Formation The most likely short-term scenario remains continued range-bound behavior, where BTC oscillates between defined liquidity zones while building energy for a larger directional move.
Conclusion Bitcoin is currently in a compression phase within a larger macro bullish structure. The market is not broken, but it is also not trending aggressively. Instead, it is transitioning between liquidity cycles where leverage is being cleaned and positioning is being rebuilt.
The next major move will likely be driven not by gradual momentum, but by a liquidity event that forces directional conviction into the market.
#BTC #Bitcoin
#Bitcoin (BTC) Market Analysis — Structural Outlook, Liquidity Dynamics & Key Scenarios
Bitcoin is currently navigating a critical phase where market structure, liquidity conditions, and macro sentiment are interacting to define its next directional move. After a period of strong volatility cycles, BTC is showing signs of consolidation rather than clear trend continuation, suggesting that participants are waiting for a decisive catalyst before committing to larger directional exposure.
At the core of the current structure, Bitcoin is trading within a broad range where both accumulation and distribution behaviors are visible. On higher timeframes, the market still reflects a long-term bullish structure, supported by institutional participation, ETF-driven inflows, and expanding global adoption narratives. However, short-term price action is increasingly reactive, driven by liquidity grabs and leverage resets across derivatives markets.
Market Structure Overview BTC continues to respect major support zones established during prior accumulation phases. These regions are repeatedly tested, indicating strong buyer interest, but also revealing absorption of selling pressure rather than clean breakout momentum. Resistance zones above current price levels remain equally important, as multiple rejection events suggest profit-taking and liquidity distribution by larger participants.
The market is essentially trapped between liquidity clusters:
Lower range liquidity: stop-loss accumulation and long-term accumulation interest
Upper range liquidity: leveraged shorts and profit-taking zones
This compression often precedes expansion, but direction depends on which liquidity side is consumed first.
Derivatives & Leverage Conditions Funding rates and open interest behavior indicate a cautious environment. Excessive leverage has been periodically flushed out, reducing systemic risk but also limiting aggressive upside momentum. Each liquidation event has reset positioning, creating temporary stability but not yet establishing a strong trend continuation phase.
Options market positioning also suggests uncertainty, with traders hedging both downside risk and breakout potential. This dual hedging behavior typically reflects anticipation of volatility expansion rather than directional conviction.
On-Chain & Institutional Behavior On-chain metrics continue to show long-term holders maintaining dominant supply control, with limited distribution from high-conviction wallets. Meanwhile, exchange reserves remain relatively stable, indicating no aggressive sell-side panic.
Institutional flows remain a key variable. Periodic inflows support structural demand, but they are not yet consistent enough to trigger sustained parabolic continuation. This creates a scenario where BTC is fundamentally supported but not aggressively bid in the short term.
Macro Environment Influence Bitcoin remains highly sensitive to macro liquidity conditions, particularly interest rate expectations, dollar strength, and risk-on sentiment across equities. Any shift toward liquidity expansion environments historically benefits BTC, while tightening phases suppress breakout momentum.
Correlation with risk assets remains moderate, meaning BTC is still acting as a hybrid asset—part macro hedge, part risk-on growth instrument.
Key Scenarios Ahead
Bullish Expansion Scenario If BTC breaks above the upper liquidity band with volume confirmation, the market could enter a momentum-driven expansion phase. This would likely trigger short liquidations and attract sidelined capital, accelerating trend continuation.
Bearish Liquidity Sweep Failure to hold current support zones could result in a liquidity sweep toward lower accumulation regions. This would not necessarily invalidate the broader bullish structure but would reset positioning and delay upside continuation.
Extended Range Formation The most likely short-term scenario remains continued range-bound behavior, where BTC oscillates between defined liquidity zones while building energy for a larger directional move.
Conclusion Bitcoin is currently in a compression phase within a larger macro bullish structure. The market is not broken, but it is also not trending aggressively. Instead, it is transitioning between liquidity cycles where leverage is being cleaned and positioning is being rebuilt.
The next major move will likely be driven not by gradual momentum, but by a liquidity event that forces directional conviction into the market.
#BTC #Bitcoin