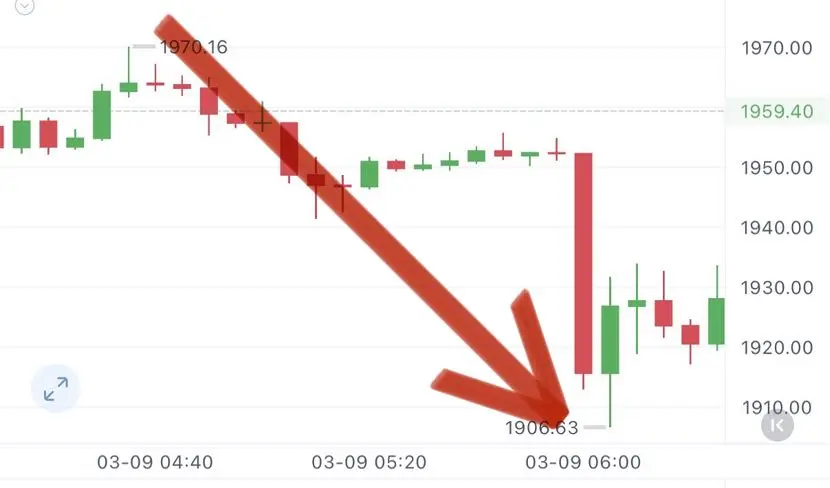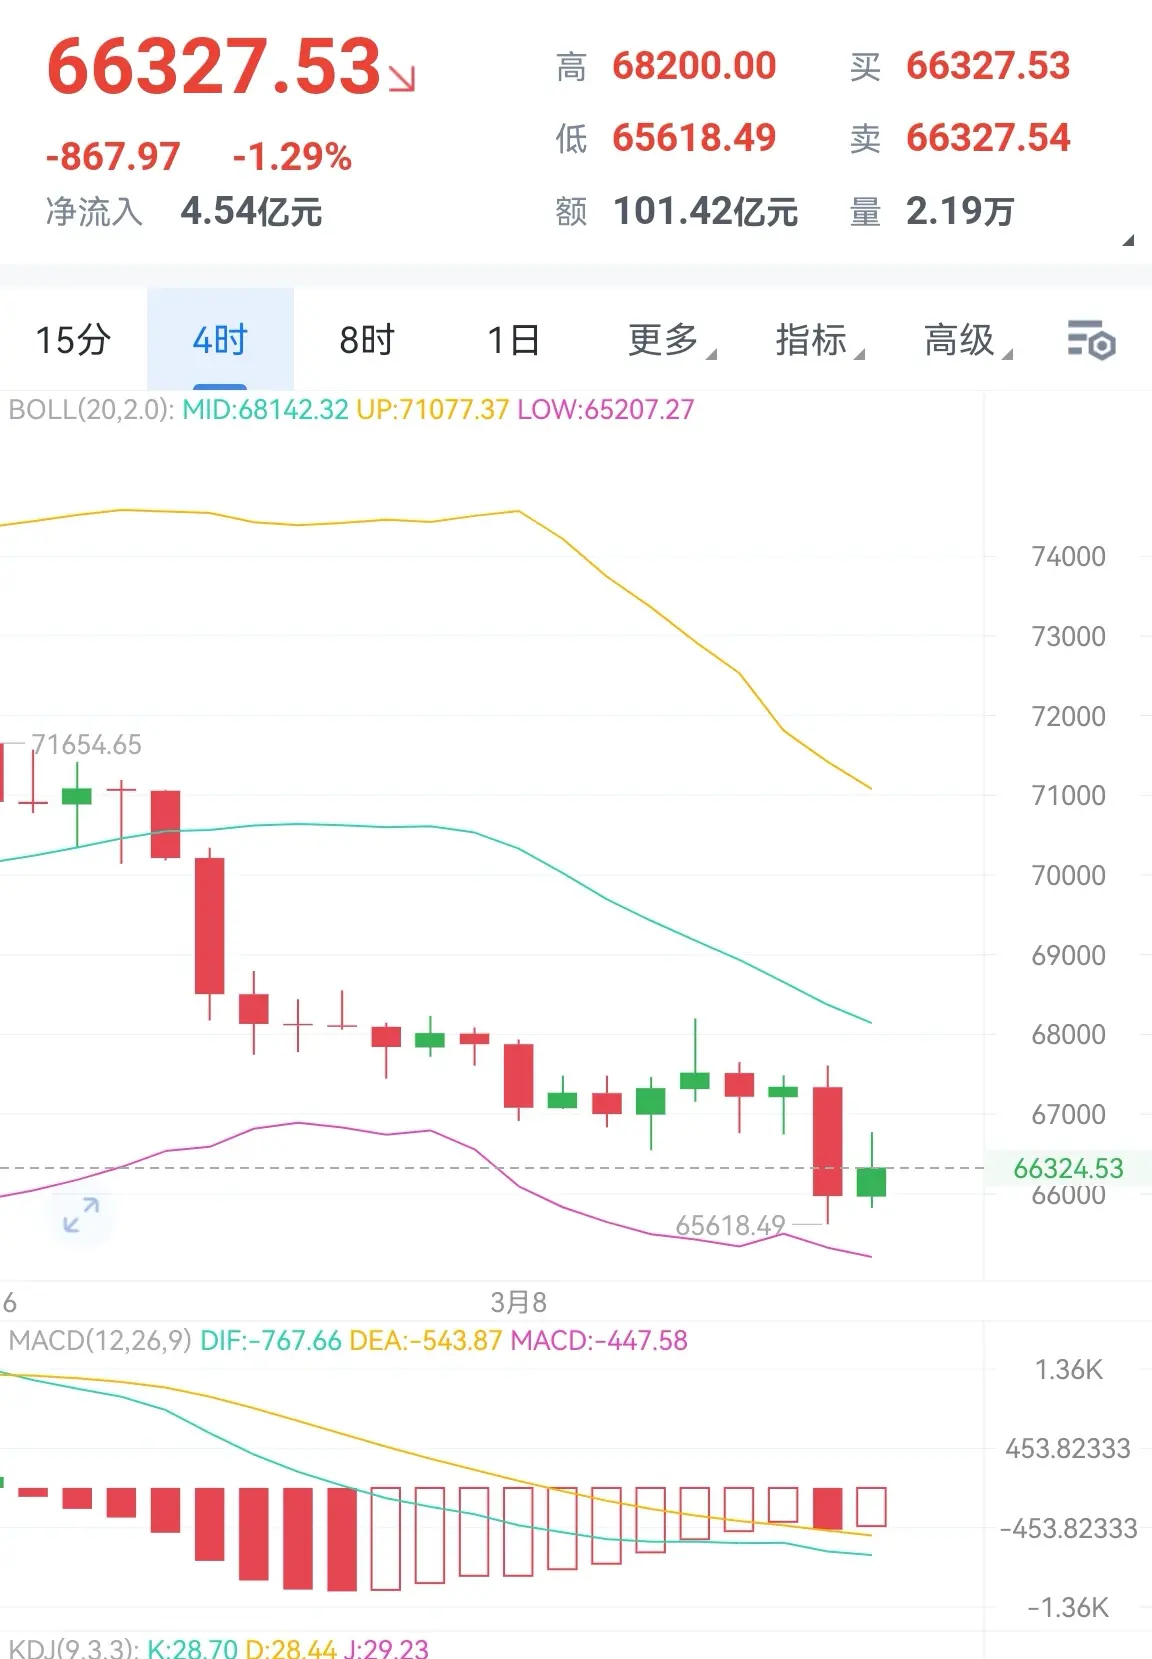


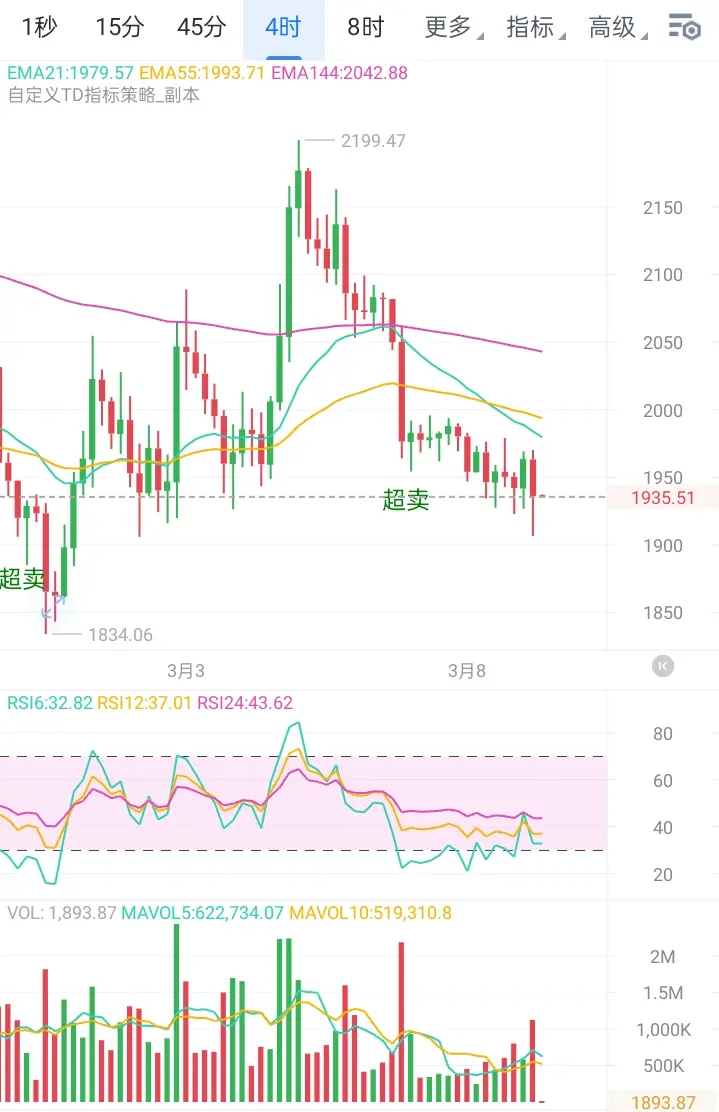
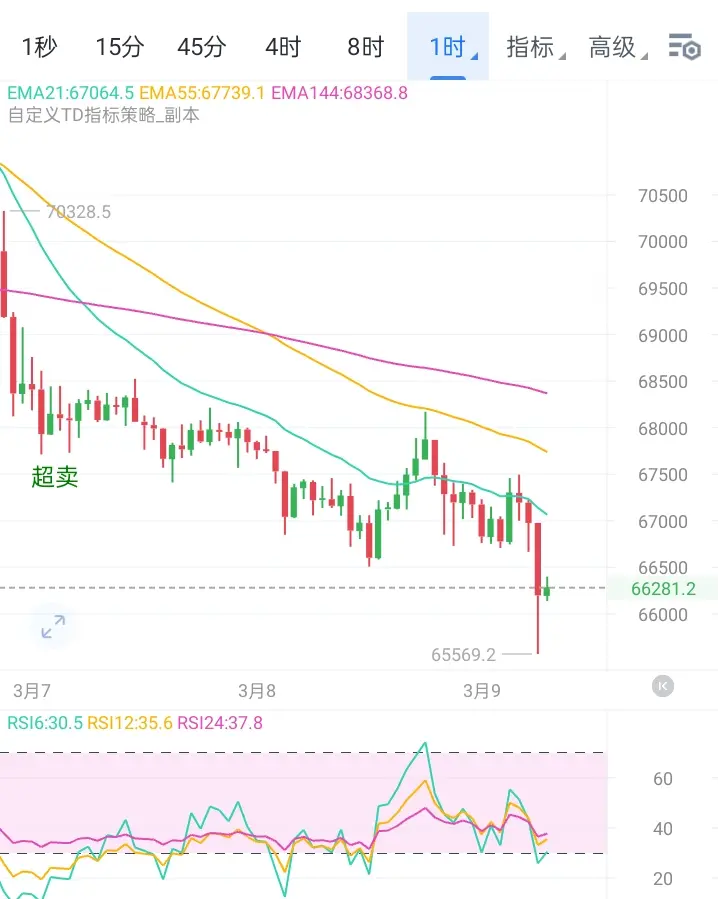
This early morning, Ethereum continued its weakness along with the broader market decline. The bears maintained pressure, and after breaking below the key support level of $1950, the price accelerated downward, with the lowest touching around $1920 before the decline was halted. Subsequently, the market entered a technical correction, currently rebounding to around $1936 and consolidating. Based on the downward momentum from this morning, the bearish force remains strong, and the rebound has not shown significant volume increase, indicating a typical quick drop followed by a rebound correction.
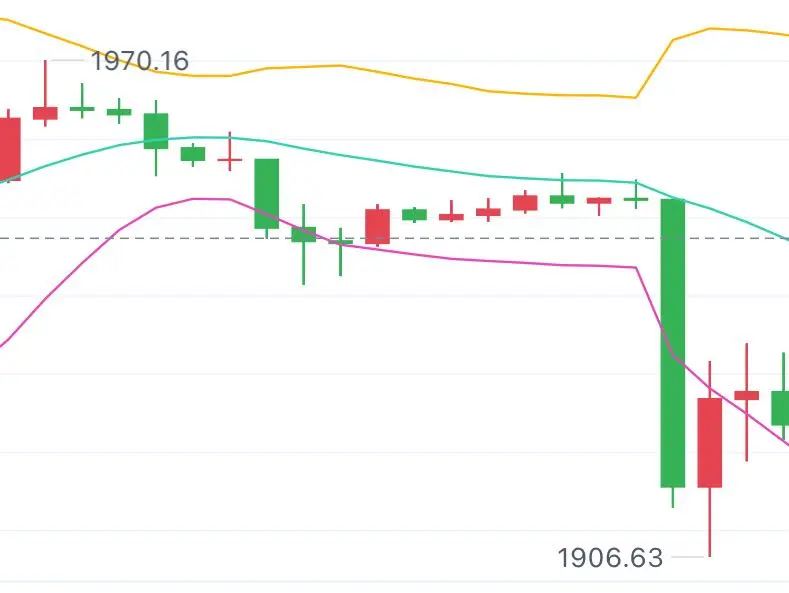
Structurally, the early morning decline effectively broke through the daily support level of $1950, which had been tested multiple times previously and served as a neckline. It has now transformed into a short-term resistance. In terms of candlestick patterns, after consecutive bearish candles on the hourly chart, the rebound candles are mainly small bullish candles or doji stars, indicating weak bullish counterattack intentions. Regarding moving averages, the current price is under pressure from the hourly MA5 and MA10 (in the $1950-1960 range), with short-term moving averages showing a bearish alignment and diverging downward. On the indicators, the MACD fast and slow lines formed a death cross below the zero line and are opening downward, with the bearish momentum histogram continuing to expand, indicating that the correction is not over yet.
Given that the current phase is a weak consolidation in a downtrend, the trading strategy remains to follow the trend for shorting opportunities after rebounds. It is recommended to enter positions in batches around the $1950-1960 area, with a stop-loss above $1980. The initial target below is the early morning low of $1920; if this level is effectively broken, further downside toward the $1900 level can be considered.
Risk reminder: Market volatility is high. This analysis is for reference only. Specific operations should be based on real-time market conditions, and strict risk management should be implemented. #2月非农意外负增长 $ETH