How to Use the Top Reversal Pattern—Head and Shoulders Top
Gate Learn's intermediate futures series helps users build a structured framework for technical analysis, covering candlestick basics, chart patterns, moving averages, and trendlines, as well as technical indicators. In this article, we focus on the top reversal pattern—Head and Shoulders Top, covering its definition, features, application in BTC markets, and key considerations.
What Is a Head and Shoulders Top
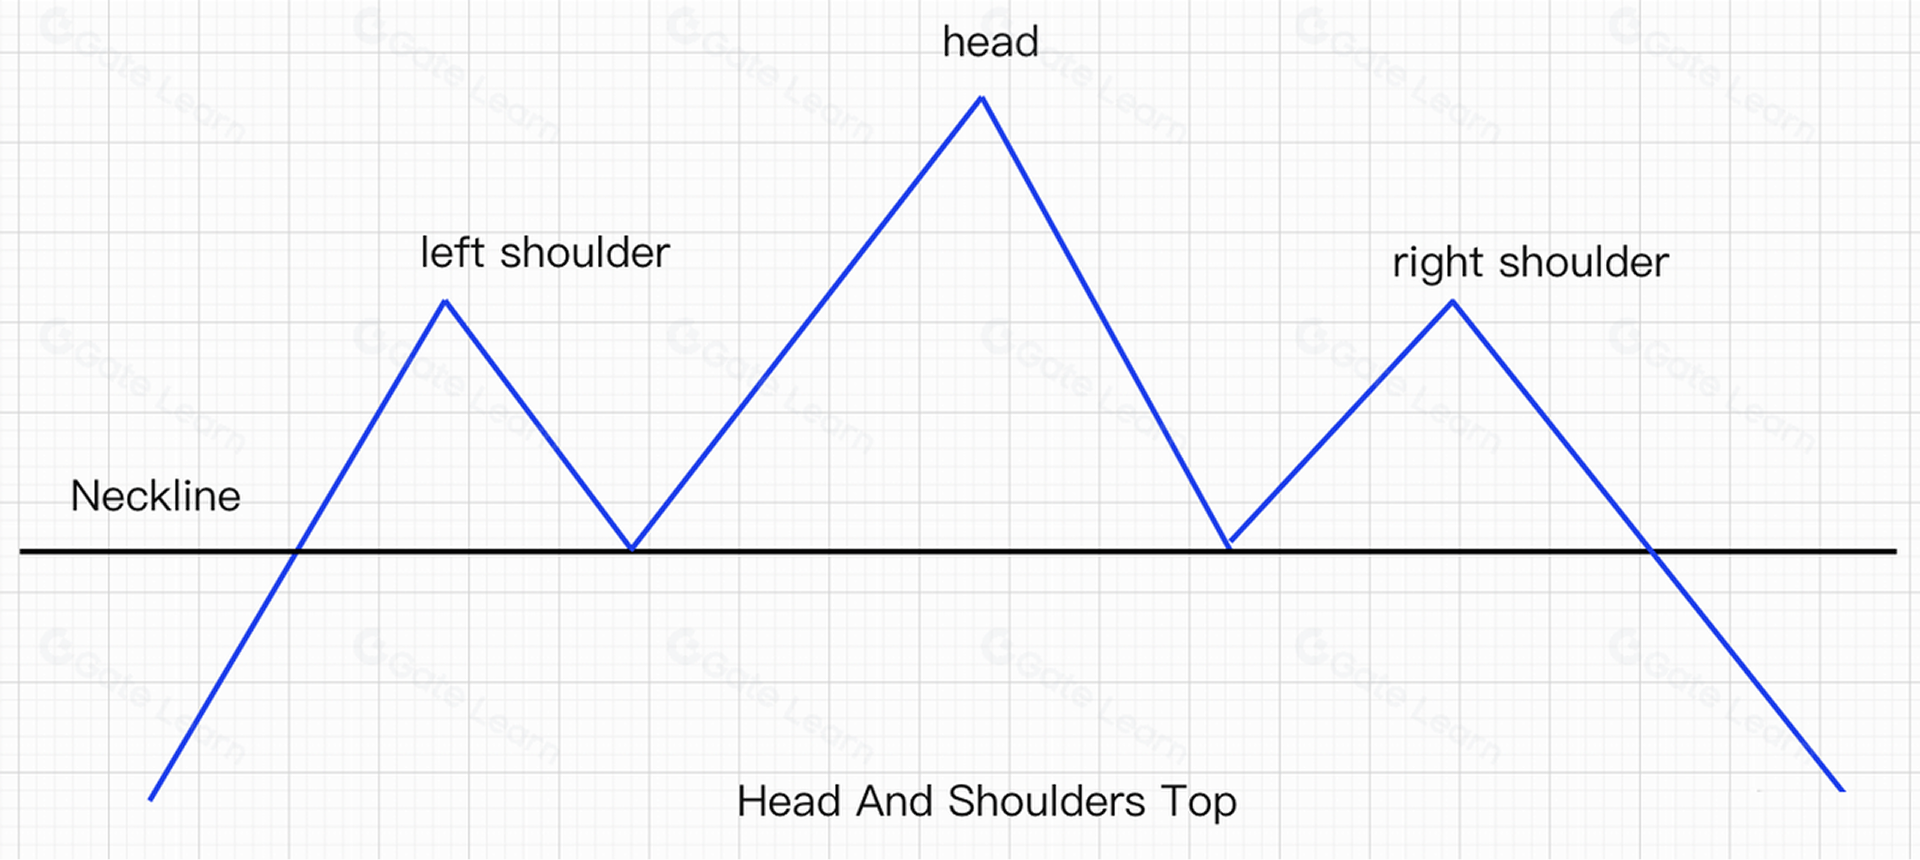
A Head and Shoulders Top forms after a strong price rally and consists of three distinct peaks, with the middle peak higher than the two on either side. From left to right, these peaks are called the left shoulder, head, and right shoulder. Trading volume often shows a step-by-step decline throughout the pattern, as shown below:
How to Identify a Head and Shoulders Top
- It appears in a strong uptrend, with substantial price gains and heavy volume.
- Price makes three rallies, each followed by a pullback. The left and right peaks form at roughly the same height (left shoulder and right shoulder). The middle peak is noticeably higher (the head).
- The two troughs between the left/right shoulder and the head form similar lows; connecting them gives the neckline. When price breaks below the neckline with confirmation, the pattern is established.
- Volume tends to expand on each upswing and contract on each downswing, but overall declines progressively from left shoulder → head → right shoulder.
Technical Implications of a Head and Shoulders Top
A Head and Shoulders Top is a reversal pattern, which often indicates the end of a bullish market or the top of a medium-term uptrend.
Once the price breaks below the neckline, the uptrend is considered reversed, which acts as a sell signal.
Applications of the Head and Shoulders Top Pattern
Since the pattern signals a trend reversal and a potential major top, it is used to identify short-selling or exit opportunities. Here are the three most common sell zones:
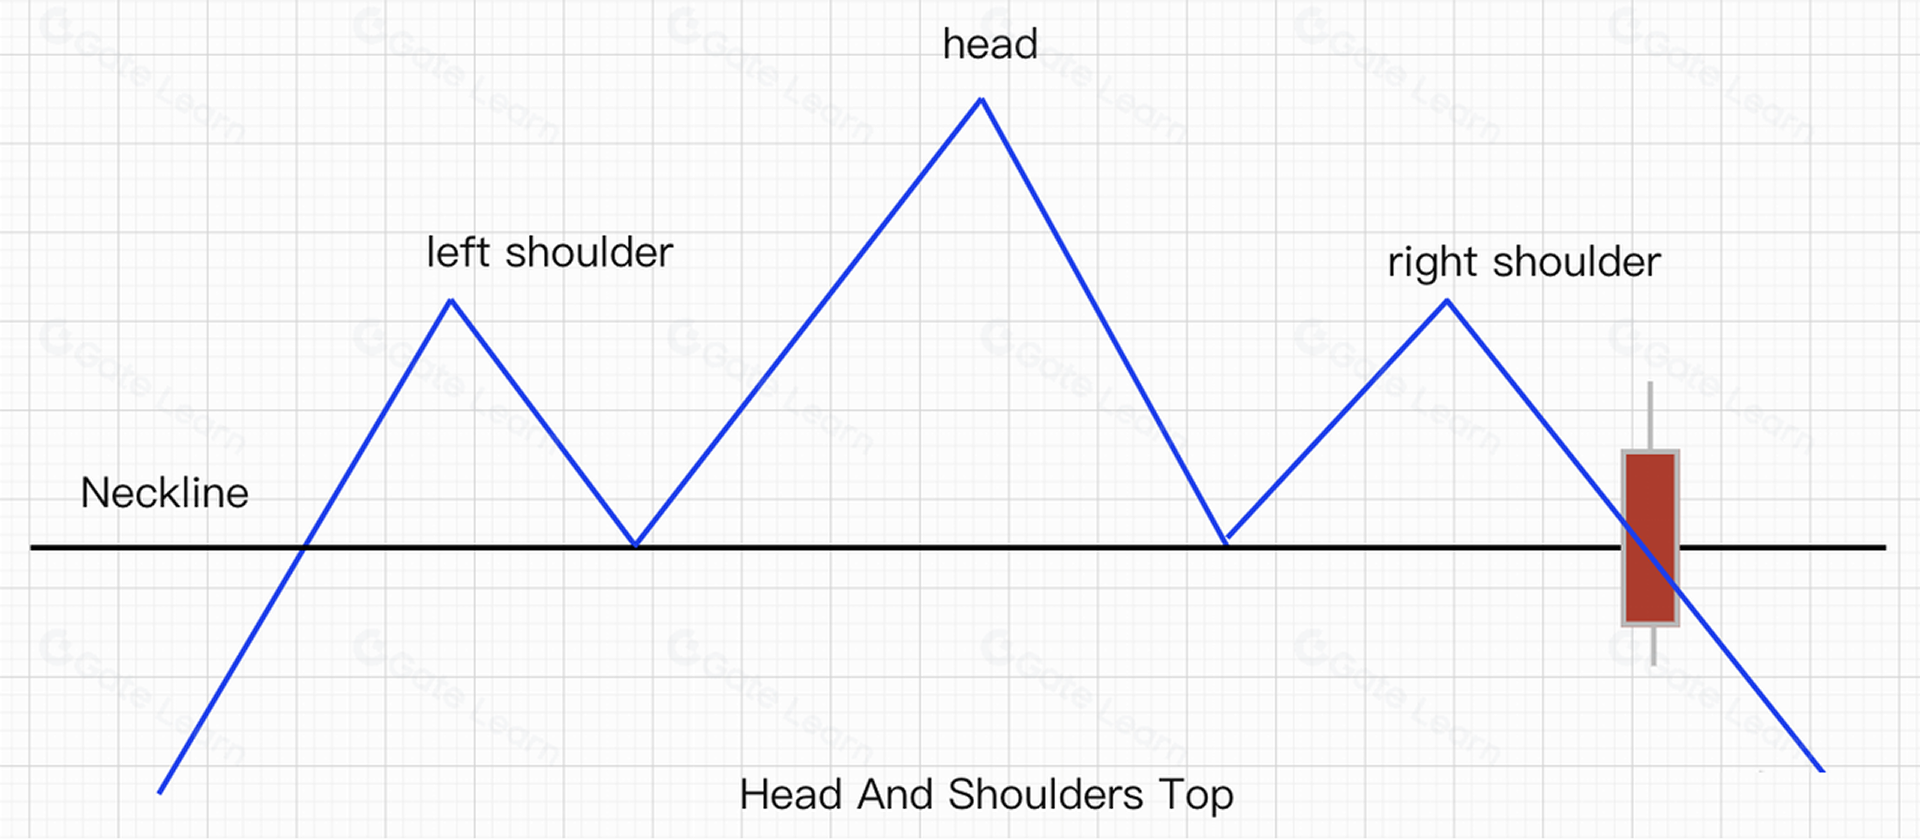
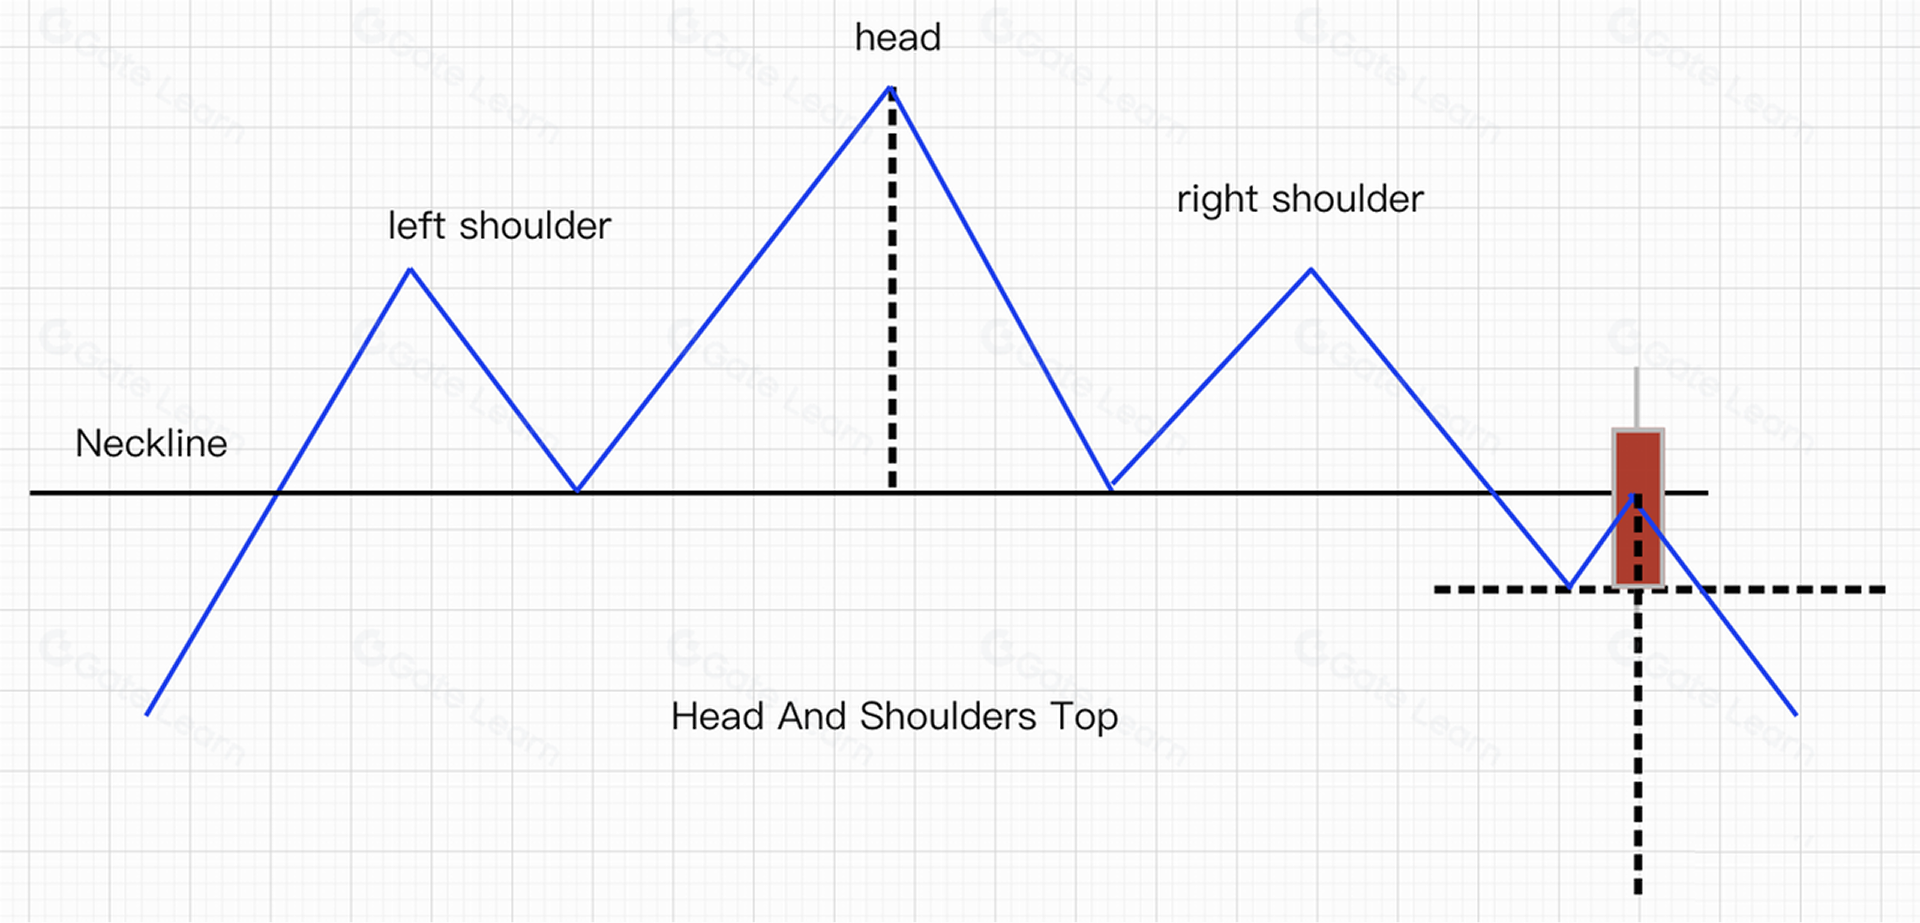
1.In a Head and Shoulders Top pattern, if the price drops through the neckline and closes with a solid bearish candle, this is the first sell signal. At this point, the probability of further downside increases significantly. See the figure below:
2.In a Head and Shoulders Top pattern, if price rebounds and fails to reclaim the neckline after breaking the neckline and forms a bearish close, it constitutes the second sell signal—typically more reliable than the first. See the figure below:
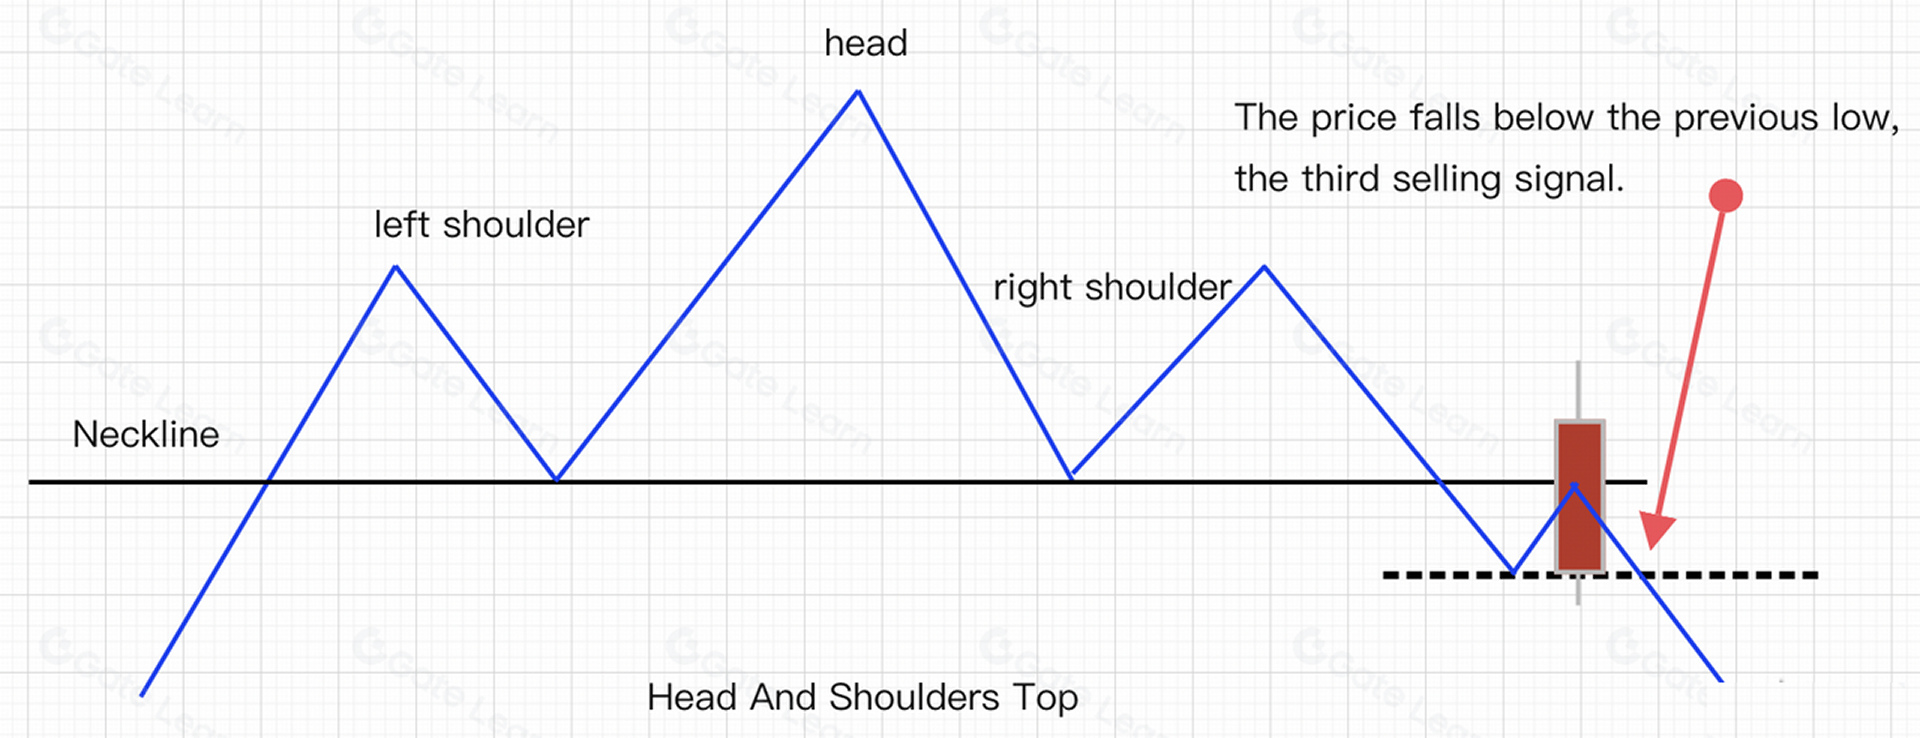
3.In a Head and Shoulders Top pattern, if the price extends its decline and breaks the prior swing low, a third sell signal forms. See the figure below:
Summary of Head and Shoulders Top Trading Rules
To apply the pattern, you need to confirm the three components: left shoulder, head, right shoulder, and draw the critical bullish/bearish reference—the neckline.
Trading opportunities arise when price breaks key levels:
- Selling Opportunity #1: Break below the neckline
- Selling Opportunity #2: Retest fails and price drops again
- Selling Opportunity #3: Break below the previous low
- Head and Shoulders Top can also be used to estimate the future drop. After the price breaks the neckline, measure the vertical distance from the top of the head to the neckline and project the same distance downward starting from the breakdown point. This gives the minimum expected decline.
Real-Market Examples
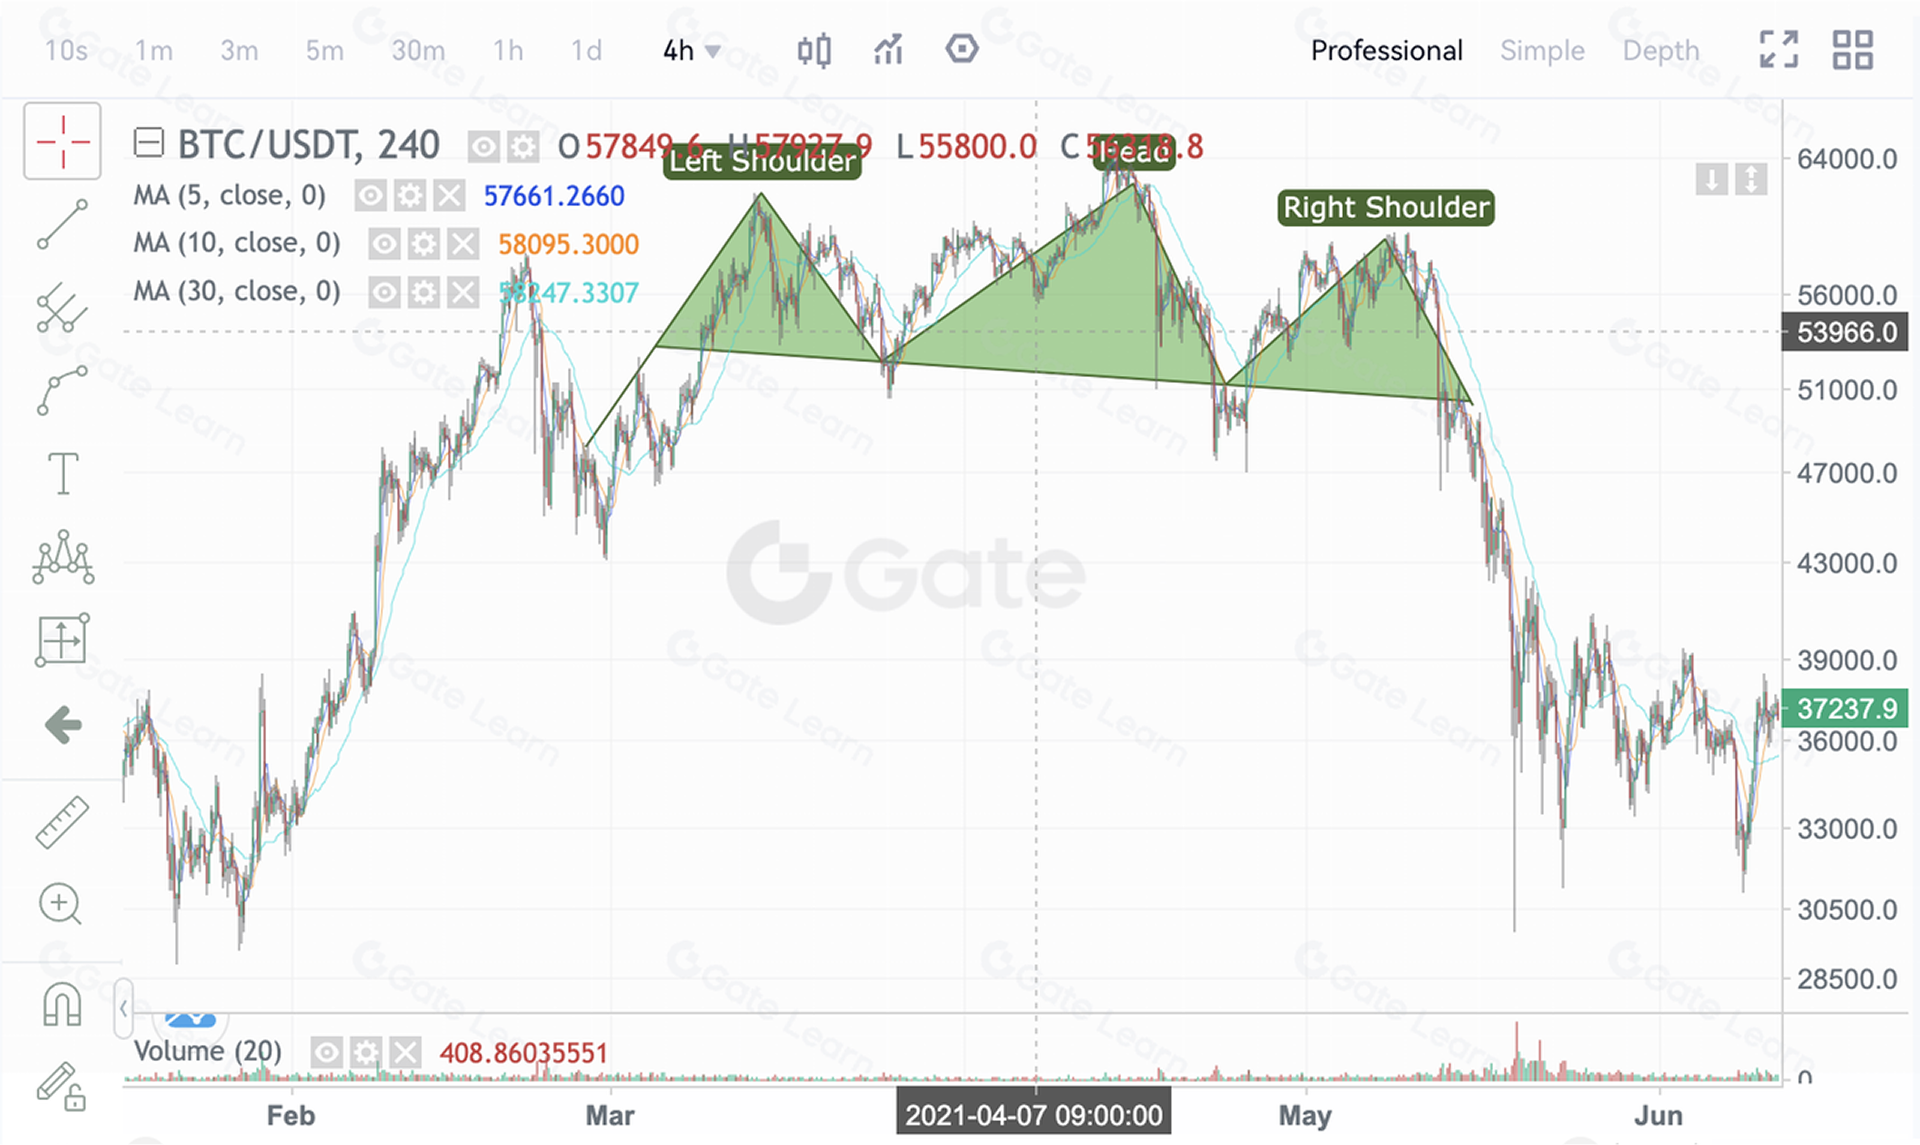
1.BTC Head and Shoulders Top Example
In the BTC 4-hour chart from late 2020 to May 2021, BTC surged from $10,000 to $64,000—a gain of over 600%. As bullish momentum weakened, the price consolidated at the top and formed a Head and Shoulders Top. When the price broke below the neckline to $47,000, a major one-year downtrend began.
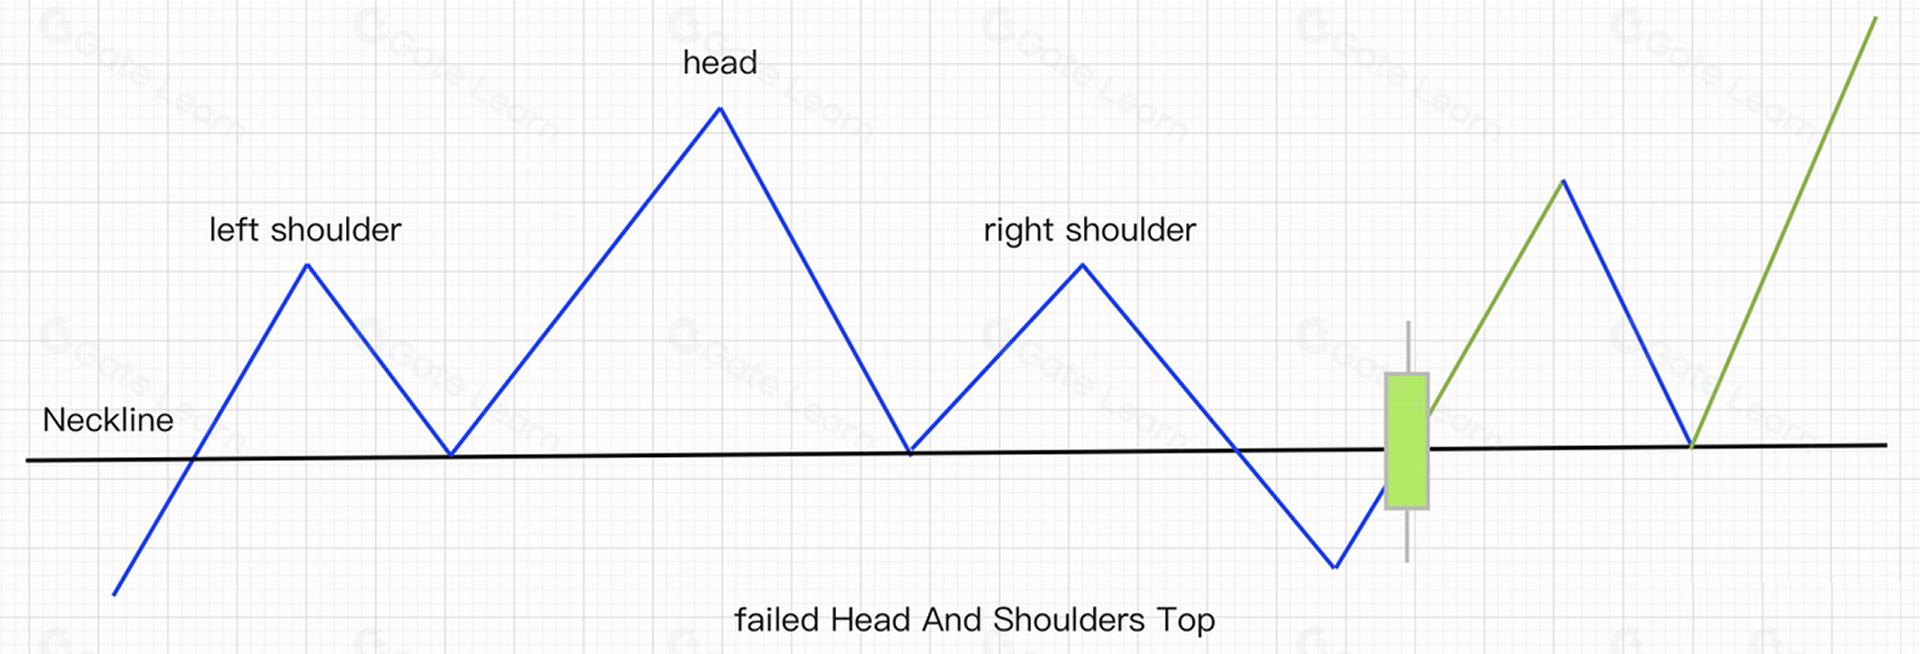
2.Failed Head and Shoulders Top Example
If price breaks below the neckline but quickly rebounds with a strong bullish candle, holding above support, the pattern may fail. See the figure below:
In such cases, short positions should be taken cautiously.
Summary
Whether a Head and Shoulders Top appears at the top of a long-term trend or a medium-term rally, a break below the neckline confirms a reversal. Trends have inertia—once confirmed, they tend to continue in that direction. Thus, the breakdown of the neckline is a genuine sell signal. Even though prices are already off the peak at this stage, the decline is usually just beginning, and traders who have not exited should still consider selling.
Apply what you’ve learned and train through practice—only then can you navigate the futures market with confidence. Visit the Gate futures platform and sign up to start your futures trading journey.
Disclaimer
This article is for informational purposes only. The information provided by Gate does not constitute investment advice, nor does Gate bear responsibility for any investment decisions made by users. Content involving technical analysis, market interpretation, trading strategies, or trader insights may include potential risks, uncertainties, and market variables. Nothing in this article guarantees profits, either explicitly or implicitly.
Lesson 1:What Is Technical Analysis in the Crypto Market?
Lesson 2:Common Bullish Candlestick Patterns
Lesson 3:Common Bearish Candlestick Patterns
Lesson 4:Bottom Reversal Pattern—Head and Shoulders Bottom
Lesson 5:How to Use the Top Reversal Pattern—Head and Shoulders Top
Lesson 6:How to Use the Bottom Reversal Pattern—Rounding Bottom
Lesson 7:How to Use the Top Reversal Pattern—Rounding Top
Lesson 8:How to Use the Bottom Reversal Pattern—Double Bottom (W-Shape)
Lesson 9:How to Use the Top Reversal Pattern—Double Top (M-Shape)
Lesson 10:How to Use the Bottom Reversal Pattern—V-Shaped Reversal
Lesson 11:How to Use the Consolidation Pattern—Ascending Triangle
Lesson 12:How to Use the Continuation Pattern—Descending Triangle
Lesson 13:How to Use the Continuation Pattern—Other Triangle Patterns
Lesson 14:How to Use the Continuation Pattern—Flag Pattern
Lesson 15:How to Use the Continuation Pattern—Wedge Pattern
Lesson 16:How to Use the Continuation Pattern—Rectangle Pattern
Lesson 17:Mastering Technical Analysis—Methodology Summary
Related Courses

Tools That Help You Trade Better: Moving Averages, Trend Lines, and Indicators

Gate Futures Trading Guide - A must-read for newbies

Futures Grid Trading User Guide
ETF Leveraged Tokens — Product Guide