Common Bearish Candlestick Patterns
Gate Learn's intermediate futures series helps users build a structured framework for technical analysis, covering candlestick basics, chart patterns, moving averages, and trendlines, as well as technical indicators. In this session, we introduce common bearish candlestick combinations to help traders identify downside signals in real trading scenarios and seize better trading opportunities.
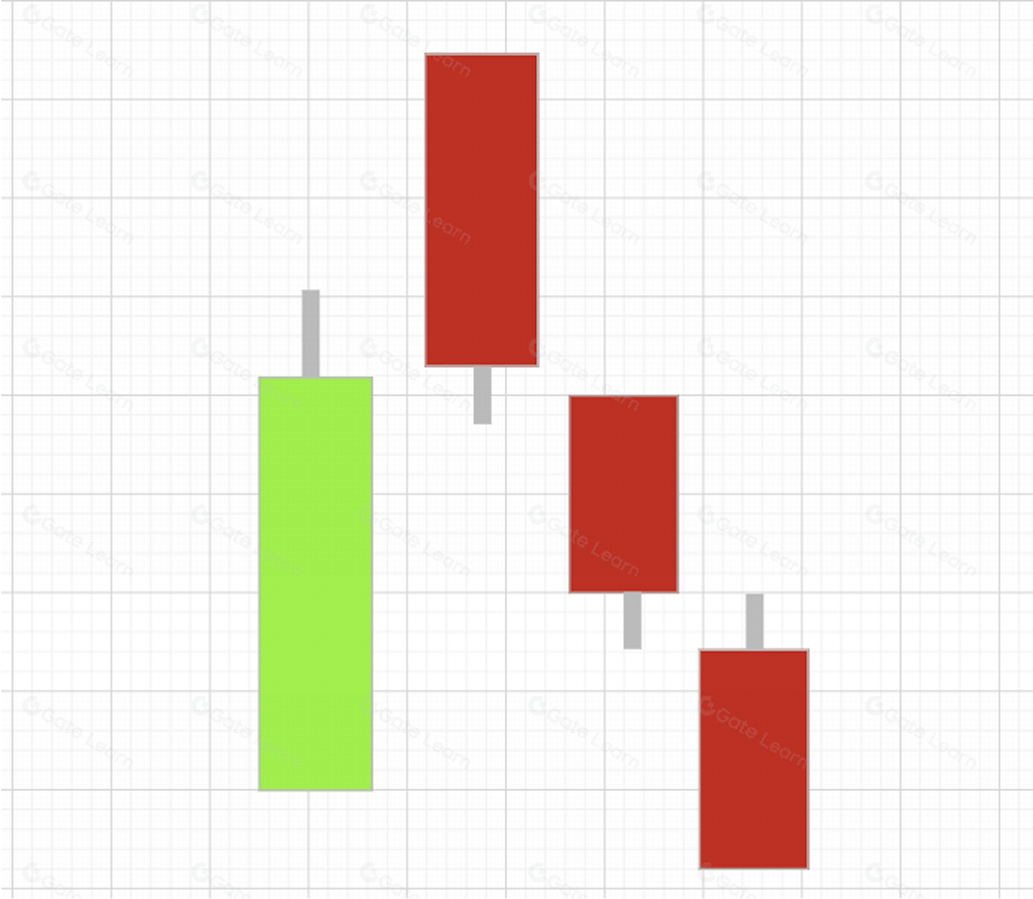
Evening Star
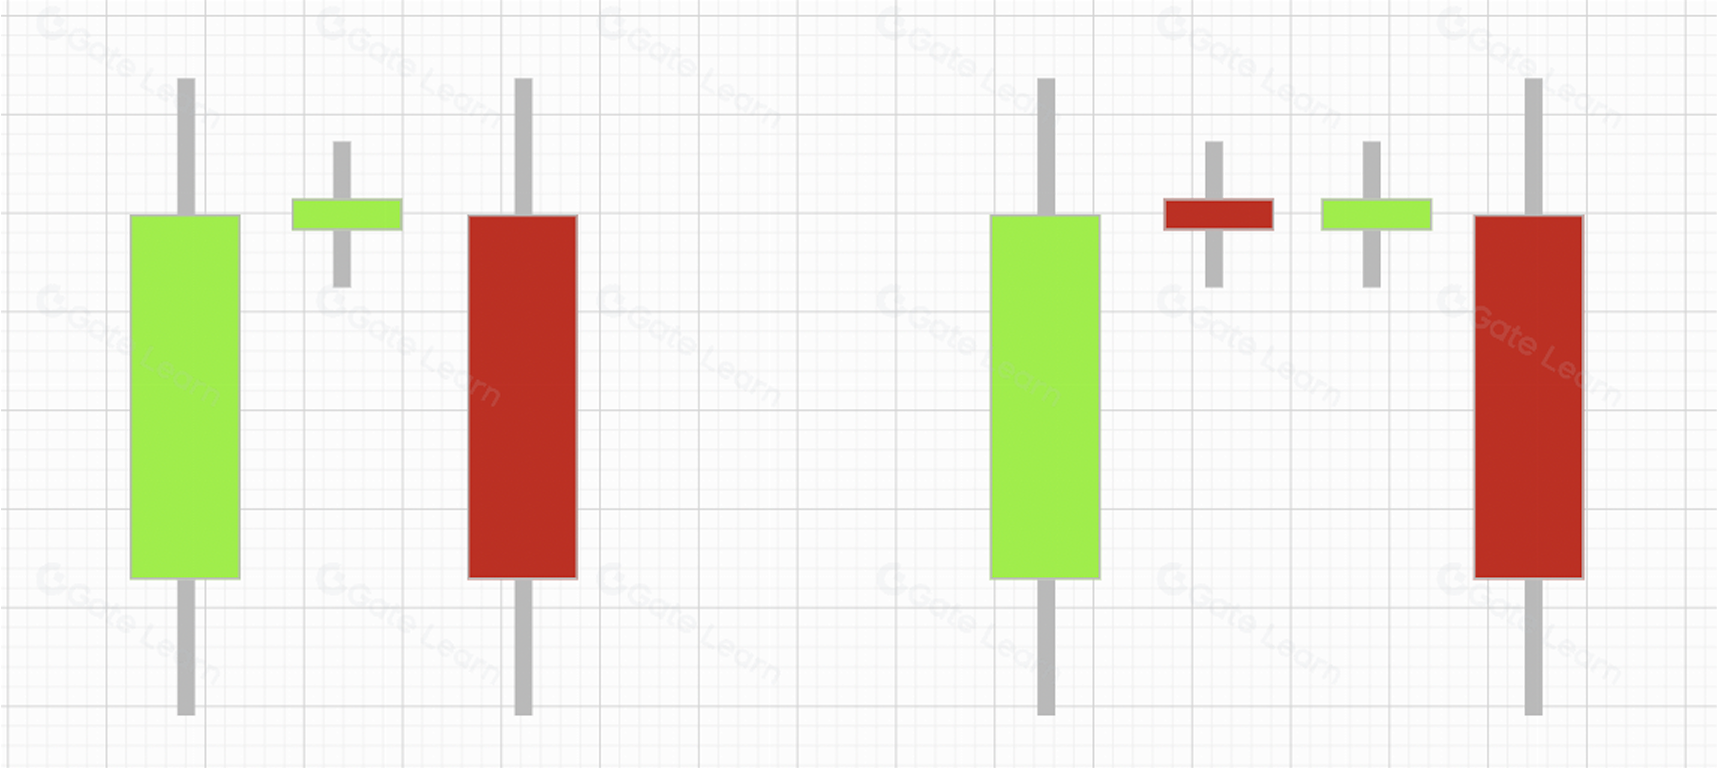
Technical Characteristics
(1) Appears in an uptrend;
(2) Consists of three candlesticks: a bullish candle, followed by a small-bodied candle (bullish, bearish, or a doji) with a gap up, and then a bearish candle;
(3) The body of the third bearish candle penetrates deeply into the body of the first bullish candle.Technical Implication The Evening Star is a bearish reversal signal indicating a market top. A sell is recommended; the market outlook turns bearish.
Dark Cloud Cover
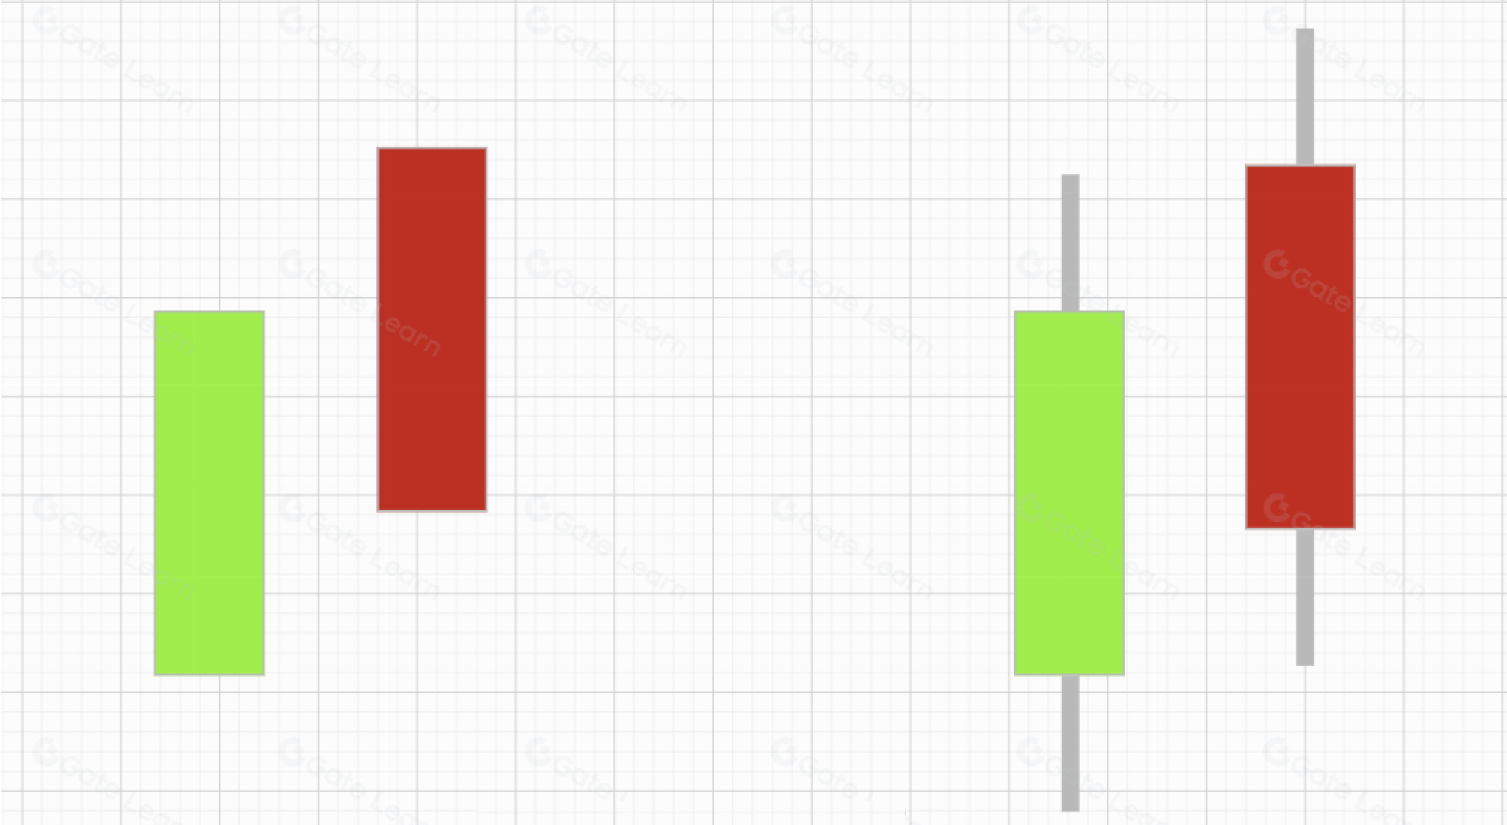
Technical Characteristics
(1) Appears in an uptrend;
(2) Consists of two candles, one bullish followed by one bearish;
(3) A large bullish candle is followed by a bearish candle that gaps up;
(4) The bearish candle closes below the midpoint of the preceding bullish candle.Technical Implication Dark Cloud Cover signals a potential top. The outlook is bearish.
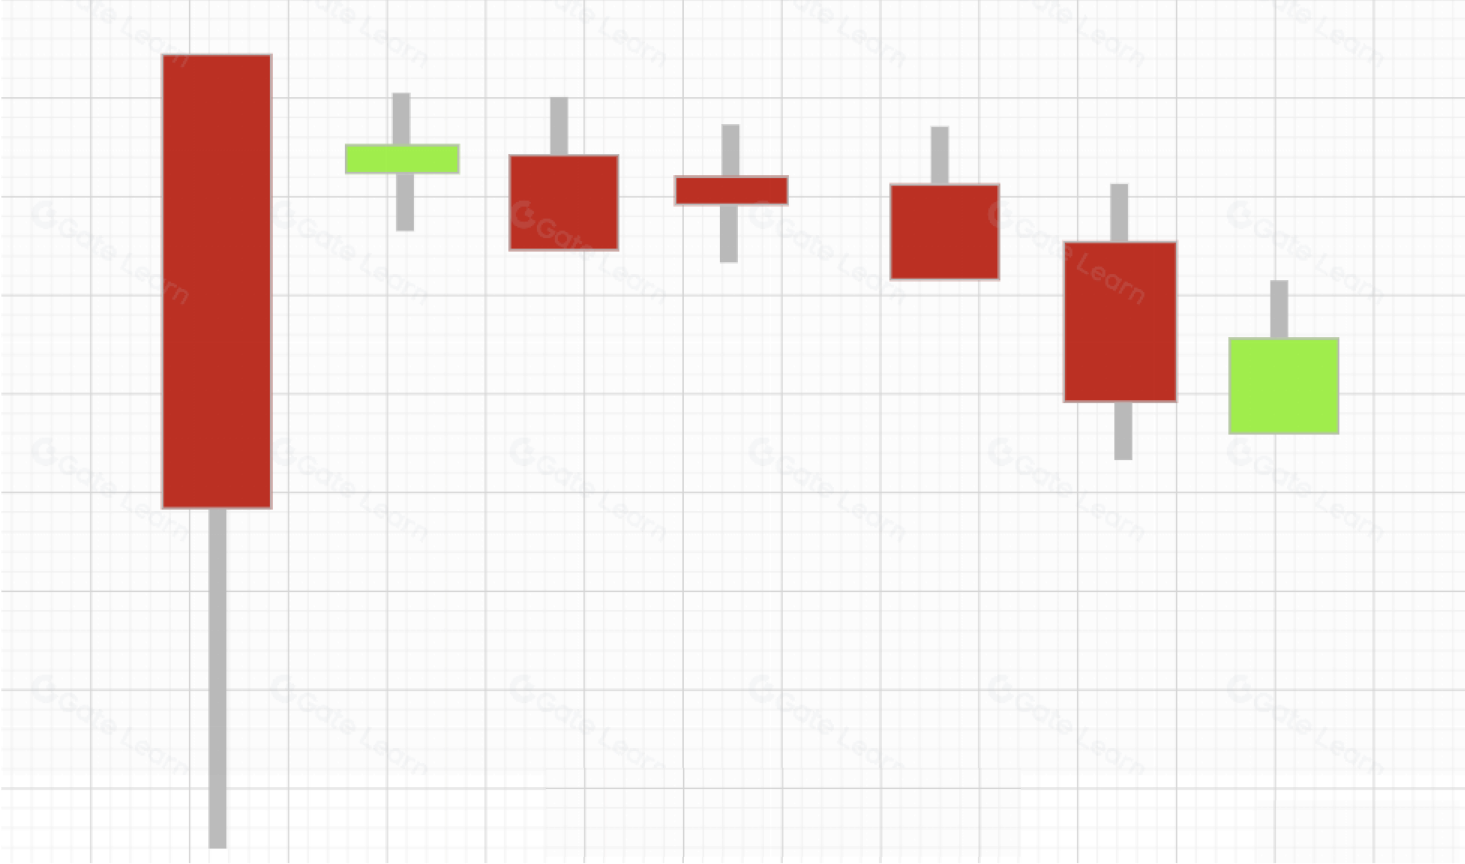
Rounding Top
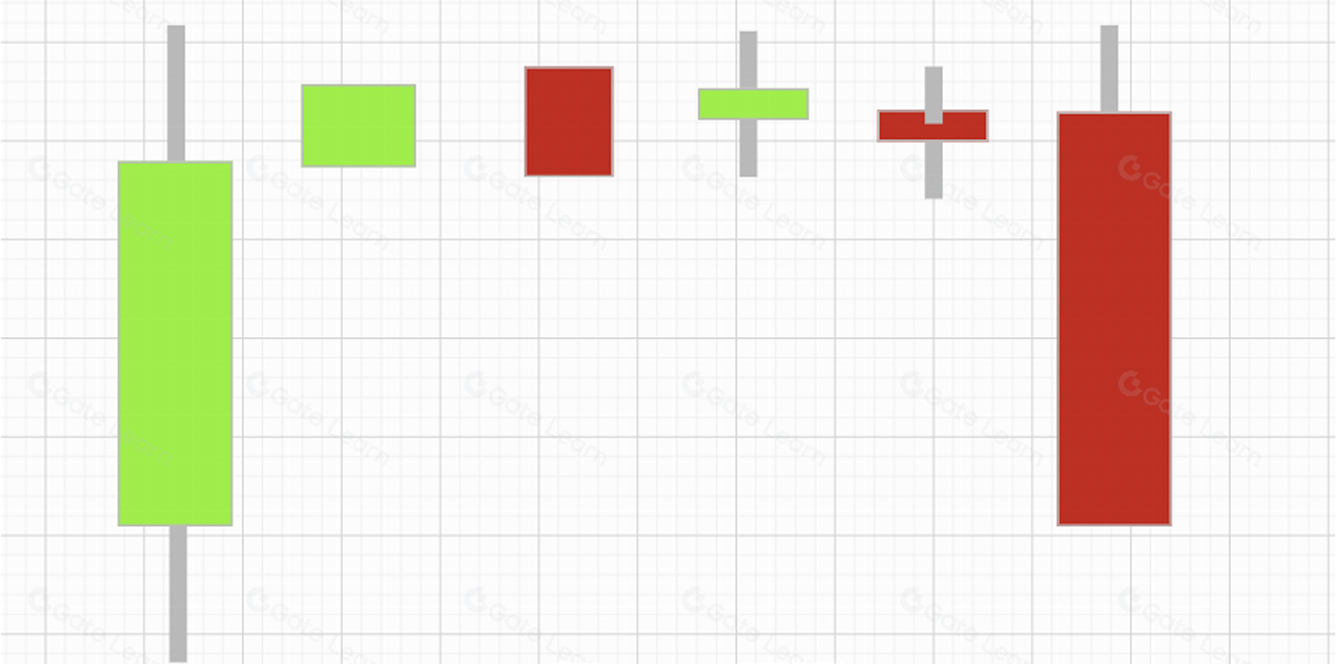
Technical Characteristics
(1) Appears during an uptrend or sideways consolidation;
(2) A large bullish candle is followed by a series of small candles forming a rounded, dome-like top.Technical Implication A Rounding Top indicates a market top and an upcoming trend reversal. The outlook is bearish.
Three Black Crows
Technical Characteristics
(1) Appears in an uptrend;
(2) Consists of three consecutive gap-up long bearish candles.Technical Implication Three Black Crows is a strong bearish reversal signal. Selling is advised; the outlook is bearish.
Relentless Decline
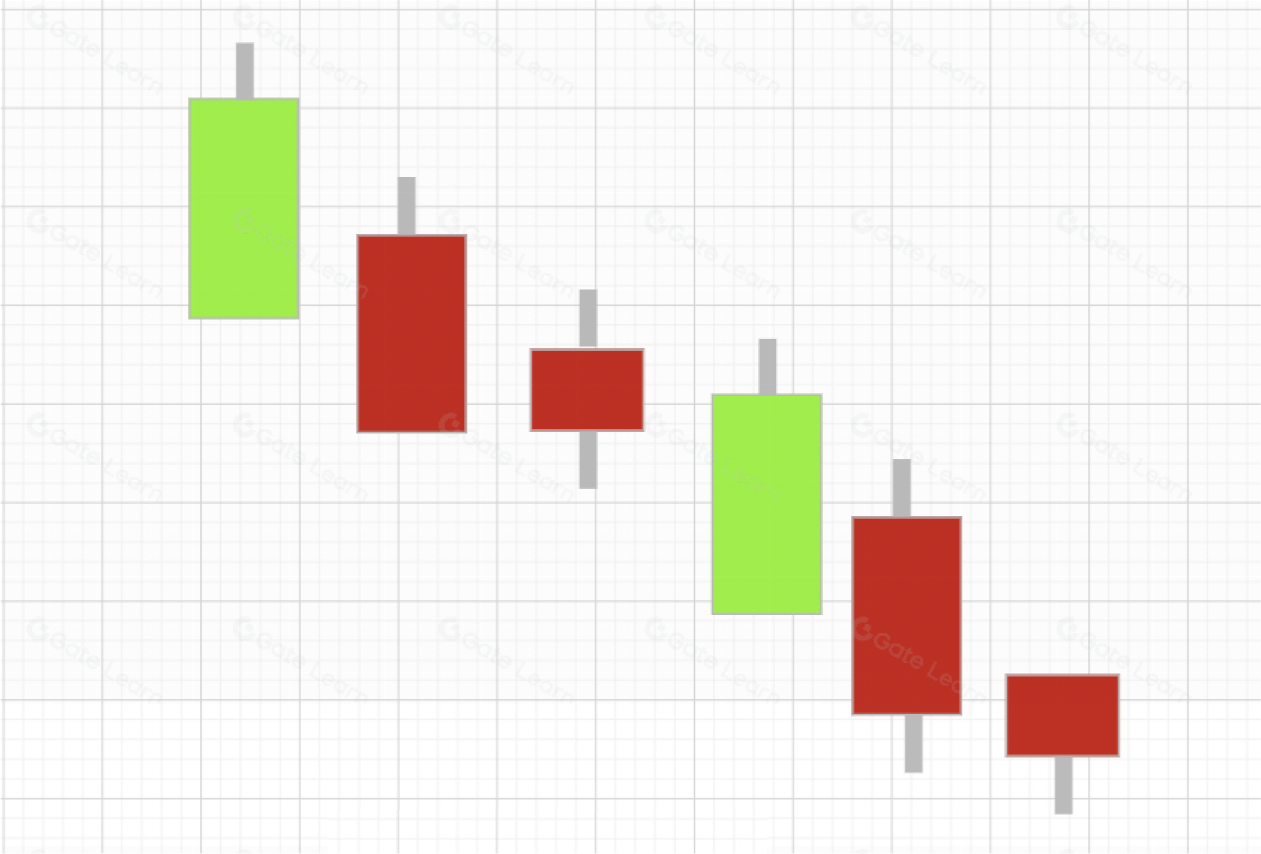
Technical Characteristics
(1) Appears in a downtrend;
(2) Mostly bearish candles with only a few small bullish candles in between;
(3) The overall candlestick structure tilts downward.Technical Implication Relentless Decline indicates persistent downward pressure. A sell is recommended.
Bearish Guiding Line
Technical Characteristics
(1) Appears in a downward trend;
(2) Consists of several candlesticks;
(3) A long bearish candle appears with a long lower shadow.
(4) After a brief rebound, the price declines again below the lower shadow.Technical Implication Bearish Guiding Line signals further downside. It is a sell indication; the market outlook is bearish.
A Bullish Sandwiched Between Two Bearish
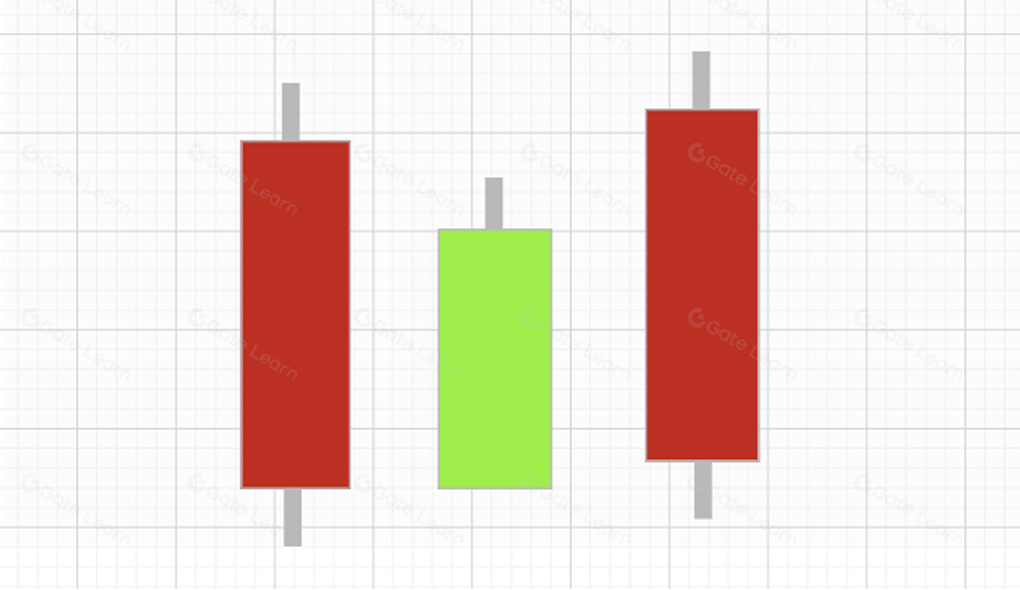
Technical Characteristics
(1) Can appear in both an uptrend and a downtrend;
(2) Consists of two long bearish candles with a shorter bullish candle;
(3) The bullish candle is sandwiched between the two bearish candles.Technical Implication
(1) In an uptrend, it signals a top and suggests selling.
(2) Although it can appear in an uptrend, it is far more common in downtrends.
(3) In a downtrend, it confirms continued bearish momentum.
Summary
This session reviewed common bearish candlestick patterns—explaining their formations and corresponding market signals. In real trading, these patterns must be used flexibly instead of being applied mechanically. Combining them with additional strategies and indicators and applying multi-signal confirmation will significantly improve win rates. Apply what you’ve learned and train through practice—only then can you navigate the futures market with confidence. Visit the Gate futures platform and sign up to start your futures trading journey.
Disclaimer
This article is for informational purposes only. The information provided by Gate does not constitute investment advice, nor does Gate bear responsibility for any investment decisions made by users. Content involving technical analysis, market interpretation, trading strategies, or trader insights may include potential risks, uncertainties, and market variables. Nothing in this article guarantees profits, either explicitly or implicitly.
Lesson 1:What Is Technical Analysis in the Crypto Market?
Lesson 2:Common Bullish Candlestick Patterns
Lesson 3:Common Bearish Candlestick Patterns
Lesson 4:Bottom Reversal Pattern—Head and Shoulders Bottom
Lesson 5:How to Use the Top Reversal Pattern—Head and Shoulders Top
Lesson 6:How to Use the Bottom Reversal Pattern—Rounding Bottom
Lesson 7:How to Use the Top Reversal Pattern—Rounding Top
Lesson 8:How to Use the Bottom Reversal Pattern—Double Bottom (W-Shape)
Lesson 9:How to Use the Top Reversal Pattern—Double Top (M-Shape)
Lesson 10:How to Use the Bottom Reversal Pattern—V-Shaped Reversal
Lesson 11:How to Use the Consolidation Pattern—Ascending Triangle
Lesson 12:How to Use the Continuation Pattern—Descending Triangle
Lesson 13:How to Use the Continuation Pattern—Other Triangle Patterns
Lesson 14:How to Use the Continuation Pattern—Flag Pattern
Lesson 15:How to Use the Continuation Pattern—Wedge Pattern
Lesson 16:How to Use the Continuation Pattern—Rectangle Pattern
Lesson 17:Mastering Technical Analysis—Methodology Summary
Related Courses

Tools That Help You Trade Better: Moving Averages, Trend Lines, and Indicators

Gate Futures Trading Guide - A must-read for newbies

Futures Grid Trading User Guide
ETF Leveraged Tokens — Product Guide