How to Use the Continuation Pattern—Flag Pattern
Gate Learn's intermediate-level futures series helps users build a structured framework for technical analysis, covering candlestick basics, chart patterns, moving averages and trendlines, as well as the application of technical indicators. In this lesson, we will explain the application of the consolidation pattern—the flag pattern—including the concept, characteristics, real BTC trading examples, and key considerations.
What Is a Flag Pattern
The flag pattern is a continuation formation that often appears in the middle of a strong, fast-moving uptrend or downtrend. It almost never forms at the very top of a bull market or the bottom of a bear market. Flag patterns come in two types: the bullish flag and the bearish flag.
In most cases, the flag itself represents the entire corrective or retracement phase within a larger trend. Therefore, once a bullish flag completes, the price typically resumes its upward trend; likewise, a bearish flag usually leads to further downside once it breaks.
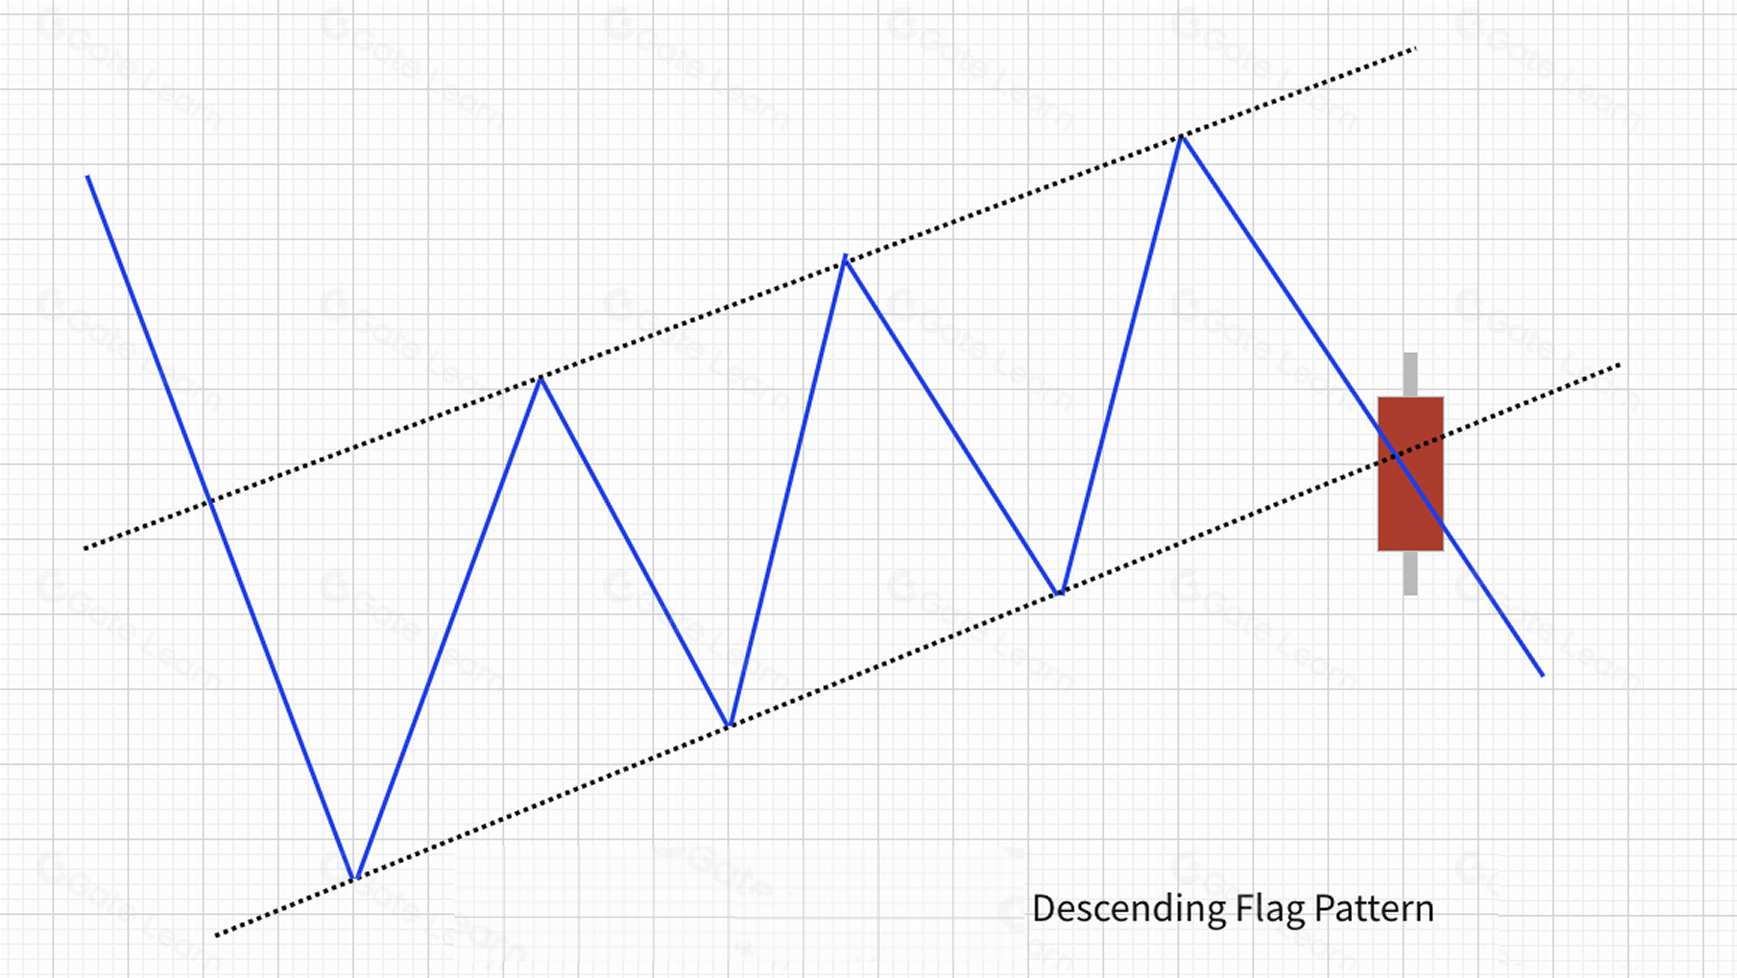
The name originates from the pattern’s resemblance to a flag attached to a pole. See the illustrations below:
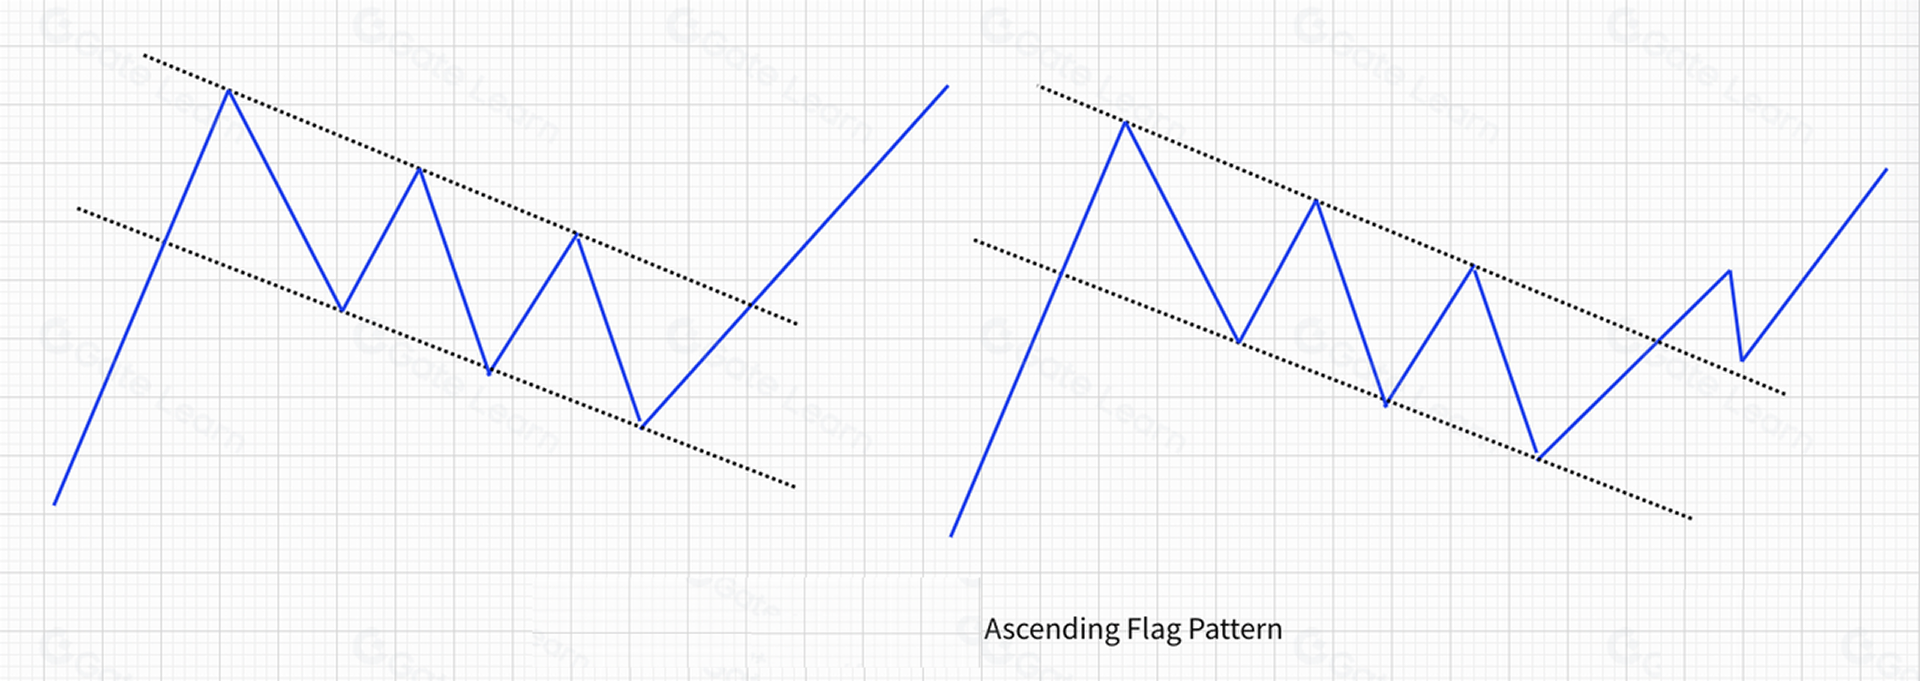
- Bullish Flag
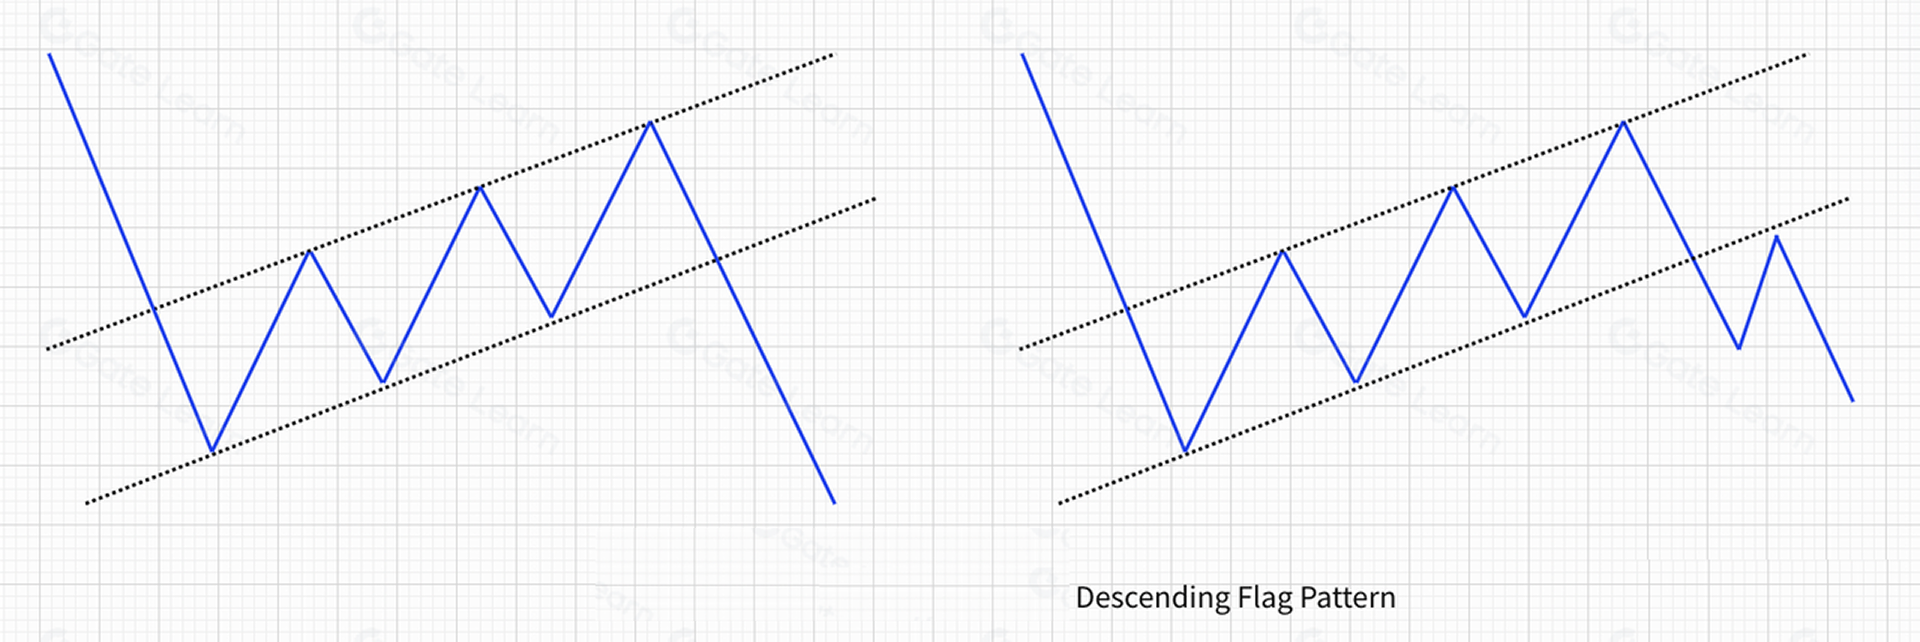
- Bearish Flag
How to Identify a Flag Pattern
- Bullish Flag
- Appears during an uptrend.
- Price surges almost vertically with strong momentum, forming the flagpole. It then enters a consolidation phase, oscillating within a narrow range. By connecting the highs and lows of this consolidation area, two parallel trendlines emerge, forming the flag.
- Trading volume decreases noticeably during the formation of the bullish flag.
- Bearish Flag
- Appears during a downtrend.
- Price drops sharply—often at a near-vertical angle—to form the flagpole. A mild rebound then follows, forming a tight consolidation zone that slightly slopes upward. By connecting the highs to highs and lows to lows, two parallel lines appear, forming the flag.
- Trading volume decreases noticeably during the formation of the bullish flag.
Technical Implications of a Flag Pattern
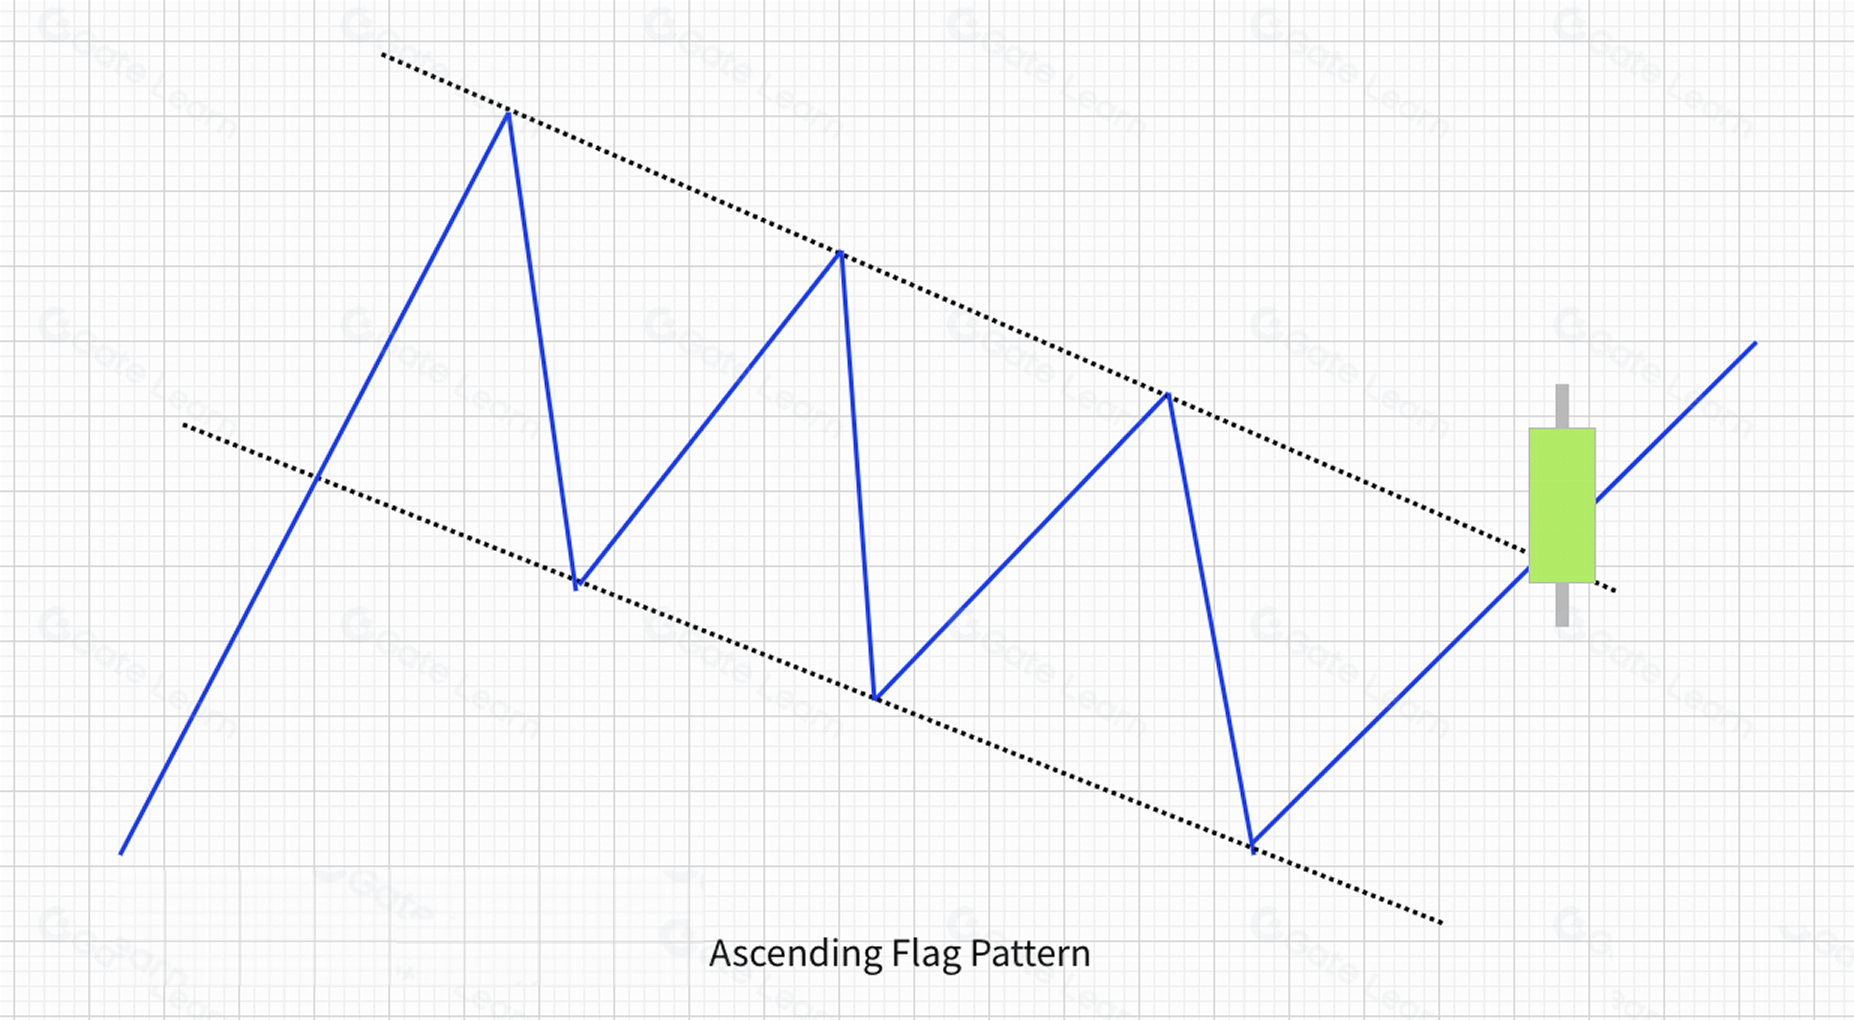
A bullish flag signals a potential continuation of the uptrend once price breaks above the upper boundary—this is generally interpreted as a buy signal.
A bearish flag suggests further downsides when price breaks below the lower boundary—serving as a sell signal.
Applications of the Flag Pattern
When price breaks above the upper boundary of the bullish flag with a solid bullish candlestick, it indicates a continuation of the upward move.
When price breaks below the lower boundary of the bearish flag with a solid bearish candlestick, it signals a continuation of the downtrend.
Real-Market Examples
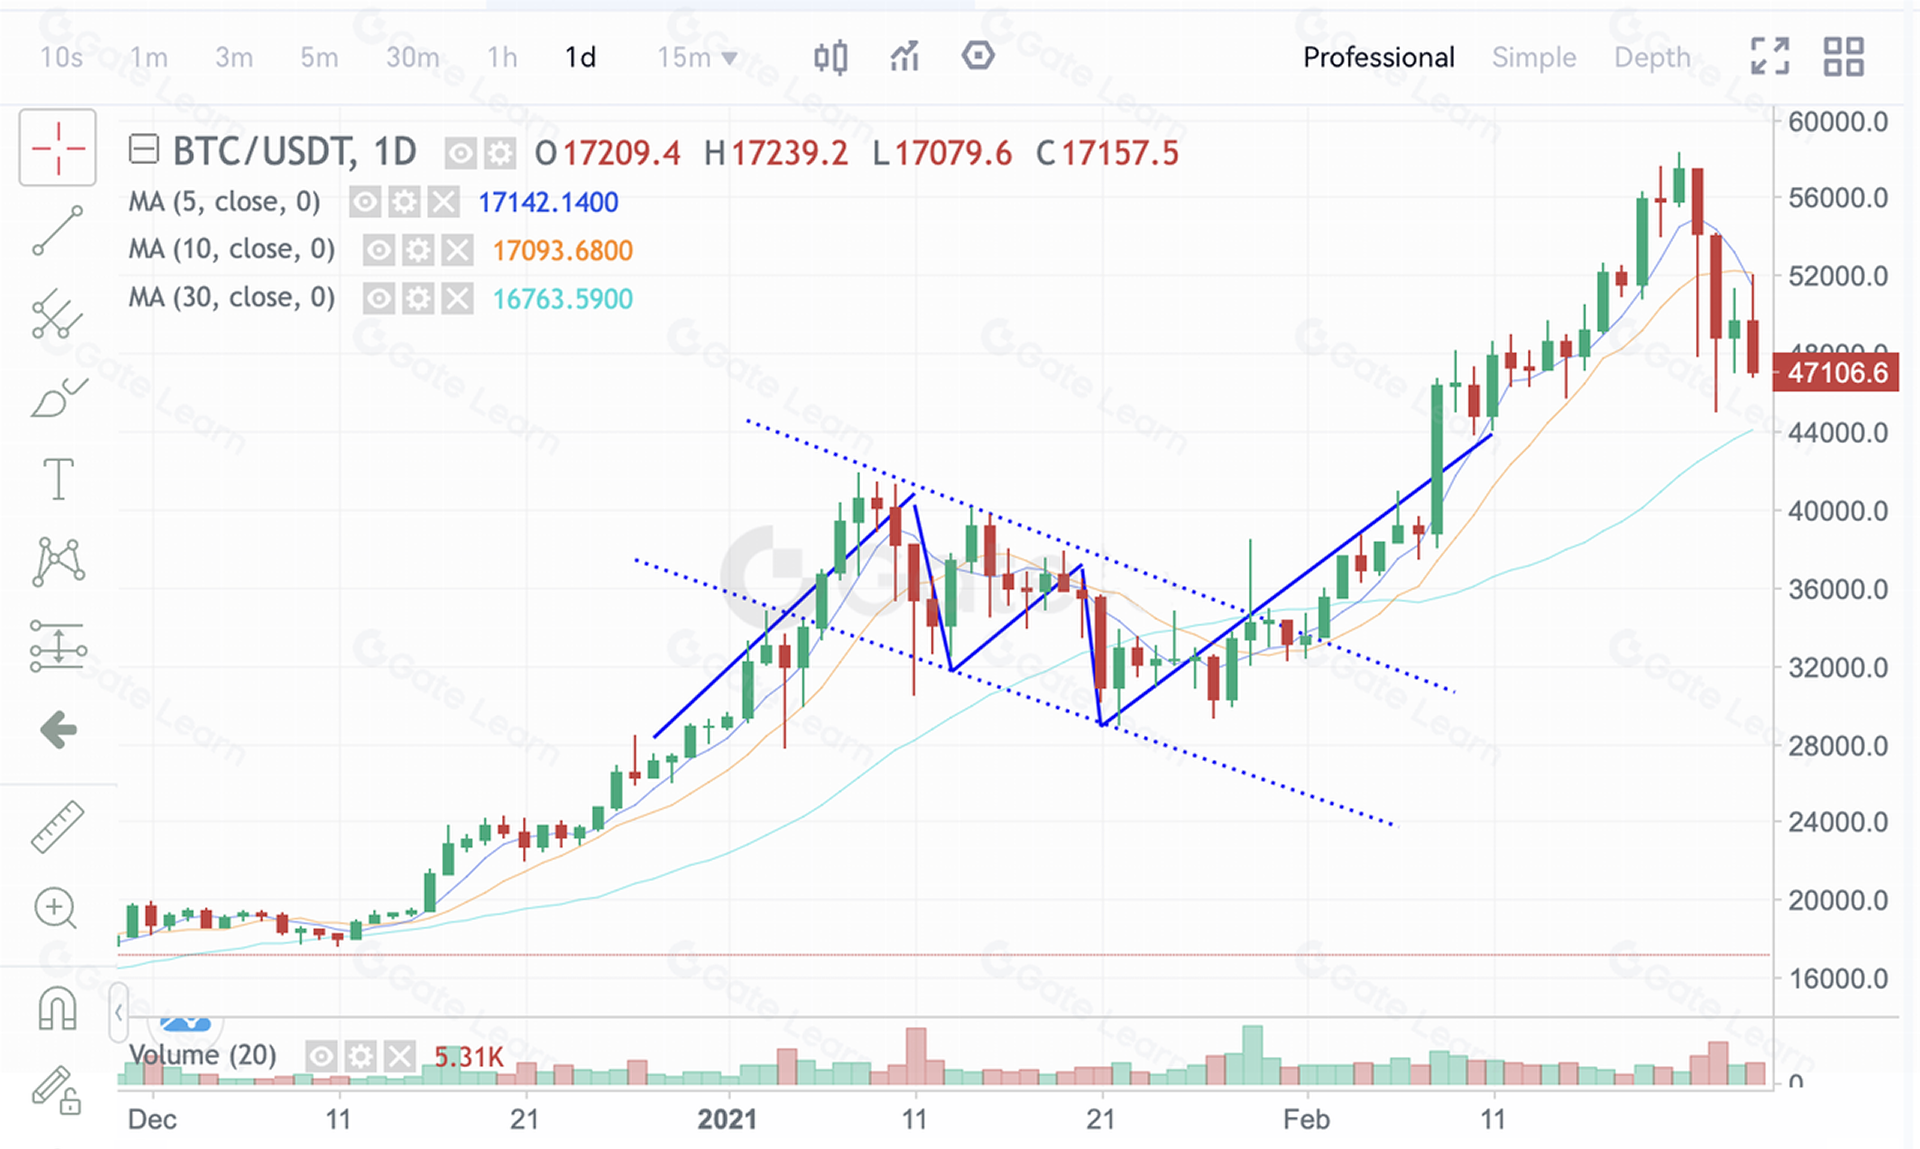
Bullish Flag
The figure above shows the BTCUSDT daily chart on Gate futures from January 1 to February 28, 2020. BTC rallied sharply from $10,000 to around $41,000, then entered a consolidation phase, oscillating between $29,000 and $41,000. Structurally, the price gradually formed a bullish flag. When BTC broke above the upper boundary near $36,000 with strong momentum, it initiated another major rally, eventually reaching $64,000.
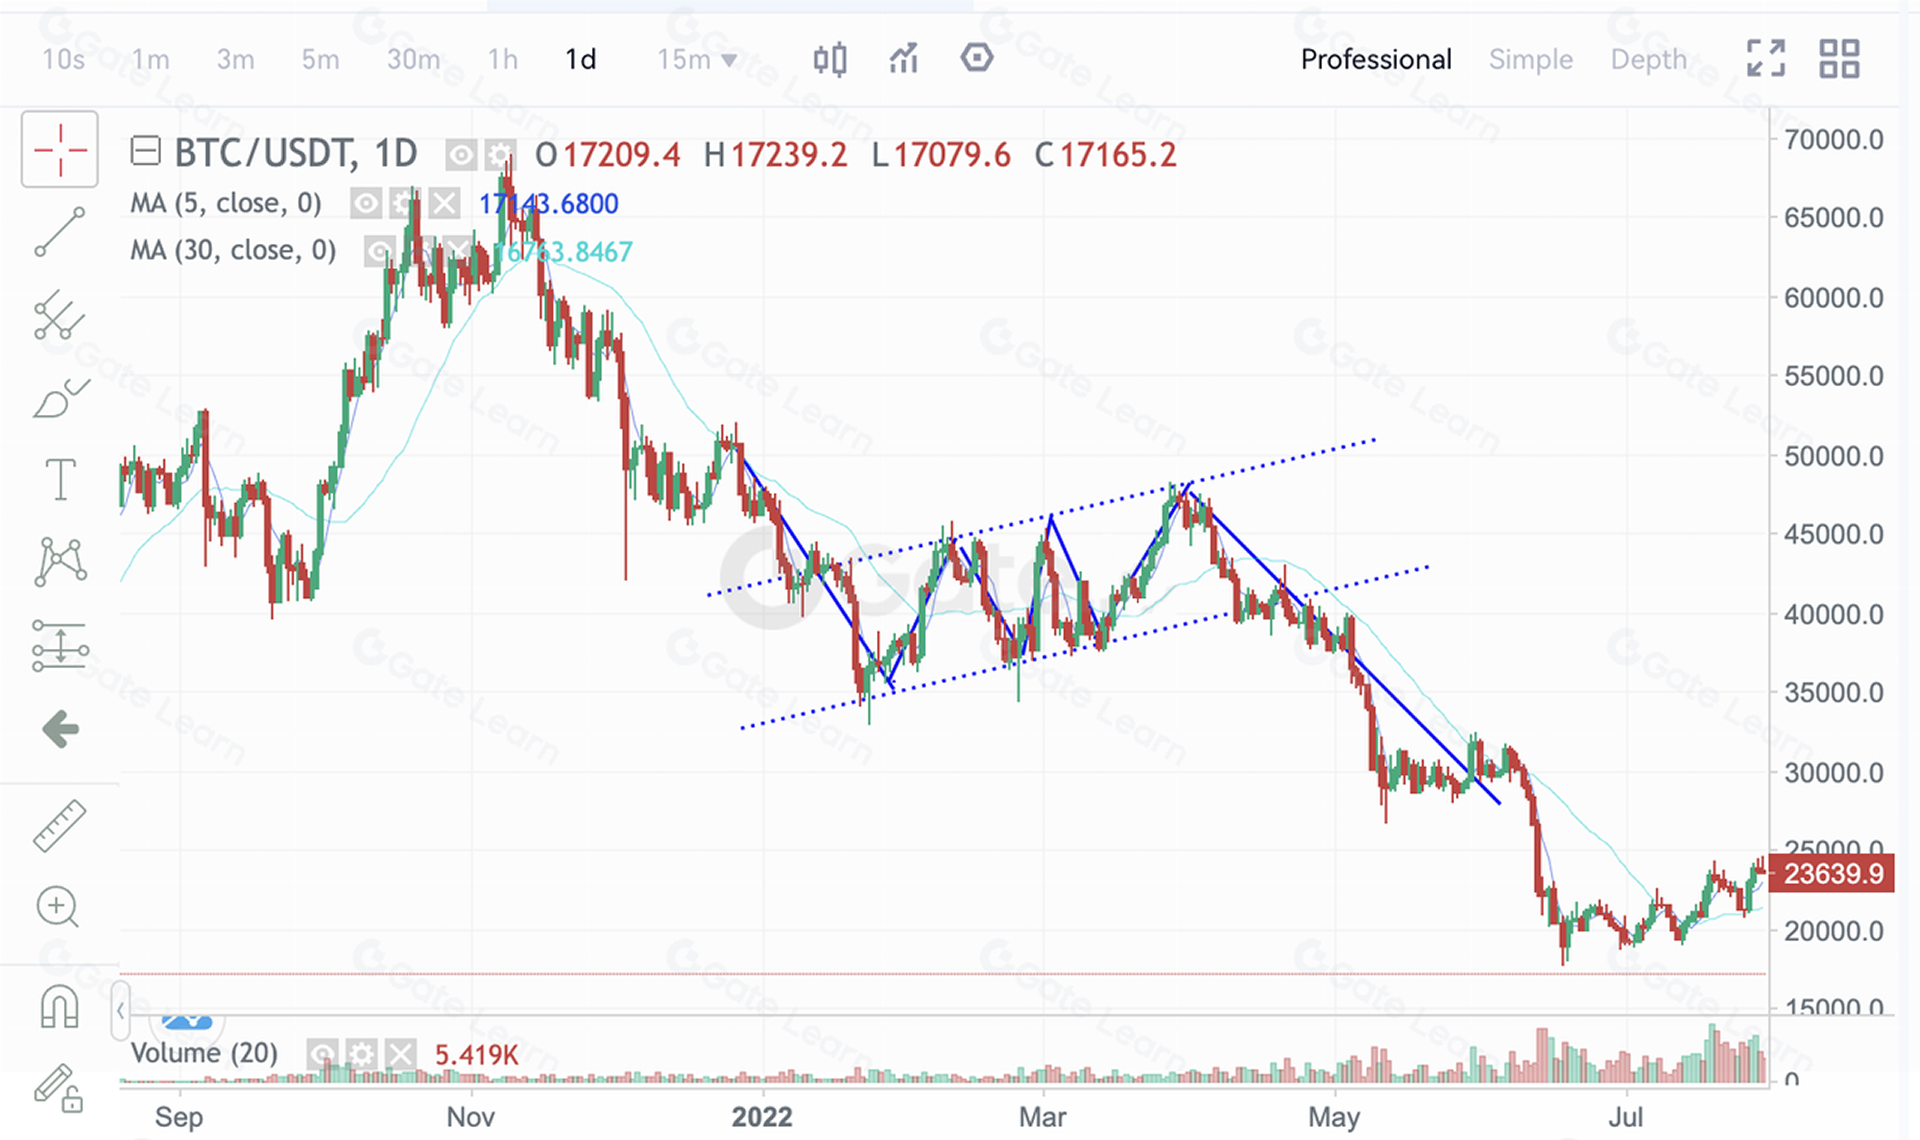
Bearish Flag
This figure above shows the BTCUSDT daily chart on Gate futures from December 28, 2020 to May 13, 2021. BTC plunged from $69,000 high to $33,000, then entered a consolidation phase, oscillating between $33,000 and $45,000. Structurally, the price gradually formed a bearish flag. When BTC broke below the lower boundary near $40,000, it accelerated downward, eventually dropping to as low as $17,000.
Summary
Flag patterns must appear within a sharp, fast-moving trend—either upward or downward. For a bullish flag breakout, strong supporting volume is essential; otherwise, the breakout may be false.
For more futures trading content, visit Gate futures and sign up to start your trading journey.
Disclaimer
This article is for reference only. Information provided by Gate does not constitute investment advice and Gate is not responsible for your investment decisions. Technical analysis, market judgment, trading strategies, and trader insights may involve potential risks, investment variability, and uncertainties. Nothing in this article guarantees returns or implies risk-free opportunities.
Lesson 1:What Is Technical Analysis in the Crypto Market?
Lesson 2:Common Bullish Candlestick Patterns
Lesson 3:Common Bearish Candlestick Patterns
Lesson 4:Bottom Reversal Pattern—Head and Shoulders Bottom
Lesson 5:How to Use the Top Reversal Pattern—Head and Shoulders Top
Lesson 6:How to Use the Bottom Reversal Pattern—Rounding Bottom
Lesson 7:How to Use the Top Reversal Pattern—Rounding Top
Lesson 8:How to Use the Bottom Reversal Pattern—Double Bottom (W-Shape)
Lesson 9:How to Use the Top Reversal Pattern—Double Top (M-Shape)
Lesson 10:How to Use the Bottom Reversal Pattern—V-Shaped Reversal
Lesson 11:How to Use the Consolidation Pattern—Ascending Triangle
Lesson 12:How to Use the Continuation Pattern—Descending Triangle
Lesson 13:How to Use the Continuation Pattern—Other Triangle Patterns
Lesson 14:How to Use the Continuation Pattern—Flag Pattern
Lesson 15:How to Use the Continuation Pattern—Wedge Pattern
Lesson 16:How to Use the Continuation Pattern—Rectangle Pattern
Lesson 17:Mastering Technical Analysis—Methodology Summary
Related Courses
Tools That Help You Trade Better: Moving Averages, Trend Lines, and Indicators

Gate Futures Trading Guide - A must-read for newbies

Futures Grid Trading User Guide
ETF Leveraged Tokens — Product Guide