How to Use the Bottom Reversal Pattern—V-Shaped Reversal
Gate Learn's intermediate-level futures series helps users build a structured framework for technical analysis, covering candlestick basics, chart patterns, moving averages and trendlines, as well as the application of technical indicators. In this lesson, we will explain the application of the bottom reversal pattern—the V-shaped reversal—including the concept, characteristics, real BTC trading examples, and key considerations.
What Is a V-Shaped Reversal
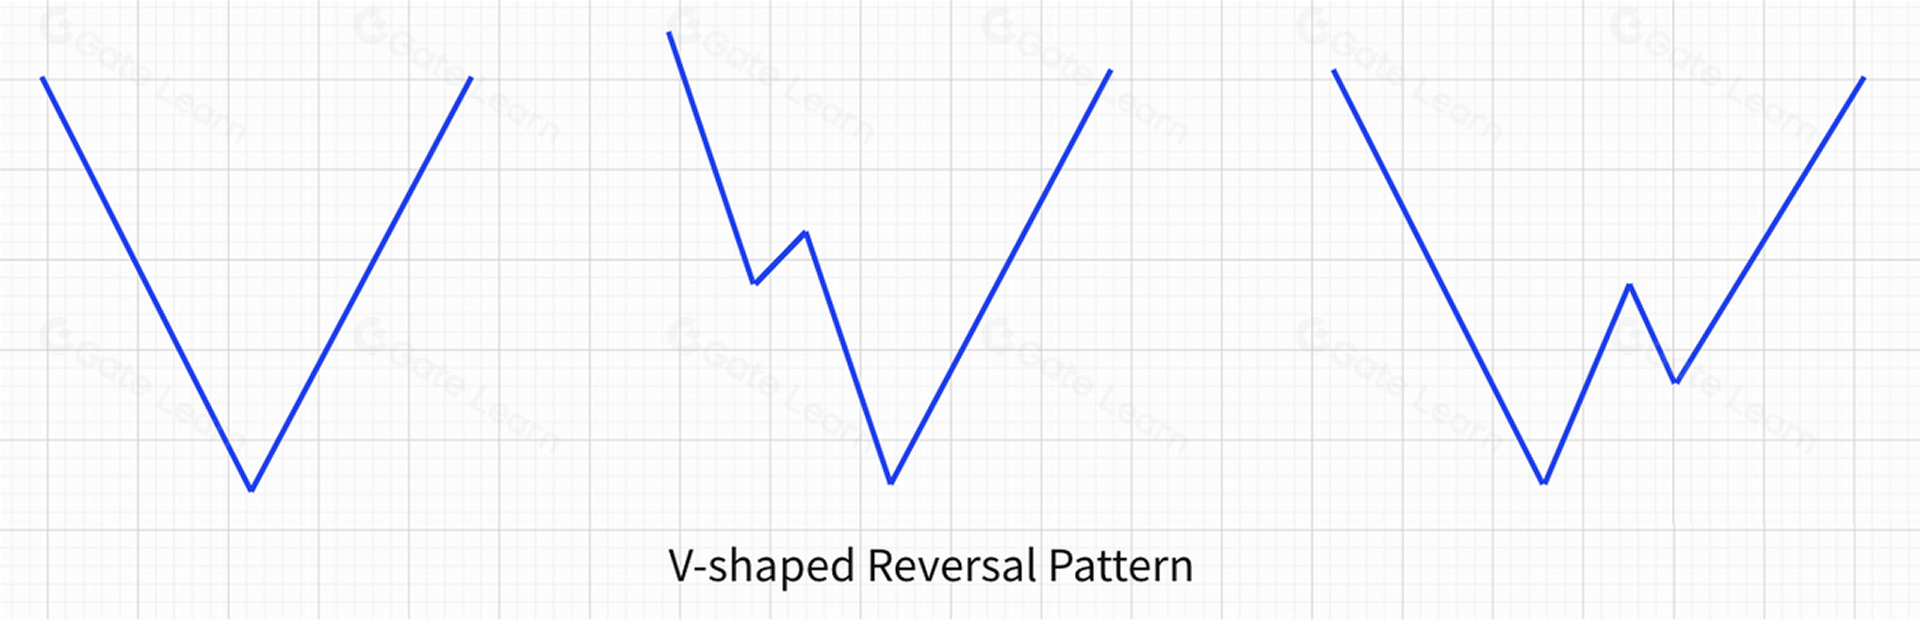
A V-shaped reversal occurs when the price of cryptocurrency suddenly stops falling during a rapid decline and then quickly surges upward with supporting trading volume. Because the transition from falling to rising happens very quickly and the price movement resembles the letter “V,” it is called a V-shaped reversal.
Some V-shaped reversals may exhibit a very brief consolidation period during the upward or downward phase, as shown in the figure below:
How to Identify a V-Shaped Reversal
- Appears during a downtrend, with a rapid decline at a very steep angle.
- The bottom is extremely sharp, reversing sharply in a very short period.
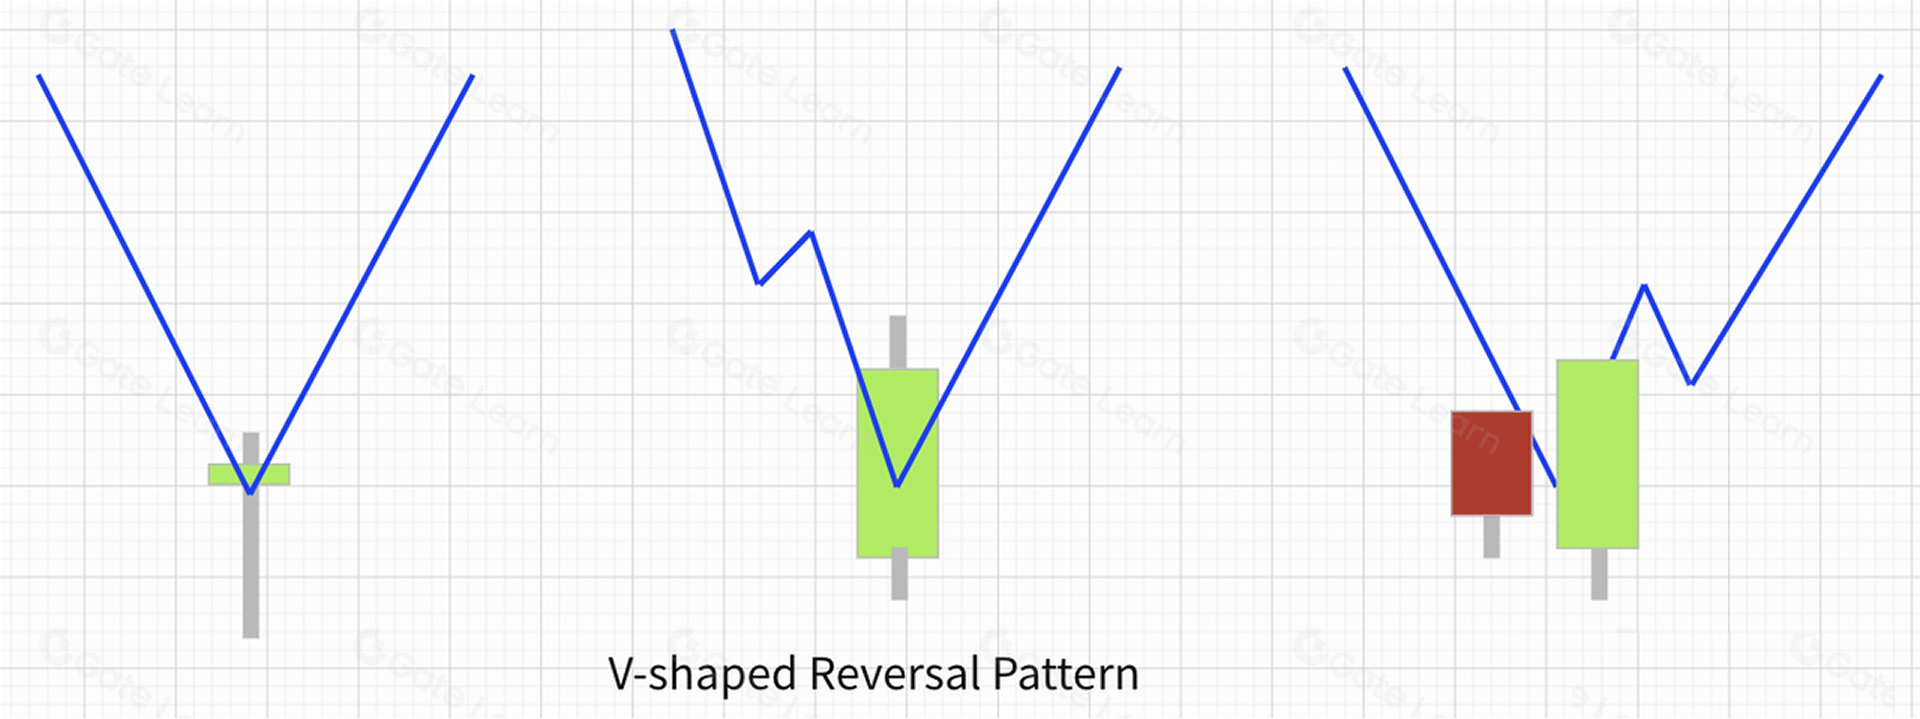
- During the reversal, trading volume rises significantly compared with the decline, and volume continues to increase as the price climbs.
- Some V-shaped reversals may show minor pullbacks during the downward or upward phases.
Technical Implications of a V-Shaped Reversal
A V-shaped reversal accompanied by rising volume and a halt in the decline signals a buying opportunity, and it typically occurs near the end of a downtrend or following sudden positive news.
Applications of the V-Shaped Reversal
The V-shaped reversal serves as a bottom reversal signal. Specific entry signals include:
Buy when the price halts its decline with increasing volume and begins a strong upward move. Combine this with candlestick analysis, such as confirming bullish engulfing patterns or other bullish signals on a full-bodied bullish candlestick.
Real-Market Example
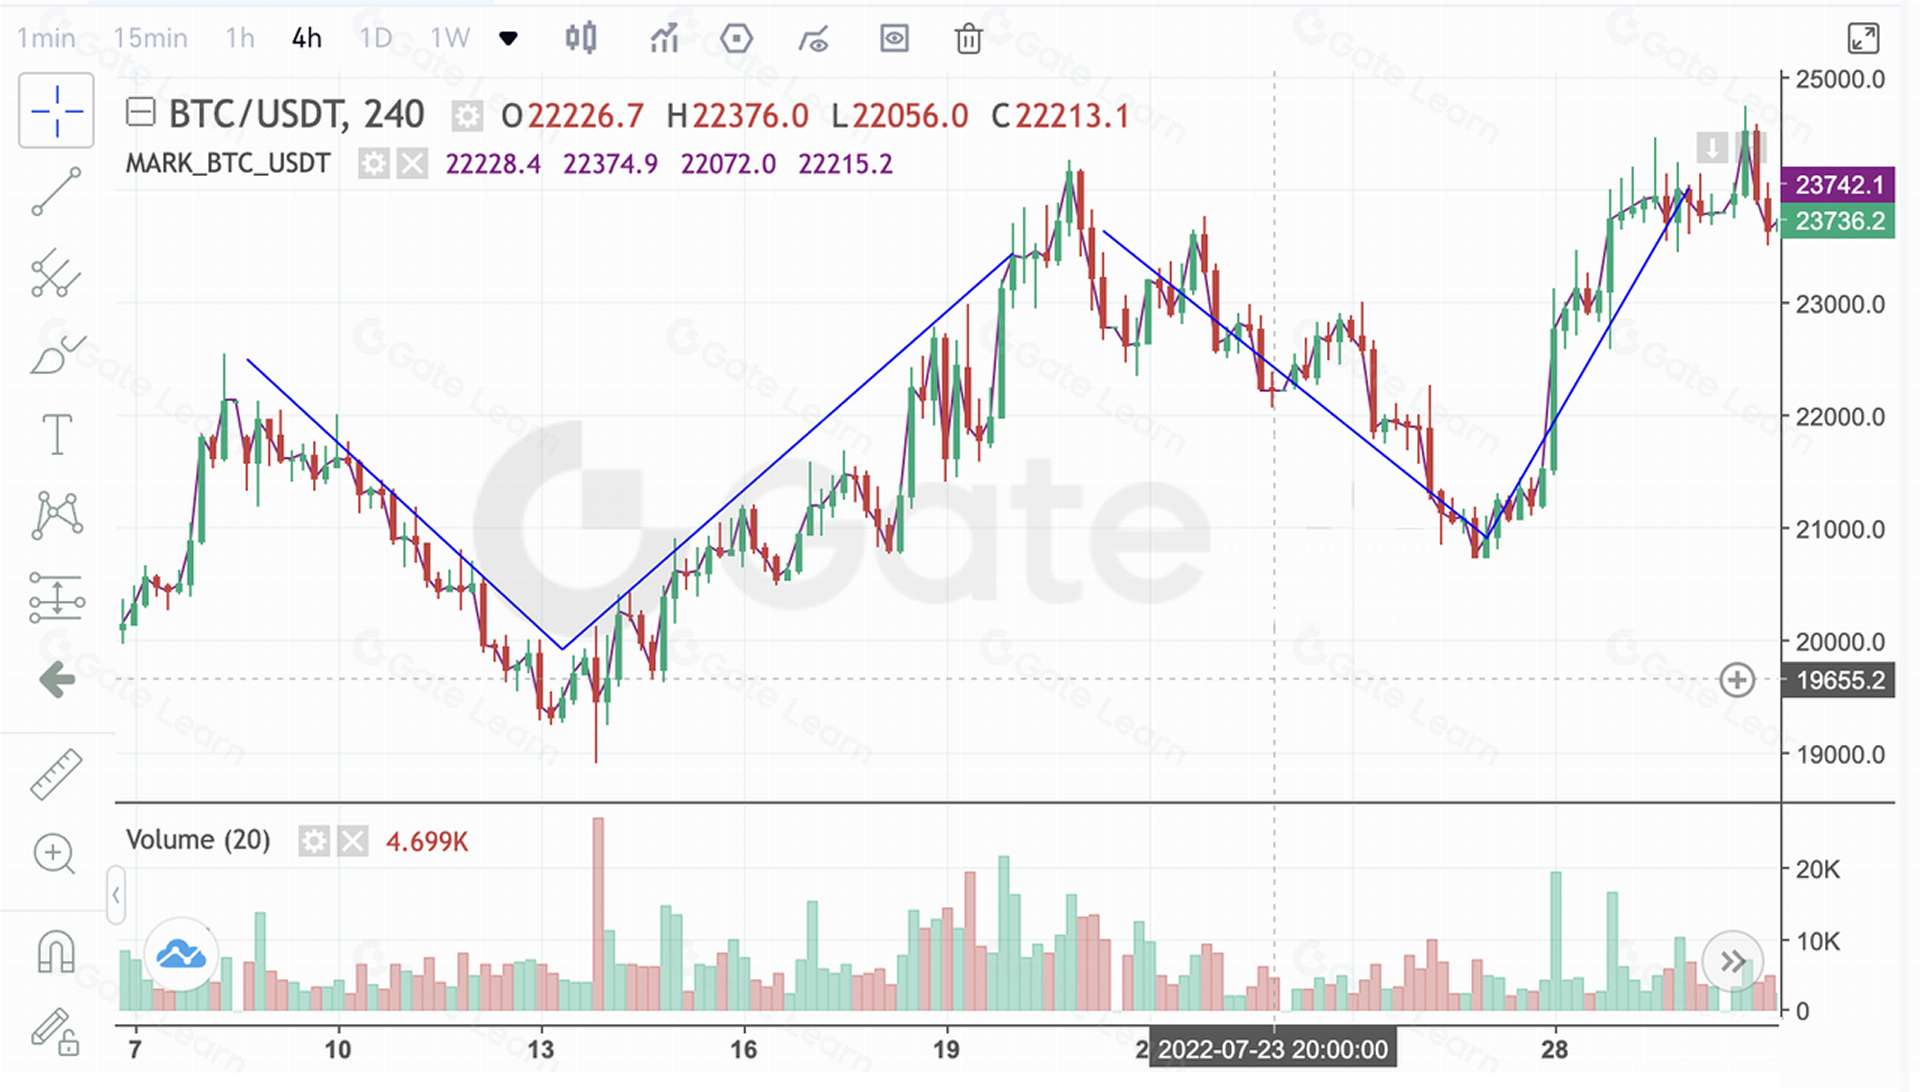
The figure above shows the BTCUSDT 4-hour chart on Gate futures. Between July 28 and July 30, BTC formed two V-shaped reversals. The first declined from $23,000 to a low of $19,000, then rebounded sharply, initiating a strong upward trend that reached $24,000, representing a gain of over 25%.
Other Scenarios
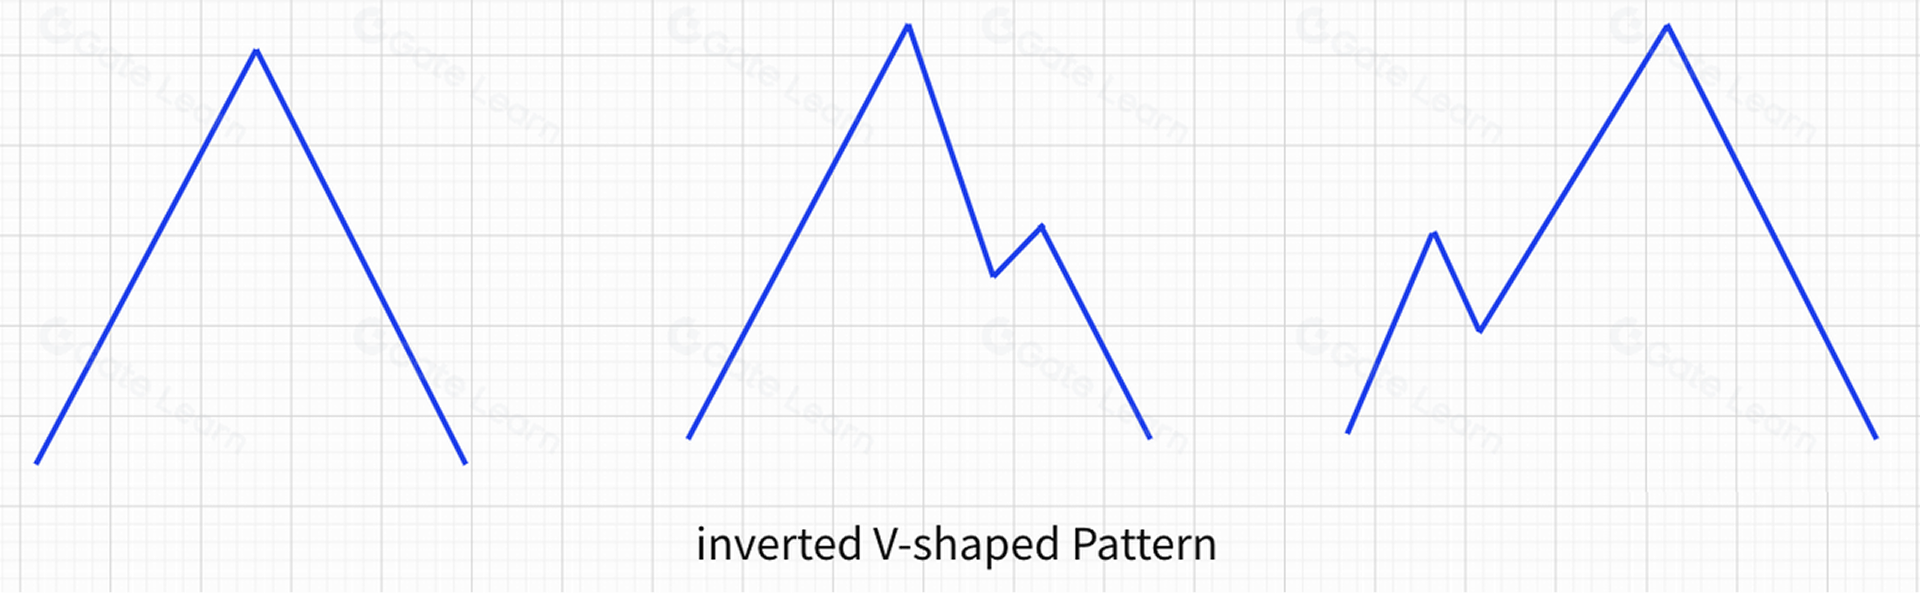
In practice, besides V-shaped reversals, one may encounter inverted V-shaped patterns, which have the opposite implications. Traders need to identify them flexibly, as shown below:
Summary
V-shaped reversals are relatively rare in actual trading. They often occur in strong bull-market continuation phases, where a sharp dip is quickly reversed to form the V-shaped pattern. Traders should apply this pattern flexibly in real trading.
For more futures trading content, visit Gate futures and sign up to start your trading journey.
Disclaimer
This article is for reference only. Information provided by Gate does not constitute investment advice and Gate is not responsible for your investment decisions. Technical analysis, market judgment, trading strategies, and trader insights may involve potential risks, investment variability, and uncertainties. Nothing in this article guarantees returns or implies risk-free opportunities.
Lesson 1:What Is Technical Analysis in the Crypto Market?
Lesson 2:Common Bullish Candlestick Patterns
Lesson 3:Common Bearish Candlestick Patterns
Lesson 4:Bottom Reversal Pattern—Head and Shoulders Bottom
Lesson 5:How to Use the Top Reversal Pattern—Head and Shoulders Top
Lesson 6:How to Use the Bottom Reversal Pattern—Rounding Bottom
Lesson 7:How to Use the Top Reversal Pattern—Rounding Top
Lesson 8:How to Use the Bottom Reversal Pattern—Double Bottom (W-Shape)
Lesson 9:How to Use the Top Reversal Pattern—Double Top (M-Shape)
Lesson 10:How to Use the Bottom Reversal Pattern—V-Shaped Reversal
Lesson 11:How to Use the Consolidation Pattern—Ascending Triangle
Lesson 12:How to Use the Continuation Pattern—Descending Triangle
Lesson 13:How to Use the Continuation Pattern—Other Triangle Patterns
Lesson 14:How to Use the Continuation Pattern—Flag Pattern
Lesson 15:How to Use the Continuation Pattern—Wedge Pattern
Lesson 16:How to Use the Continuation Pattern—Rectangle Pattern
Lesson 17:Mastering Technical Analysis—Methodology Summary
Related Courses
Tools That Help You Trade Better: Moving Averages, Trend Lines, and Indicators

Gate Futures Trading Guide - A must-read for newbies

Futures Grid Trading User Guide
ETF Leveraged Tokens — Product Guide